Free with trial Stock market. The rise and fall of securities. Successful trading. Market trend up green and red down arrows, financial graphs. Business investment growth and loss arrow. Graph going up and down symbol vector illustration. Trend decrease vectors Stock market. The rise and fall of securities. Successful trading. Market trend up green and red down arrows, financial graphs.
Free with trial Green up and red down 3d arrow graph showing rising, descending trend, business result, profit or loss symbol symbol. Business arrow, goals concept. 3d world money symbols. Financial growth. Trend decrease illustrations Green up and red down 3d arrow graph showing rising, descending trend, business result, 3d world money symbols. Financial growth. Green up and red down 3d arrow graph showing rising, descending trend, business result, profit or loss symbol symbol. Business arrow, goals concept. 3d world money symbols. Financial growth
Free with trial Vector icon showing a diagonal arrow pointing down and to the right. Represents direction, decrease, trend, or movement. Simple graphic suitable for charts, diagrams, or interface navigation, vector design Generative AI. Trend decrease vectors Down Right Diagonal Arrow Vector Icon Graphic, vector design Generative AI. Vector icon showing a diagonal arrow pointing down and to the right. Represents direction, decrease, trend, or movement. Simple graphic suitable for charts, diagrams, or interface navigation, vector design Generative AI
Free with trial Stock market. The rise and fall of securities. Successful trading. Market trend up green and red down arrows, financial graphs. Business investment growth and loss arrow. Graph going up and down symbol vector illustration. Trend decrease vectors Stock market. The rise and fall of securities. Successful trading. Market trend up green and red down arrows, financial graphs.
Free with trial Stock market. The rise and fall of securities. Successful trading. Market trend up green and red down arrows, financial graphs. Business investment growth and loss arrow. Graph going up and down symbol vector illustration. Trend decrease vectors Stock market. The rise and fall of securities. Successful trading. Market trend up green and red down arrows, financial graphs.
Free with trial Stock market. The rise and fall of securities. Successful trading. Market trend up green and red down arrows, financial graphs. Business investment growth and loss arrow. Graph going up and down symbol vector illustration. Trend decrease vectors Stock market. The rise and fall of securities. Successful trading. Market trend up green and red down arrows, financial graphs.
Free with trial Stock market. The rise and fall of securities. Successful trading. Market trend up green and red down arrows, financial graphs. Business investment growth and loss arrow. Graph going up and down symbol vector illustration. Trend decrease vectors Stock market. The rise and fall of securities. Successful trading. Market trend up green and red down arrows, financial graphs.
Free with trial Stock market. The rise and fall of securities. Successful trading. Market trend up green and red down arrows, financial graphs. Business investment growth and loss arrow. Graph going up and down symbol vector illustration. Trend decrease vectors Stock market. The rise and fall of securities. Successful trading. Market trend up green and red down arrows, financial graphs.
Free with trial A sharp, zig-zagging black arrow points downwards, symbolizing a significant decrease, loss, or negative trend. Trend decrease vectors Jagged downward arrow indicating decline and loss. A sharp, zig-zagging black arrow points downwards, symbolizing a significant decrease, loss, or negative trend
Free with trial Black and white icon of a bar graph showing a downward trend with an arrow pointing down. Trend decrease illustrations Downward trending bar graph with arrow indicating decrease bar chart decline. Black and white icon of a bar graph showing a downward trend with an arrow pointing down
Free with trial A black and white line illustration depicts a bar chart with bars of decreasing height from left to right. A thick, angular arrow points downwards across the chart, indicating a negative trend. To the upper right of the arrow, a circle contains a dollar sign, representing currency. The overall composition suggests a financial downturn or loss. Trend decrease vectors Bar chart with downward trend arrow and dollar coin. A black and white line illustration depicts a bar chart with bars of decreasing height from left to right. A thick, angular arrow points downwards across the chart, indicating a negative trend. To the upper right of the arrow, a circle contains a dollar sign, representing currency. The overall composition suggests a financial downturn or loss
Free with trial Green up and red down 3d arrow graph showing rising, descending trend, business result, profit or loss symbol symbol. Business arrow, goals concept. 3d world money symbols. Financial growth vector isolated. Trend decrease vectors Green up and red down 3d arrow graph showing rising, descending trend, business result, profit. world money symbols. Green up and red down 3d arrow graph showing rising, descending trend, business result, profit or loss symbol symbol. Business arrow, goals concept. 3d world money symbols. Financial growth vector isolated
Free with trial Green up and red down 3d arrow graph showing rising, descending trend, business result, profit or loss symbol symbol. Business arrow, goals concept. 3d world money symbols. Financial growth vector isolated. Trend decrease vectors Green up and red down 3d arrow graph showing rising, descending trend, business result, profit. world money symbols. Green up and red down 3d arrow graph showing rising, descending trend, business result, profit or loss symbol symbol. Business arrow, goals concept. 3d world money symbols. Financial growth vector isolated
Free with trial Green up and red down 3d arrow graph showing rising, descending trend, business result, profit or loss symbol symbol. Business arrow, goals concept. 3d world money symbols. Financial growth vector isolated. Trend decrease vectors Green up and red down 3d arrow graph showing rising, descending trend, business result, profit. world money symbols. Green up and red down 3d arrow graph showing rising, descending trend, business result, profit or loss symbol symbol. Business arrow, goals concept. 3d world money symbols. Financial growth vector isolated
Free with trial Green up and red down 3d arrow graph showing rising, descending trend, business result, profit or loss symbol symbol. Business arrow, goals concept. 3d world money symbols. Financial growth vector isolated. Trend decrease vectors Green up and red down 3d arrow graph showing rising, descending trend, business result, profit. world money symbols. Green up and red down 3d arrow graph showing rising, descending trend, business result, profit or loss symbol symbol. Business arrow, goals concept. 3d world money symbols. Financial growth vector isolated
Free with trial Green up and red down 3d arrow graph showing rising, descending trend, business result, profit or loss symbol symbol. Business arrow, goals concept. 3d world money symbols. Financial growth vector isolated. Trend decrease vectors Green up and red down 3d arrow graph showing rising, descending trend, business result, profit. world money symbols. Green up and red down 3d arrow graph showing rising, descending trend, business result, profit or loss symbol symbol. Business arrow, goals concept. 3d world money symbols. Financial growth vector isolated
Free with trial A glossy red arrow points downward, symbolizing a decrease or negative financial movement. Trend decrease illustrations A vibrant red arrow curves downwards indicating a sharp decline or negative trend on a white background. A glossy red arrow points downward, symbolizing a decrease or negative financial movement
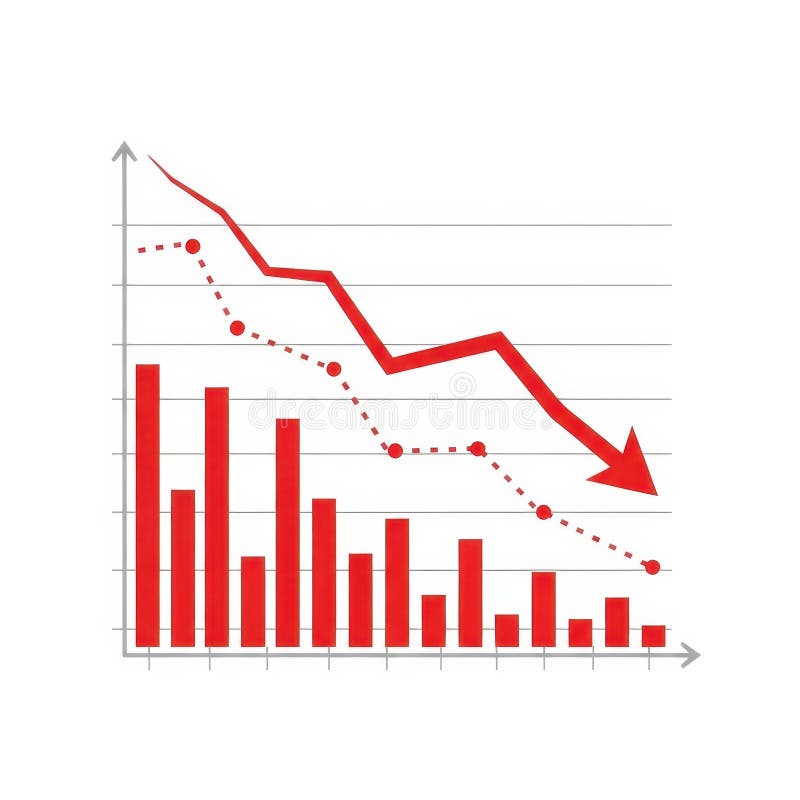
Free with trial The image depicts a bar graph with a downward trend. The bars, colored in blue, start at a higher value and gradually decrease in height, indicating a decline. A red downward-pointing arrow further emphasizes the downward trend. Trend decrease vectors Decline in bar graph. The image depicts a bar graph with a downward trend. The bars, colored in blue, start at a higher value and gradually decrease in height, indicating a decline. A red downward-pointing arrow further emphasizes the downward trend
Free with trial A downward trend is shown on a graph. The graph is black and white. Trend decrease illustrations A downward trend is shown on a graph
Free with trial Symbolizes decline or decrease, often used in financial or performance contexts to represent a downward trend. The arrow is solid red with sharp corners, maintaining a uniform thickness throughout its length. Trend decrease illustrations Red zigzag arrow pointing diagonally downward on a transparent grid background. . Symbolizes decline or decrease, often used in financial or performance contexts to represent a downward trend. The arrow is solid red with sharp corners, maintaining a uniform thickness throughout its length.
Free with trial Downward blue arrow pointing to dollar coin descending beside soft cloud shape. Ideal for finance, economic loss, market decline, decrease, failure, risk, digital economy. Clean flat simple metaphor. Trend decrease vectors Downward Trend in Financial Value with Dollar Symbol and Cloud Motif. Downward blue arrow pointing to dollar coin descending beside soft cloud shape. Ideal for finance, economic loss, market decline, decrease, failure, risk, digital economy. Clean flat simple metaphor
Free with trial Dollar symbols set. Market trend Vector. Dollars rate variation. Currency arrow movement. Manual vector only. No autotrace used. EPS 10. Trend decrease vectors Dollar symbols set. Market trend Vector. Dollars rate variation. Currency arrow movement. Manual vector only. No autotrace used.
Free with trial A 3D blue bar chart and a dark blue line graph illustrate a significant downward trend, indicating a decline in data over time. Trend decrease illustrations Blue bar chart and line graph showing downward trend. A 3D blue bar chart and a dark blue line graph illustrate a significant downward trend, indicating a decline in data over time.
Free with trial Graph with a red heart at the start and downward trend line, symbolizing breakup, relationship decline, and emotional loss over time. Trend decrease vectors Graph with a red heart at the start and downward trend line, symbolizing breakup, relationship decline, and emotional loss over
Free with trial Stock market display with a red line graph indicating a downward trend on a digital screen. The graph is composed of jagged peaks and troughs, suggesting instability. Surrounding the graph are numeric data and grid lines, highlighting market performance details. The screen is located in a financial setting with a blurred, busy background, possibly an office or trading floor, enhancing the context of economic activity. The color red typically signifies a decrease or negative trend in market terms. Trend decrease illustrations Red Stock Market Crash On Screen. Stock market display with a red line graph indicating a downward trend on a digital screen. The graph is composed of jagged peaks and troughs, suggesting instability. Surrounding the graph are numeric data and grid lines, highlighting market performance details. The screen is located in a financial setting with a blurred, busy background, possibly an office or trading floor, enhancing the context of economic activity. The color red typically signifies a decrease or negative trend in market terms.
Free with trial Price increase. Inflation icon group. Purchasing power decrease and savings. Services and goods cost rise. Vector illustration. Trend decrease vectors Price increase. Inflation icon group. Purchasing power decrease and savings. Services and goods cost rise. Vector illustration.
Free with trial A silver laptop sits on a light brown wooden surface. Its screen displays a dark background with a grid pattern and a prominent red line graph sharply declining from left to right. The red line is brightly lit, creating a strong visual contrast against the dark background. The overall mood is one of concern or warning, suggesting a negative trend or decline. The image is clean and simple, focusing, generated by AI. Trend decrease illustrations Laptop Screen Showing Red Downward Trend Graph computer. A silver laptop sits on a light brown wooden surface. Its screen displays a dark background with a grid pattern and a prominent red line graph sharply declining from left to right. The red line is brightly lit, creating a strong visual contrast against the dark background. The overall mood is one of concern or warning, suggesting a negative trend or decline. The image is clean and simple, focusing, generated by AI.
Free with trial A bright blue easel holds a whiteboard displaying a bar chart with a clear downward trend. The bars transition in color from green to red, and a prominent red arrow points downwards, emphasizing the decline. The illustration is set against a clean white background. Trend decrease illustrations Blue Easel Displaying a Downward Trend Bar Chart with Red Arrow graph decline. A bright blue easel holds a whiteboard displaying a bar chart with a clear downward trend. The bars transition in color from green to red, and a prominent red arrow points downwards, emphasizing the decline. The illustration is set against a clean white background
Free with trial A simple yet effective downward sloping arrow indicating a declining trend or negative progress. This infographic element is ideal for business reports, financial charts, educational materials, or presentations needing to visualize a decrease in value or performance over time. vector design Generative AI. Trend decrease vectors Downward Sloping Graph Arrow for Declining Trends, vector design Generative AI. A simple yet effective downward sloping arrow indicating a declining trend or negative progress. This infographic element is ideal for business reports, financial charts, educational materials, or presentations needing to visualize a decrease in value or performance over time. vector design Generative AI
Free with trial Hand Drawn Downward Trend Arrow On white Background. Trend decrease illustrations Hand-drawn black zigzag line ending with a downward arrow On white Background, symbolizing decline or negative trend. Hand Drawn Downward Trend Arrow On white. Hand Drawn Downward Trend Arrow On white Background
Free with trial A black curved line graph showing a downward trend on a white background. Clear details and vibrant colors enh. Trend decrease illustrations Black curved line graph showing decrease on white background chart decreasing. A black curved line graph showing a downward trend on a white background. Clear details and vibrant colors enh
Free with trial The image depicts a series of stacks of gold coins diminishing in size, positioned on a rustic dark wooden surface. Above and overlapping the coins is a prominent, downward-sloping red arrow, visually representing a decline or negative trend. The contrast between the gleaming gold coins and the stark red arrow emphasizes the concept of financial downturn or economic recession. The wooden background adds a sense of aged stability juxtaposed with the sharp decline visualized. The overall image is a powerful metaphor for economic hardship and loss. Trend decrease illustrations Decreasing Financial Trend Indicated by Gold Coins and Red Arrow. The image depicts a series of stacks of gold coins diminishing in size, positioned on a rustic dark wooden surface. Above and overlapping the coins is a prominent, downward-sloping red arrow, visually representing a decline or negative trend. The contrast between the gleaming gold coins and the stark red arrow emphasizes the concept of financial downturn or economic recession. The wooden background adds a sense of aged stability juxtaposed with the sharp decline visualized. The overall image is a powerful metaphor for economic hardship and loss.
Free with trial A dynamic red jagged arrow plunges downward, visually representing a sharp decline, economic downturn, or negative trend in business and finance. Ideal for charting losses or market drops. Trend decrease illustrations Red jagged arrow pointing down symbolizing financial decline or negative trend. A dynamic red jagged arrow plunges downward, visually representing a sharp decline, economic downturn, or negative trend in business and finance. Ideal for charting losses or market drops
Free with trial A black icon of a graph with a downward sloping curve and an arrow indicating decrease. Trend decrease illustrations Black graph showing a downward trend with an arrow and Y axis label chart data. A black icon of a graph with a downward sloping curve and an arrow indicating decrease
Free with trial Black and white graph showing a fluctuating trend line with an upward and a downward arrow. Trend decrease illustrations Black and white graph showing fluctuating trend with up and down arrows chart data. Black and white graph showing a fluctuating trend line with an upward and a downward arrow
Free with trial Bar chart with six vertical blue bars of descending height, indicating a negative trend. A jagged red arrow slants downward from left to right across the bars, emphasizing the decrease. No specific location is provided. Trend decrease vectors Financial bar chart showing downward trend with red arrow. Bar chart with six vertical blue bars of descending height, indicating a negative trend. A jagged red arrow slants downward from left to right across the bars, emphasizing the decrease. No specific location is provided.
Free with trial Data Stats Board Display Line Icon Downward Down Trend Statistic Performance Market Decline Economy Downturn Bar Graph Progress Outline Presentation. Trend decrease vectors Data Stats Board Display Line Icon Downward Down Trend Statistic Performance Market Decline Economy Downturn Bar Graph
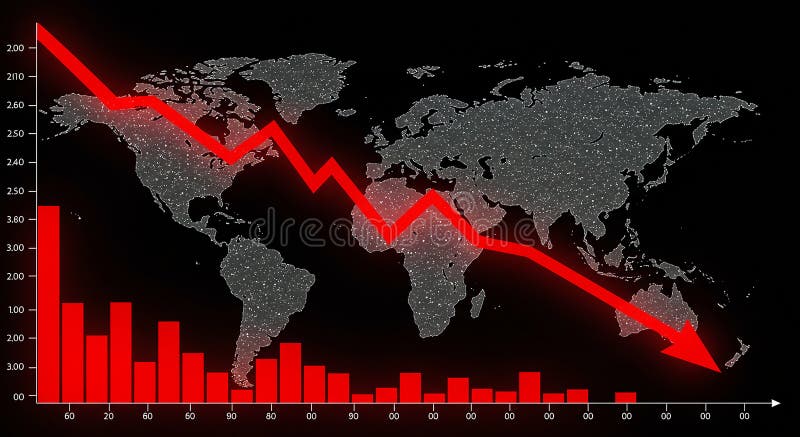
Free with trial World map backdrop with a downward-trending red line graph and red bar graph, set against a black background. The bar graph features various heights, indicating statistical data points, while the line graph suggests a decrease. The map includes continents like Africa, Europe, Asia, and the Americas, with numerous small white dots representing data or illumination. The dramatic red color emphasizes the negative trend, possibly symbolizing economic or market decline on a global scale. Trend decrease illustrations World map backdrop with a downward-trending red line graph and red bar graph
Free with trial Decrease red arrow curved illustration downturn warning, urgency curve, sharp intense decrease red arrow curved. Trend decrease illustrations Decrease red arrow curved
Free with trial A black bar graph icon with a downward arrow and trend line indicates a decline. Clear details and vibrant col. Trend decrease illustrations Black Bar Graph Icon with Downward Arrow and Trend Line on White Background data. A black bar graph icon with a downward arrow and trend line indicates a decline. Clear details and vibrant col
Free with trial Descending Bar Chart Illustration Depicting Decrease, Recession, Downturn with Arrow. Trend decrease vectors Descending Bar Chart Illustration Depicting Decrease, Recession, Downturn with Arrow
Free with trial A black line graph with a zigzagging downward trend and an arrow pointing down. Clear details and vibrant colo. Trend decrease illustrations Black line graph showing a sharp downward trend on white background chart decline. A black line graph with a zigzagging downward trend and an arrow pointing down. Clear details and vibrant colo
Free with trial A simple graphic showing a percent sign with two down arrows. This icon represents a decrease in percentage, decline, or reduction. Perfect for financial or business concepts. Trend decrease vectors Percent sign with down arrows icon for decrease and decline. A simple graphic showing a percent sign with two down arrows. This icon represents a decrease in percentage, decline, or reduction. Perfect for financial or business concepts.
Free with trial A downward pointing V shape arrow icon, perfect for indicating decline, decrease, or a bottoming out. This scalable vector graphic is ideal for financial charts, trend analysis, or negative indicators. Its simple design ensures clarity, making it effective for conveying downward movement or completion, vector design Generative AI. Trend decrease vectors Downward Pointing V Shape Arrow Icon, vector design Generative AI. A downward pointing V shape arrow icon, perfect for indicating decline, decrease, or a bottoming out. This scalable vector graphic is ideal for financial charts, trend analysis, or negative indicators. Its simple design ensures clarity, making it effective for conveying downward movement or completion, vector design Generative AI
Free with trial A red line graph showing a downward trend. Generative AI. Trend decrease illustrations A red line graph showing a downward trend
Free with trial A black line graph depicting a downward trend with an arrow on a white background Clear details and vibrant co. Trend decrease illustrations Black line graph showing a downward trend with an arrow chart decline. A black line graph depicting a downward trend with an arrow on a white background Clear details and vibrant co
Free with trial A black line graph with two curves showing a downward trend on a white background. Trend decrease illustrations Black line graph showing a downward trend with two lines on white background chart. A black line graph with two curves showing a downward trend on a white background
Free with trial Green up and red down 3d arrow graph showing rising, descending trend, business result, profit or loss symbol symbol. Business arrow, goals concept. 3d world money symbols. Financial growth. Trend decrease illustrations Green up and red down 3d arrow graph showing rising, descending trend, business result, 3d world money symbols. Financial growth. Green up and red down 3d arrow graph showing rising, descending trend, business result, profit or loss symbol symbol. Business arrow, goals concept. 3d world money symbols. Financial growth
Free with trial Green up and red down 3d arrow graph showing rising, descending trend, business result, profit or loss symbol symbol. Business arrow, goals concept. 3d world money symbols. Financial growth. Trend decrease illustrations Green up and red down 3d arrow graph showing rising, descending trend, business result, 3d world money symbols. Financial growth. Green up and red down 3d arrow graph showing rising, descending trend, business result, profit or loss symbol symbol. Business arrow, goals concept. 3d world money symbols. Financial growth
Free with trial Green up and red down 3d arrow graph showing rising, descending trend, business result, profit or loss symbol symbol. Business arrow, goals concept. 3d world money symbols. Financial growth. Trend decrease illustrations Green up and red down 3d arrow graph showing rising, descending trend, business result, 3d world money symbols. Financial growth. Green up and red down 3d arrow graph showing rising, descending trend, business result, profit or loss symbol symbol. Business arrow, goals concept. 3d world money symbols. Financial growth
Free with trial Green up and red down 3d arrow graph showing rising, descending trend, business result, profit or loss symbol symbol. Business arrow, goals concept. 3d world money symbols. Financial growth. Trend decrease illustrations Green up and red down 3d arrow graph showing rising, descending trend, business result, 3d world money symbols. Financial growth. Green up and red down 3d arrow graph showing rising, descending trend, business result, profit or loss symbol symbol. Business arrow, goals concept. 3d world money symbols. Financial growth
Free with trial Green up and red down 3d arrow graph showing rising, descending trend, business result, profit or loss symbol symbol. Business arrow, goals concept. 3d world money symbols. Financial growth. Trend decrease illustrations Green up and red down 3d arrow graph showing rising, descending trend, business result, 3d world money symbols. Financial growth. Green up and red down 3d arrow graph showing rising, descending trend, business result, profit or loss symbol symbol. Business arrow, goals concept. 3d world money symbols. Financial growth
Free with trial Data Stats Board Display Icon Downward Down Trend Statistic Performance Market Decline Economy Downturn Bar Graph Progress Sign Symbol Presentation. Trend decrease vectors Data Stats Board Display Icon Downward Down Trend Statistic Performance Market Decline Economy Downturn Bar Graph Progress
Free with trial A businessman presents a paper with PROFIT TREND, indicating a general direction or pattern in the profitability of a business, industry, or market over time. Concept of profit trend. Trend decrease illustrations Market Analyst Holding a Sign About a New Profit Trend. A businessman presents a paper with PROFIT TREND, indicating a general direction or pattern in the profitability of a business, industry, or market over time. Concept of profit trend
Free with trial Businessman lifting up percentage sign. concept of Inflation or interest rate falling down, decrease, profit fall in economic recession. Trend decrease vectors Businessman lifting up percentage sign. concept of Inflation or interest rate falling down, decrease, profit fall in economic
Free with trial Black line graph showing a downward trend on a white background with grid lines chart. Trend decrease illustrations Black line graph showing a downward trend on a white background with grid lines chart
Free with trial A black graph shows a market normalization flat trend with a downward arrow on a white background. Trend decrease illustrations Market normalization flat trend graph with downward arrow on white background image. A black graph shows a market normalization flat trend with a downward arrow on a white background
Free with trial Green arrow pointing downward on financial graph. Business chart with falling trend line. Digital stock market data visualization for investment analysis. Trend decrease illustrations Green arrow pointing downward on financial graph. Business chart with falling trend line
Free with trial A stylized text icon with DOWNWARD TWNND and a down arrow with a heart. Represents downward trends, decline, or negative statistics. Ideal for financial reports, market analysis, or abstract concepts. Visually impactful for data representation, vector design Generative AI. Trend decrease vectors Downward Trend Decrease Arrow Icon Vector Design Generative AI. A stylized text icon with DOWNWARD TWNND and a down arrow with a heart. Represents downward trends, decline, or negative statistics. Ideal for financial reports, market analysis, or abstract concepts. Visually impactful for data representation, vector design Generative AI
Free with trial A flat design illustration of two bar charts, one green and one red, both showing a downward trend with arrows, representing financial or business decline. Trend decrease illustrations Bar chart showing declining trend isolated on white background. A flat design illustration of two bar charts, one green and one red, both showing a downward trend with arrows, representing financial or business decline
Free with trial CPI consumer price index going down decrease number consumption confidence in economy crisis purchasing power vector. Trend decrease vectors CPI consumer price index going down decrease number consumption confidence in economy crisis purchasing power
Free with trial Red 3D bar graph against a black background, featuring an upward-sloping horizontal line that sharply declines, ending in a downward-pointing arrow. The bars decrease in height from left to right, visually representing a decline or loss. The red color contrasts with the dark background, emphasizing the downward trend. The composition suggests financial or business decline, often used in economic or market analysis. Trend decrease illustrations Red 3D bar graph against a black background, featuring an upward-sloping
Free with trial A 3D rendered bar chart illustrates a decreasing trend. The bars, colored in a gradient from yellow to purple, represent data points that are diminishing in value. Placed on a simple gray base, the chart is isolated against a white background. This image is suitable for illustrating concepts related to business, finance, statistics, and economic downturns. Trend decrease illustrations 3D Bar Chart Decreasing Trend. A 3D rendered bar chart illustrates a decreasing trend. The bars, colored in a gradient from yellow to purple, represent data points that are diminishing in value. Placed on a simple gray base, the chart is isolated against a white background. This image is suitable for illustrating concepts related to business, finance, statistics, and economic downturns.
Free with trial A visual representation of negative financial performance, illustrating a significant downward trend with a red arrow pointing downwards, indicating a loss or decline in value. Trend decrease illustrations Red graph showing a downward trend isolated on white background. A visual representation of negative financial performance, illustrating a significant downward trend with a red arrow pointing downwards, indicating a loss or decline in value
Free with trial Black and white clipboard icon featuring a checklist. The design includes an "X" and three dots in a vertical line, symbolizing tasks or points, followed by a downward-curving arrow. The arrow suggests a downward trend or progression. The icon is simple, with thick lines, and is typically used to represent concepts in planning, business analysis, or project management. The background is plain, emphasizing the clipboard graphic. Trend decrease vectors Clipboard checklist with downward trend. Black and white clipboard icon featuring a checklist. The design includes an "X" and three dots in a vertical line, symbolizing tasks or points, followed by a downward-curving arrow. The arrow suggests a downward trend or progression. The icon is simple, with thick lines, and is typically used to represent concepts in planning, business analysis, or project management. The background is plain, emphasizing the clipboard graphic.
Free with trial Methanol fuel commodity price in global market going down decrease low cheap international transaction trading market vector. Trend decrease vectors Methanol fuel commodity price in global market going down decrease low cheap international transaction trading market
Free with trial Declining business graph chart showing downward trend in finances. Trend decrease vectors Declining business graph chart showing downward trend in finances
Free with trial A chart with a brown frame displays a downward trend. Six blue vertical bars decrease in height from left to right. A yellow line with red points intersects the tops of the bars, indicating the declining trend. Two colored bars, green and yellow, are positioned in the top right corner, possibly representing a legend or key. The pale blue background contrasts the elements, emphasizing the descending data visualization. Trend decrease vectors Isometric deflation Colorful Flat Illustration. A chart with a brown frame displays a downward trend. Six blue vertical bars decrease in height from left to right. A yellow line with red points intersects the tops of the bars, indicating the declining trend. Two colored bars, green and yellow, are positioned in the top right corner, possibly representing a legend or key. The pale blue background contrasts the elements, emphasizing the descending data visualization.
Free with trial A clean and modern digital illustration of a financial candlestick chart, displaying market trends and stock performance. The graph features blue candlesticks indicating price movements over time, accompanied by a solid blue line graph and subtle dashed trend lines. Set against a crisp white background with a clear grid, this visualization is ideal for illustrating concepts related to finance, investment, business analytics, economic forecasts, and data reporting. It conveys growth, volatility, and strategic decision-making in the stock market. Trend decrease illustrations Financial Candlestick Chart with Trend Line on White Background. A clean and modern digital illustration of a financial candlestick chart, displaying market trends and stock performance. The graph features blue candlesticks indicating price movements over time, accompanied by a solid blue line graph and subtle dashed trend lines. Set against a crisp white background with a clear grid, this visualization is ideal for illustrating concepts related to finance, investment, business analytics, economic forecasts, and data reporting. It conveys growth, volatility, and strategic decision-making in the stock market.
Free with trial Displaying chart showing downward trend on gray hexagon grid, with gradient bars and red arrow. Data analytics, infographics, minimalist, technology, finance, business intelligence, dashboard. Trend decrease illustrations Displaying chart showing downward trend on gray hexagon grid, with gradient bars and red arrow
Free with trial Business bar graph icon vector with upward and downward arrow. Trend analysis symbol with long shadow. Trend decrease vectors Business bar graph icon with upward and downward arrow. Trend analysis symbol with long shadow
Free with trial Transportation cargo truck price cost of delivery logistics drop going down decrease chart in crisis global map transaction vector. Trend decrease vectors Transportation cargo truck price cost of delivery logistics drop going down decrease chart in crisis global map
Free with trial A descending line graph illustrates a negative financial trend against a backdrop of a dimly lit room with a window, symbolizing economic downturns. Trend decrease illustrations Downward Financial Trend Graph in Dark Room. A descending line graph illustrates a negative financial trend against a backdrop of a dimly lit room with a window, symbolizing economic downturns
Free with trial The image shows a line graph illustrating the decline of carbon emissions. there are two lines on the graph, a green line and a grey line, both trending downwards. the green line, representing "carbon inteetiual emissions," shows a steeper decline compared to the grey line. the graph is set against a grid background, providing a visual reference for the rate of decrease in emissions over time. the downward trend suggests a positive change in reducing carbon output. Trend decrease illustrations Carbon emissions decline graph illustration. the image shows a line graph illustrating the decline of carbon emissions. there are two lines on the graph, a green line and a grey line, both trending downwards. the green line, representing "carbon inteetiual emissions," shows a steeper decline compared to the grey line. the graph is set against a grid background, providing a visual reference for the rate of decrease in emissions over time. the downward trend suggests a positive change in reducing carbon output.
Free with trial A compelling visual representation of declining retail sales or consumer spending, featuring a large green shopping bag alongside three progressively smaller white shopping bags. A prominent red arrow graphically illustrates a downward trend, symbolizing a decrease in market demand, economic downturn, or business loss. This 3D rendered image on a clean white background is ideal for financial reports, economic analysis, business presentations, or articles discussing retail challenges, recession, or reduced purchasing power. Trend decrease illustrations Retail Sales Decline Concept with Shopping Bags and Downward Arrow. A compelling visual representation of declining retail sales or consumer spending, featuring a large green shopping bag alongside three progressively smaller white shopping bags. A prominent red arrow graphically illustrates a downward trend, symbolizing a decrease in market demand, economic downturn, or business loss. This 3D rendered image on a clean white background is ideal for financial reports, economic analysis, business presentations, or articles discussing retail challenges, recession, or reduced purchasing power.
Free with trial LPG Liquified Petroleum Gas liquid commodity price in global market going down decrease low crisis in international transaction trading market vector. Trend decrease vectors LPG Liquified Petroleum Gas liquid commodity price in global market going down decrease low crisis in international
Free with trial The image features two distinct arrows, one red pointing downward and one green pointing upward. The arrows are placed side by side, symbolizing contrasting directions or outcomes. The red arrow signifies a downward trend or decrease, while the green arrow represents an upward trend or increase. The arrows are set against a neutral grey background, emphasizing their colors and directions. Trend decrease illustrations Arrows indicating opposite directions. The image features two distinct arrows, one red pointing downward and one green pointing upward. The arrows are placed side by side, symbolizing contrasting directions or outcomes. The red arrow signifies a downward trend or decrease, while the green arrow represents an upward trend or increase. The arrows are set against a neutral grey background, emphasizing their colors and directions
Free with trial A vibrant red 3D arrow pointing downwards, with a percentage symbol integrated into its design. This graphic visually represents a decrease, reduction, or sale. The object is rendered with a glossy finish and is isolated on a clean white background, casting a subtle shadow. Trend decrease illustrations Red Downward Arrow with Percentage Symbol Indicating Decrease or Sale on White Background. A vibrant red 3D arrow pointing downwards, with a percentage symbol integrated into its design. This graphic visually represents a decrease, reduction, or sale. The object is rendered with a glossy finish and is isolated on a clean white background, casting a subtle shadow
Free with trial Colorful bar graph with downward trend, business concept illustration. Trend decrease vectors Colorful bar graph with downward trend, business concept illustration