Free with trial Graphical depiction of declining gold prices Three labeled gold bars on line graph showing downturn trend Red arrow indicates decrease against grid patterned background, suggesting financial or economic analysis related to gold markets For Social Media Post Size. Trend decrease illustrations Declining gold prices depicted with red arrow, gold bars, downturn trend. Graphical depiction of declining gold prices Three labeled gold bars on line graph showing downturn trend Red arrow indicates decrease against grid patterned background, suggesting financial or economic analysis related to gold markets For Social Media Post Size
Free with trial Declining graph icon in line design. decline, graph, chart, analytics, business, decrease, statistics on white background vector. Declining graph editable stroke icon. Trend decrease vectors Declining graph icon in line design. decline, graph, chart, analytics, business, decrease, statistics on white background vector. Declining graph editable
Free with trial Conceptual graph with decrease report. Dark diagram with recession and bankruptcy progress. Business and finance vector illustration. Trend decrease vectors Conceptual graph with decrease report. Dark diagram with recession and bankruptcy progress. Business and finance vector
Free with trial Graphical depiction of declining gold prices Three labeled gold bars on line graph showing downturn trend Red arrow indicates decrease against grid patterned background, suggesting financial or economic analysis related to gold markets. Trend decrease illustrations Declining gold prices depicted with red arrow, gold bars, downturn trend. Graphical depiction of declining gold prices Three labeled gold bars on line graph showing downturn trend Red arrow indicates decrease against grid patterned background, suggesting financial or economic analysis related to gold markets
Free with trial This graphic illustrates stable bank withdrawals alongside a rising financial trend with coins and bars, Bank withdrawals are currently stable and not showing any significant increase or decrease. Trend decrease vectors This graphic illustrates stable bank withdrawals alongside a rising financial trend with coins and bars, Bank withdrawals are
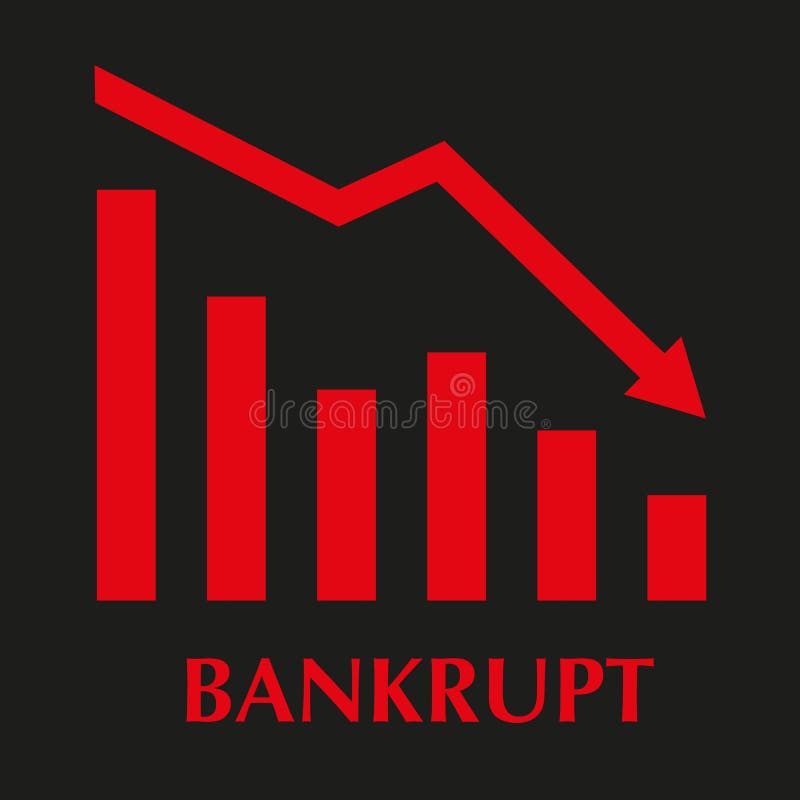
Free with trial Declining bar graph with trend line symbolizing financial loss or business decrease. Trend decrease illustrations Declining Bar Chart with Downward Trend Line Illustration. Declining bar graph with trend line symbolizing financial loss or business decrease.
Free with trial Decrease oil prices drop illustration global market, economy trend, plummet crude decrease oil prices drop. Trend decrease illustrations Decrease oil prices drop
Free with trial Downward trend line color icon. Statistical chart, metric analysis. Performance decrease, data visualization. Isolated vector illustration. Flat colorful symbol design. Editable stroke. Trend decrease vectors Downward trend line color icon
Free with trial 3D illustration of a bar graph showing a declining trend. Red bars of decreasing height are set against a backdrop of a light gray frame. The image is perfect for presentations, reports, or any visual representation of negative growth, decline, or decrease in data. Suitable for use in business, finance, and educational contexts. Trend decrease vectors Declining Trend Bar Graph. 3D illustration of a bar graph showing a declining trend. Red bars of decreasing height are set against a backdrop of a light gray frame. The image is perfect for presentations, reports, or any visual representation of negative growth, decline, or decrease in data. Suitable for use in business, finance, and educational contexts.
Free with trial A 3D icon featuring a red downward arrow, commonly representing a decline, decrease, or negative trend in financial and business metrics. Trend decrease vectors 3D Red Downward Trend Arrow Icon. A 3D icon featuring a red downward arrow, commonly representing a decline, decrease, or negative trend in financial and business metrics
Free with trial Red 3D bar chart with descending trend line and arrow, set against a dark gradient background. The tallest bar on the left progressively declines toward the right, illustrating a decrease. The entire structure has a glossy finish, emphasizing the downward movement indicated by the arrowhead at the end of the line. The chart appears suspended centrally, providing a clear visual representation of a downward trend, often used in financial or analytical contexts to denote loss or decline. Trend decrease illustrations Red 3D bar chart with descending trend line and arrow, set against a dark gradient
Free with trial Graph with a downward trend shows a decrease in profits. Trend decrease vectors Money downward trend graph showing economic crisis. Graph with a downward trend shows a decrease in profits
Free with trial A minimalist white 3D bar graph illustrates a significant downward trend. The bars decrease in height from left to right, connected by a dashed line that forms a descending path, culminating in an arrow pointing downwards. The graphic is rendered in an isometric perspective on a white background, representing decline, loss, or negative performance. Trend decrease illustrations White 3D Bar Graph Showing a Downward Trend chart decline. A minimalist white 3D bar graph illustrates a significant downward trend. The bars decrease in height from left to right, connected by a dashed line that forms a descending path, culminating in an arrow pointing downwards. The graphic is rendered in an isometric perspective on a white background, representing decline, loss, or negative performance
Free with trial A colored outline vector icon of a line graph showing a downward trend, indicating a decrease or decline. Represents financial trends, statistics, losses, or negative performance. Useful for finance, business reports, or data visualization showing reduction. Illustrates a declining value over time, vector design Generative AI. Trend decrease vectors Decreasing Trend Stock Market Graph Vector, vector design Generative AI. A colored outline vector icon of a line graph showing a downward trend, indicating a decrease or decline. Represents financial trends, statistics, losses, or negative performance. Useful for finance, business reports, or data visualization showing reduction. Illustrates a declining value over time, vector design Generative AI
Free with trial A sharp downward-pointing arrow, symbolizing decline, decrease, or negative trend. Ideal for financial charts, market downturns, and challenging situations. Represents reduction and negative performance, perfect for business analytics or economic reports, vector design Generative AI. Trend decrease vectors Downward Trend Arrow Financial Decline, vector design Generative AI. A sharp downward-pointing arrow, symbolizing decline, decrease, or negative trend. Ideal for financial charts, market downturns, and challenging situations. Represents reduction and negative performance, perfect for business analytics or economic reports, vector design Generative AI
Free with trial Trend hand drawn style declining sales graph illustration decrease arrow, data analytics, visual report trend hand drawn style declining sales graph. Trend decrease illustrations Trend hand drawn style declining sales graph
Free with trial An outline vector icon of a bar graph showing a downward progression, indicating a decrease or negative trend. Represents statistics, data decline, losses, or reduction over categories or time. Useful for financial reporting and business analysis showing reduction, vector design Generative AI. Trend decrease vectors Decreasing Trend Bar Graph Statistics Vector Outline, vector design Generative AI. An outline vector icon of a bar graph showing a downward progression, indicating a decrease or negative trend. Represents statistics, data decline, losses, or reduction over categories or time. Useful for financial reporting and business analysis showing reduction, vector design Generative AI
Free with trial An icon of a line graph showing a downward trend, symbolizing decline, decrease, or negative performance. Ideal for financial reports, market analysis, and economic downturns. Represents challenges and reduction, perfect for business analytics and reports, vector design Generative AI. Trend decrease vectors Downward Trend Graph Icon for Business Decline, vector design Generative AI. An icon of a line graph showing a downward trend, symbolizing decline, decrease, or negative performance. Ideal for financial reports, market analysis, and economic downturns. Represents challenges and reduction, perfect for business analytics and reports, vector design Generative AI
Free with trial A 3D rendered icon featuring a golden bar graph with a downward trend line and a red arrow indicating a decrease. The graph is set on a black circular background with a prominent gold rim. This symbol represents financial decline, loss, or negative performance. Trend decrease illustrations Golden Graph with Downward Trend Arrow on Black Circle with Gold Rim chart falling. A 3D rendered icon featuring a golden bar graph with a downward trend line and a red arrow indicating a decrease. The graph is set on a black circular background with a prominent gold rim. This symbol represents financial decline, loss, or negative performance
Free with trial Angled downward arrow with jagged design suggests a declining trend in metallic tones against a clean background Great for illustrating concepts of decrease and downturn. Trend decrease illustrations Downward Arrow Graphic Showing Zigzag Trend on White. Angled downward arrow with jagged design suggests a declining trend in metallic tones against a clean background Great for illustrating concepts of decrease and downturn
Free with trial A hand draws a downward-trending line graph on a chalkboard using chalk, illustrating a negative market trend or decline. This visual representation, generated by AI, is often used to symbolize economic recession, stock market crashes, or other forms of decrease. Trend decrease illustrations Downward Trend. A hand draws a downward-trending line graph on a chalkboard using chalk, illustrating a negative market trend or decline. This visual representation, generated by AI, is often used to symbolize economic recession, stock market crashes, or other forms of decrease.
Free with trial A simple icon of a downward arrow line, symbolizing decline, decrease, negative trends, and falling metrics. Ideal for business, finance, performance analytics, or warning indicators. This clear vector illustration is perfect for websites, apps, and presentations, conveying negative progress or caution, vector design Generative AI. Trend decrease vectors Downward Trend Arrow Icon: Decline, Decrease Negative Trend, vector design Generative AI. A simple icon of a downward arrow line, symbolizing decline, decrease, negative trends, and falling metrics. Ideal for business, finance, performance analytics, or warning indicators. This clear vector illustration is perfect for websites, apps, and presentations, conveying negative progress or caution, vector design Generative AI
Free with trial A bold, jagged red arrow points downwards, symbolizing a significant decrease or negative trend in a graph or chart. Trend decrease illustrations Sharp red arrow indicating downward trend and decline. A bold, jagged red arrow points downwards, symbolizing a significant decrease or negative trend in a graph or chart
Free with trial Several blue arrows are pointing down, representing a decrease or negative trend. Trend decrease vectors Blue arrows pointing down representing negative trend. Several blue arrows are pointing down, representing a decrease or negative trend
Free with trial This dynamic graphic depicts a sharp downward trend, visualized by a bold red arrow dramatically descending across a grey, jagged line graph. The graph itself shows significant fluctuations, but the overarching movement is a steep decline, symbolizing losses, negative growth, or a crisis. The clean white background isolates the data representation, making it ideal for conveying financial downturns, market crashes, or any situation involving a significant decrease. Trend decrease illustrations Sharp Decline: Red Arrow Graph Illustrating Downward Trend. This dynamic graphic depicts a sharp downward trend, visualized by a bold red arrow dramatically descending across a grey, jagged line graph. The graph itself shows significant fluctuations, but the overarching movement is a steep decline, symbolizing losses, negative growth, or a crisis. The clean white background isolates the data representation, making it ideal for conveying financial downturns, market crashes, or any situation involving a significant decrease.
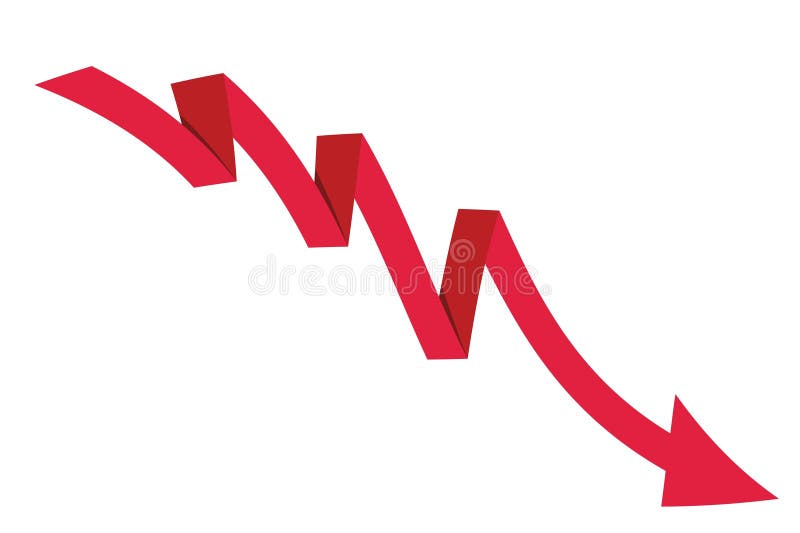
Free with trial A bold red arrow zigzags downwards, symbolizing a significant decrease, loss, or negative trend. Trend decrease vectors Red arrow indicating downward trend and decline. A bold red arrow zigzags downwards, symbolizing a significant decrease, loss, or negative trend
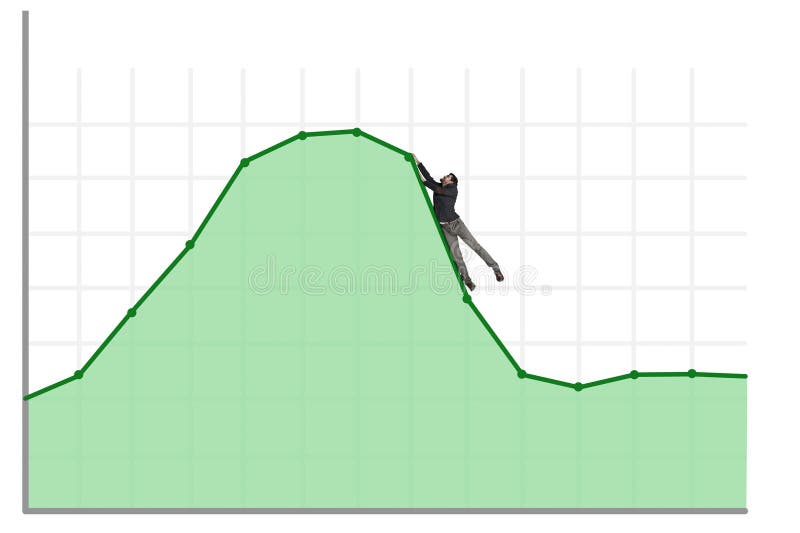
Free with trial A person holds a graph showing a sharp market downturn, illustrating a significant decrease in value. The red line highlights the negative trend, generated by AI for illustrative purposes. This image is perfect for representing financial losses or economic instability. Trend decrease illustrations Declining Market Trend. A person holds a graph showing a sharp market downturn, illustrating a significant decrease in value. The red line highlights the negative trend, generated by AI for illustrative purposes. This image is perfect for representing financial losses or economic instability.
Free with trial A vibrant glossy red arrow curves downwards, symbolizing a negative trend, decline, or reduction. This eye-catching graphic is perfect for presentations and reports illustrating falling data or negative performance. Trend decrease illustrations Glossy red downward arrow graphic sign indicating trend decline or decrease white background. A vibrant glossy red arrow curves downwards, symbolizing a negative trend, decline, or reduction. This eye-catching graphic is perfect for presentations and reports illustrating falling data or negative performance
Free with trial A minimalist graphic depicting a bar chart with falling bars and a downward-pointing arrow, symbolizing a negative trend, economic downturn, or performance decline. Clean and clear representation of loss. Trend decrease illustrations Simple downward trend bar chart icon indicating decline or decrease. A minimalist graphic depicting a bar chart with falling bars and a downward-pointing arrow, symbolizing a negative trend, economic downturn, or performance decline. Clean and clear representation of loss
Free with trial A vibrant red arrow gracefully curves downwards, clearly indicating a directional change or a downward trend. Its glossy finish suggests movement and highlights its prominent form. Trend decrease illustrations Bright red arrow curving downward indicating direction or trend decrease. A vibrant red arrow gracefully curves downwards, clearly indicating a directional change or a downward trend. Its glossy finish suggests movement and highlights its prominent form
Free with trial A vibrant red arrow curves downward, signifying a decrease, negative trend, or direction towards lower values. Ideal for financial reports, data visualization, or indicating a downward path. Trend decrease illustrations Bright red downward curved arrow symbol indicating decline or trend vector. A vibrant red arrow curves downward, signifying a decrease, negative trend, or direction towards lower values. Ideal for financial reports, data visualization, or indicating a downward path
Free with trial Modern rendered line graph with yellow marker points rising and falling vertically, forming a white trend line that fluctuates across the screen. The graph represents business data such as growth, decrease, profit, and market performance. Set against a blurred office background, the image has a clean, digital aesthetic ideal for financial presentations, company reports, startup pitches, and data analysis. This visual is suitable for showcasing trading performance, corporate strategy, and economic trends. Trend decrease illustrations Business Trend Line Graph Showing Growth and Market Fluctuations. Modern rendered line graph with yellow marker points rising and falling vertically, forming a white trend line that fluctuates across the screen. The graph represents business data such as growth, decrease, profit, and market performance. Set against a blurred office background, the image has a clean, digital aesthetic ideal for financial presentations, company reports, startup pitches, and data analysis. This visual is suitable for showcasing trading performance, corporate strategy, and economic trends.
Free with trial A vector icon of a line graph showing a downward trend with a red arrow. Represents decline, loss, negative performance, or decreasing statistics. Useful for financial reports, business analytics, or illustrating unfavorable trends. Clear visual for decrease, vector design Generative AI. Trend decrease vectors Downward Trend Line Graph Vector Icon for Decline Loss, vector design Generative AI. A vector icon of a line graph showing a downward trend with a red arrow. Represents decline, loss, negative performance, or decreasing statistics. Useful for financial reports, business analytics, or illustrating unfavorable trends. Clear visual for decrease, vector design Generative AI
Free with trial A vector icon illustrating a downward trending line graph, symbolizing a decline, decrease, or negative performance. Ideal for financial reports, data analysis dashboards, or warning indicators. This clear and concise graphic is scalable, perfect for conveying trend information in various digital interfaces, vector design Generative AI. Trend decrease vectors Declining Trend Graph Icon - Downturn Analysis Symbol, vector design Generative AI. A vector icon illustrating a downward trending line graph, symbolizing a decline, decrease, or negative performance. Ideal for financial reports, data analysis dashboards, or warning indicators. This clear and concise graphic is scalable, perfect for conveying trend information in various digital interfaces, vector design Generative AI
Free with trial A vibrant red arrow sharply points downwards, indicating a significant decrease or negative trend. This visual represents market downturns, business losses, or declining performance metrics. Trend decrease illustrations Sharp red downward trend arrow symbolizing financial decline or negative performance. A vibrant red arrow sharply points downwards, indicating a significant decrease or negative trend. This visual represents market downturns, business losses, or declining performance metrics
Free with trial A visual representation of declining data points connected by a red line. This graphic effectively illustrates a negative trend or decrease over time, suitable for financial or performance reports. Trend decrease illustrations Data trend analysis showing downward trajectory with red dots and connecting line vector. A visual representation of declining data points connected by a red line. This graphic effectively illustrates a negative trend or decrease over time, suitable for financial or performance reports
Free with trial Man, crypto price or line graph decrease in studio, stock market broker or financial loss on white background. Illustration, current economy trend or value drop of currency for interest rate risk. Trend decrease illustrations Man, crypto price or line graph decrease in studio, stock market broker or financial loss on white background
Free with trial The graphic illustrates stable bank withdrawals alongside a growing financial trend with upward movement, Bank withdrawals are currently stable and not showing any significant increase or decrease. Trend decrease vectors The graphic illustrates stable bank withdrawals alongside a growing financial trend with upward movement, Bank withdrawals are
Free with trial Crisis chart and graph. Economic downturn with Increase and decrease arrow on the top of wooden blocks steps on desk, eco style. The business volatility trend process, finance, and economic concept , Generative Ai. Trend decrease illustrations Crisis chart and graph. Economic downturn with Increase and decrease arrow on the top of wooden blocks steps on desk, eco style.
Free with trial Crisis chart and graph. Economic downturn with Increase and decrease arrow on the top of wooden blocks steps on desk, eco style. The business volatility trend process, finance, and economic concept , Generative Ai. Trend decrease illustrations Crisis chart and graph. Economic downturn with Increase and decrease arrow on the top of wooden blocks steps on desk, eco style.
Free with trial A laptop screen shows a graph with orange lines. The graph is showing a downward trend, which could indicate a decrease in stock prices or a decline in a particular market. Trend decrease illustrations A laptop screen shows a graph with orange lines. The graph is showing a downward trend, which could indicate a decrease in stock
Free with trial Red bar graph shows decline with downward arrow, representing financial loss. Business failure reduced performance or decrease of value. Negative trend report. Trend decrease illustrations Red bar graph shows decline with downward arrow, representing financial loss. Business failure, reduced performance or decrease. Red bar graph shows decline with downward arrow, representing financial loss. Business failure reduced performance or decrease of value. Negative trend report.
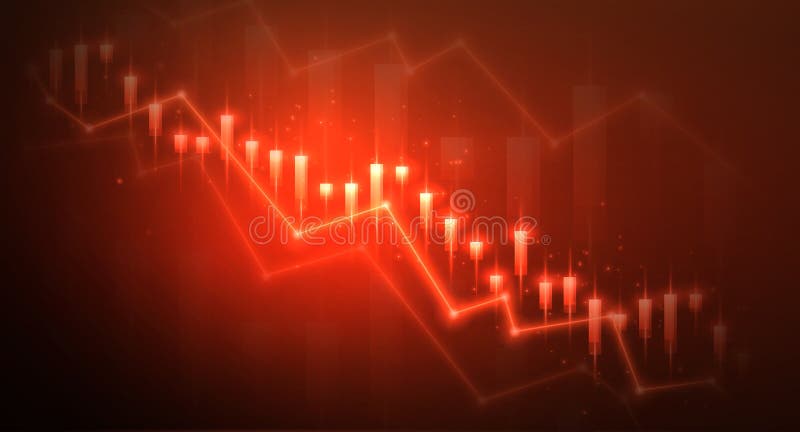
Free with trial Stock and economic crisis graph background. Trade exchange, financial decrease, bed business strategy, digital asset, loss investment fund, online broker, stock collapse and crisis concept. Trend decrease vectors Stock and economic crisis graph background. Trade exchange, financial decrease
Free with trial Stock and economic crisis graph background. Trade exchange, financial decrease, bed business strategy, digital asset, loss investment fund, online broker, stock collapse and crisis concept. Trend decrease illustrations Stock and economic crisis graph background. Trade exchange, financial decrease
Free with trial Red neon arrows moving down, financial loss abstract vector background. Modern downward graphic, negative market trend, stock recession metrics, and business decrease concept. Trend decrease vectors Red neon arrows moving down, financial loss
Free with trial Red neon arrows moving down, financial loss abstract vector background. Modern downward graphic, negative market trend, stock recession metrics, and business decrease concept. Trend decrease vectors Red neon arrows moving down, financial loss
Free with trial Analytics, rising and falling trend. Deposits and loans. Economy and business. Income and Loss. Stock exchange trading. Trend decrease illustrations Analytics, rising and falling trend. Deposits and loans.
Free with trial 3D Red down arrow showing declining trend. Business stock market decrease symbol. Economic crisis concept. Vector illustration. Trend decrease vectors 3D Red down arrow showing declining trend
Free with trial Stock and economic crisis graph background. Trade exchange, financial decrease, bed business strategy, digital asset, loss investment fund, online broker, stock collapse and crisis concept. Trend decrease illustrations Stock and economic crisis graph background. Trade exchange, financial decrease
Free with trial Graph and decrease report. Business and finance vector illustrations. Diagram with recession and bankruptcy progress. Trend decrease vectors Graph and decrease report. Business and finance vector illustrations. Diagram with recession and bankruptcy
Free with trial Broker trader analyzing economic crisis. Trade exchange, financial decrease, bed business strategy, digital asset, loss investment fund, online broker, stock collapse and crisis concept. Trend decrease vectors Broker trader analyzing economic crisis. Trade exchange, financial decrease
Free with trial Downward trend arrow on staircase graph icon. Trend decrease vectors Downward trend arrow on staircase graph icon
Free with trial A minimalist solid black icon of a bar chart with a downward arrow, representing financial loss, decline, decrease, or negative trend. Perfect for business, finance, analytics, and reporting projects. Clean and versatile for web, print, and digital use. Trend decrease vectors . A minimalist solid black icon of a bar chart with a downward arrow, representing financial loss, decline, decrease, or negative trend. Perfect for business, finance, analytics, and reporting projects. Clean and versatile for web, print, and digital use
Free with trial Downward line chart representing consistent decrease in financial metrics. Trend decrease vectors Downward chart line trend. Downward line chart representing consistent decrease in financial metrics.
Free with trial Red arrow pointing down on a piece of paper , downward trend graph on grid paper with arrow pointing down. Trend decrease illustrations Red arrow graph a downward trend on paper. Red arrow pointing down on a piece of paper , downward trend graph on grid paper with arrow pointing down
Free with trial Diagram with recession and bankruptcy progress. Business and finance vector illustration. Graph with decrease report. Trend decrease vectors Diagram with recession and bankruptcy progress. Business and finance vector illustration. Graph with decrease
Free with trial Oil price decrease pictogram icon silhouette vector illustration. Trend decrease vectors Oil price decrease pictogram icon silhouette vector illustration
Free with trial Oil price decrease pictogram icon silhouette vector illustration. Trend decrease vectors Oil price decrease pictogram icon silhouette vector illustration
Free with trial The image depicts a bar graph with a downward trend. The bars decrease in height from left to right, indicating a decline. A prominent red downward arrow further emphasizes the downward trend. Trend decrease vectors Decreasing bar graph with downward arrow. The image depicts a bar graph with a downward trend. The bars decrease in height from left to right, indicating a decline. A prominent red downward arrow further emphasizes the downward trend
Free with trial Decrease : Decrease represents a reduction in value, profit, or financial performance over a specific period. Trend decrease vectors Illustration of Decrease. Decrease : Decrease represents a reduction in value, profit, or financial performance over a specific period.
Free with trial This striking graphic illustrates a significant economic downturn or market crash with a bold red arrow plunging downwards. Rendered by Ai, the image uses simple colors to maximize impact setting the alarming decline against subtle background charts. It effectively communicates concepts of loss decrease and a strong negative trend in business metrics. Trend decrease illustrations Red arrow showing sharp financial market decline. This striking graphic illustrates a significant economic downturn or market crash with a bold red arrow plunging downwards. Rendered by Ai, the image uses simple colors to maximize impact setting the alarming decline against subtle background charts. It effectively communicates concepts of loss decrease and a strong negative trend in business metrics
Free with trial An adorable, plump orange tabby cat dressed in a blue collar and tie stands beside a presentation screen. The screen displays a bar graph and a line graph indicating a downward financial trend, with a prominent '-25%' marker. To the left, an office desk with a laptop and an ergonomic chair suggest a business or work environment. This whimsical illustration is perfect for conveying concepts related to financial performance, business analysis, or even humorous takes on economic downturns. Trend decrease illustrations Cartoon Cat Presenting Financial Report with Downward Trend. An adorable, plump orange tabby cat dressed in a blue collar and tie stands beside a presentation screen. The screen displays a bar graph and a line graph indicating a downward financial trend, with a prominent '-25%' marker. To the left, an office desk with a laptop and an ergonomic chair suggest a business or work environment. This whimsical illustration is perfect for conveying concepts related to financial performance, business analysis, or even humorous takes on economic downturns.
Free with trial A minimalist, black and white vector illustration depicting a financial graph with a clear downward trend. The graph features a jagged line representing fluctuating data, leading into a bold, thick arrow pointing downwards and to the right. This icon symbolizes decline, loss, recession, or negative performance in various contexts, such as business, economics, or stock markets. Its clean design makes it versatile for presentations, websites, and infographics. Trend decrease vectors Downward Trend Graph with Arrow Icon. A minimalist, black and white vector illustration depicting a financial graph with a clear downward trend. The graph features a jagged line representing fluctuating data, leading into a bold, thick arrow pointing downwards and to the right. This icon symbolizes decline, loss, recession, or negative performance in various contexts, such as business, economics, or stock markets. Its clean design makes it versatile for presentations, websites, and infographics.
Free with trial Decrease: Decrease represents a reduction in value, amount, or performance over time. Trend decrease illustrations Illustration of Decrease. Decrease: Decrease represents a reduction in value, amount, or performance over time.
Free with trial Recession down loss arrows icon simple graphic line stroke and solid bold vector set, decrease negative graph shape silhouette logo, statistics low performance element image clip art. Trend decrease vectors Recession down loss arrows icon simple graphic line stroke and solid bold vector set, decrease negative graph shape silhouette
Free with trial Blue downward arrow beside a user profile document with lines and icons. Ideal for analytics, report decline, performance review, career management, trend analysis, business analysis, simple flat. Trend decrease vectors Downward Trend Arrow and User Profile Document Representation. Blue downward arrow beside a user profile document with lines and icons. Ideal for analytics, report decline, performance review, career management, trend analysis, business analysis, simple flat
Free with trial Downward graph with trend points, sad face symbolizing poor performance, and a play button. Ideal for business, analytics, finance, marketing, strategy data loss media. Simple flat metaphor. Trend decrease vectors Declining Trend Chart with Sad Face and Play Button Concept. Downward graph with trend points, sad face symbolizing poor performance, and a play button. Ideal for business, analytics, finance, marketing, strategy data loss media. Simple flat metaphor
Free with trial Sad face beside sales trend line graph indicating decrease. Empty basket symbolizes low retail activity. Ideal for business decline, loss, market crisis, consumer struggle, analytics, recession. Trend decrease illustrations Declining Sales Chart with Sad Face and Empty Shopping Basket. Sad face beside sales trend line graph indicating decrease. Empty basket symbolizes low retail activity. Ideal for business decline, loss, market crisis, consumer struggle, analytics, recession
Free with trial Wavy green arrows visualizing market movement, trend fluctuation, and economic volatility, depicting both growth and decline, ideal for financial data and business analytics concepts. Trend decrease illustrations Wavy arrows showing up and down fluctuation trend. Wavy green arrows visualizing market movement, trend fluctuation, and economic volatility, depicting both growth and decline, ideal for financial data and business analytics concepts
Free with trial Red Downward Arrow Graph Trend on White Background, Decline Business Concept, Falling Market Indicator. Trend decrease vectors Red Downward Arrow Graph Trend on White Background
Free with trial Conceptual diagram depicting a decrease in gold production. Trend decrease illustrations Gold Production Decrease Gear, Bars, Arrow Concept. Conceptual diagram depicting a decrease in gold production.
Free with trial Trend Down : Trend down indicates a decrease in financial performance, market value, or economic indicators over time. Trend decrease vectors Trend Down
Free with trial A red bear standing near water with red candlestick stock graph background, symbolizing bearish market trend and financial downturn. Trend decrease illustrations Red bear standing near water with red candlestick stock graph background, symbolizing bearish market trend and financial downturn
Free with trial Downward Trend Line Graph Icons for Financial Data vol 34820. Trend decrease vectors Downward Trend Line Graph Icons for Financial Data
Free with trial A modern flat design graphic set featuring two icons: opposing arrows indicating increase decrease and a bar chart showing financial growth or decline, perfect for business concepts. Trend decrease vectors Increase and decrease arrows with bar chart icon. A modern flat design graphic set featuring two icons: opposing arrows indicating increase decrease and a bar chart showing financial growth or decline, perfect for business concepts
Free with trial A sad red bear sitting with arms crossed, stock market graph in background, symbolizing financial loss, bearish trend, and emotional impact. Trend decrease illustrations Sad red bear sitting with arms crossed, stock market graph in background, symbolizing financial loss, bearish trend, and emotional
Free with trial Simple black and white vector illustration showing bar charts indicating increase and decrease, perfect for financial or data concepts. Trend decrease vectors Bar chart icon showing increase and decrease data. Simple black and white vector illustration showing bar charts indicating increase and decrease, perfect for financial or data concepts
Free with trial Gear mechanism showing a large downward arrow surrounded by smaller blue figures, illustrating a concept of decline, decrease, or negative trend within a system or process. Trend decrease vectors Economic downfall concept with downward arrow in gear. Gear mechanism showing a large downward arrow surrounded by smaller blue figures, illustrating a concept of decline, decrease, or negative trend within a system or process
Free with trial A flat design bar chart displays a downward trend, highlighted by a red arrow. Minimalist graphic, illustrative style. Trend decrease vectors Flat bar chart showing downward trend with red arrow. A flat design bar chart displays a downward trend, highlighted by a red arrow. Minimalist graphic, illustrative style.