Free with trial Indicating negative trend red arrow slanting down on finance dashboard, with bars and data points. Financial, analytics, data visualization, technology, digital interface, dashboard, statistical. Trend decrease illustrations Indicating negative trend red arrow slanting down on finance dashboard, with bars and data points
Free with trial A visual depiction of decreasing financial returns with a pyramid of coins descending alongside a sloping graph illustrating a downward economic trend. Trend decrease illustrations Declining interest rates represented by stacked coins and downward trend graph. A visual depiction of decreasing financial returns with a pyramid of coins descending alongside a sloping graph illustrating a downward economic trend
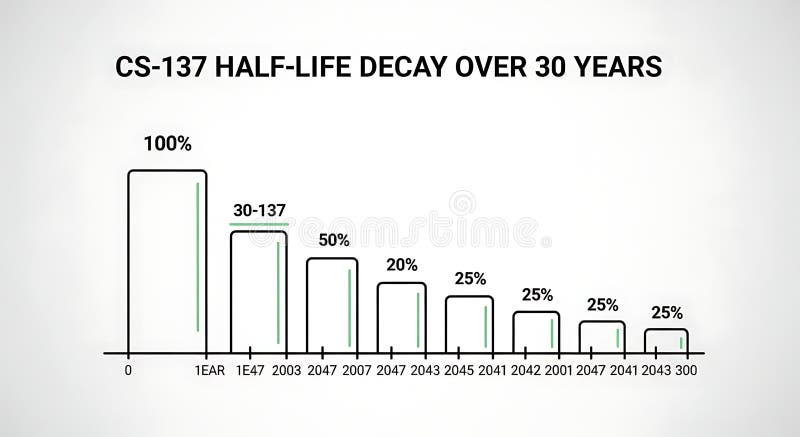
Free with trial A line graph illustrating the decrease in half-life over 30 years with bars representing percentage decay at different years, demonstrating long-term decline suitable for scientific, educational, or research presentations. Trend decrease illustrations Half-life Decay Over 30 Years Chart Showing Decrease in Value or Effectiveness. A line graph illustrating the decrease in half-life over 30 years with bars representing percentage decay at different years, demonstrating long-term decline suitable for scientific, educational, or research presentations
Free with trial Green arrow on financial graph with terrified cartoon face reacting to a sharp downward trend. Concept of market crash or business loss. Trend decrease illustrations Green arrow on financial graph with terrified cartoon face reacting to a sharp downward trend
Free with trial A human hand in a black suit sleeve points forward against a red background. A jagged red arrow, symbolizing a downward trend or decline, extends diagonally across the image. The image conveys a sense of financial loss or decrease. Trend decrease illustrations A human hand in a black suit sleeve points forward against a red background. A jagg
Free with trial A vibrant, flat-design illustration depicts a bar graph with a downward-trending arrow, suggesting a decline in data. The graph features bars in red, yellow, green, and blue, set against a clean white background. The composition is simple, yet conveys a clear message of financial or performance decrease. Trend decrease illustrations Colorful Bar Graph with Declining Trend and Arrows, Business Concept. A vibrant, flat-design illustration depicts a bar graph with a downward-trending arrow, suggesting a decline in data. The graph features bars in red, yellow, green, and blue, set against a clean white background. The composition is simple, yet conveys a clear message of financial or performance decrease
Free with trial The image shows a conference room with a long wooden table and black leather chairs. a silver line graph depicting a downward trend is placed on the table. the graph starts high on the left and gradually declines towards the right, indicating a loss or decrease. the room is well-lit with ceiling lights. the background is blurred, focusing attention on the graph and the table. a painting is visible on the wall. Trend decrease illustrations Decreasing graph on conference room table view. the image shows a conference room with a long wooden table and black leather chairs. a silver line graph depicting a downward trend is placed on the table. the graph starts high on the left and gradually declines towards the right, indicating a loss or decrease. the room is well-lit with ceiling lights. the background is blurred, focusing attention on the graph and the table. a painting is visible on the wall.
Free with trial An orange downward arrow illustrates a declining trend on a dark background, suitable for depicting economic downturn or negative progress. Trend decrease illustrations Downward Arrow Declining Trend Decline Graphic. An orange downward arrow illustrates a declining trend on a dark background, suitable for depicting economic downturn or negative progress
Free with trial Frozen graph showing a downward trend. Cold economy concept, financial crisis, declining business, and cold market conditions. Trend decrease illustrations Frozen graph showing a downward trend. Cold economy concept, financial crisis, declining business
Free with trial A visual representation of contrasting directions using prominent green and red arrows, symbolizing growth and decline, increase and decrease, essential for data and trend analysis. Trend decrease illustrations Green and red arrows facing each other on isolated on white background. A visual representation of contrasting directions using prominent green and red arrows, symbolizing growth and decline, increase and decrease, essential for data and trend analysis
Free with trial Hand Drawn Wavy Downward Arrow Symbol Indicating Decline or Decrease. Trend decrease vectors Hand Drawn Wavy Downward Arrow Symbol Indicating Decline or Decrease
Free with trial Shipping price fee cost of delivery logistics decrease going down in crisis export import transaction freight chart global map transaction vector. Trend decrease vectors Shipping price fee cost of delivery logistics decrease going down in crisis export import transaction freight chart
Free with trial Red sad face beside a line graph showing a downward trend and a bar graph. Ideal for business loss, economic decline, performance issues, challenges, setbacks, analytics, trends. Simple flat metaphor. Trend decrease vectors Declining Chart with Sad Face and Bar Graph Representing Negative Trend and Challenges. Red sad face beside a line graph showing a downward trend and a bar graph. Ideal for business loss, economic decline, performance issues, challenges, setbacks, analytics, trends. Simple flat metaphor
Free with trial A 3D rendered image of a red arrow pointing downwards, suggesting a negative trend or decline. The arrow has a feathered fletching and casts a shadow on a white background, emphasizing the downward direction. The image is clean and minimalist, perfect for illustrating concepts of loss, decline, or. Trend decrease illustrations Red Arrow Downward Trend. A 3D rendered image of a red arrow pointing downwards, suggesting a negative trend or decline. The arrow has a feathered fletching and casts a shadow on a white background, emphasizing the downward direction. The image is clean and minimalist, perfect for illustrating concepts of loss, decline, or
Free with trial The image features a neon white line graph depicting a downward trend, suggesting a decline in value or performance. the graph is set against a dark background, creating a stark contrast that emphasizes the neon light. the presence of shimmering particles around the line adds a sense of movement. a reflective surface below mirrors the graph, enhancing the visual impact and creating a sense of depth. Trend decrease illustrations Neon downward trend line with reflection effect. the image features a neon white line graph depicting a downward trend, suggesting a decline in value or performance. the graph is set against a dark background, creating a stark contrast that emphasizes the neon light. the presence of shimmering particles around the line adds a sense of movement. a reflective surface below mirrors the graph, enhancing the visual impact and creating a sense of depth.
Free with trial A neon red line graph displayed on a black board shows a downward trend, reflected on a glossy surface in a modern room, illustrating financial loss. Trend decrease illustrations Red Graph on Black Board Showing Downward Trend. A neon red line graph displayed on a black board shows a downward trend, reflected on a glossy surface in a modern room, illustrating financial loss
Free with trial Displaying financial chart on dark grid screen, with red trend line and multicolored waveform lines. Analytics, financial, investment, stockmarket, data visualization, digital, technology. Trend decrease illustrations Displaying financial chart on dark grid screen, with red trend line and multicolored waveform lines
Free with trial A simple red line graph showing a sharp downward trend with an arrow indicating a significant decrease, symbolizing loss or decline in performance. Trend decrease illustrations Red downward trending graph isolated on white background. A simple red line graph showing a sharp downward trend with an arrow indicating a significant decrease, symbolizing loss or decline in performance
Free with trial A simple red line graph showing a sharp downward trend, indicating a significant decrease or loss in value, isolated against a clean white background for clarity. Trend decrease illustrations Red downward trending graph isolated on white background. A simple red line graph showing a sharp downward trend, indicating a significant decrease or loss in value, isolated against a clean white background for clarity
Free with trial LNG Liquified Natural Gas price in global market going down decrease low international transaction trading commodity market vector. Trend decrease vectors LNG Liquified Natural Gas price in global market going down decrease low international transaction trading commodity
Free with trial A futuristic digital infographic showcasing business strategy and growth. The scene features glowing charts, bar graphs, circular progress indicators with percentages, and stacks of gold coins, symbolizing financial success. A prominent neon arrow curves upwards, indicating a positive trend and progress. The dark, high-tech background enhances the visual impact, making it ideal for presentations on finance, business, technology, and data analysis. Trend decrease illustrations Digital Growth Infographic with Financial Data and Upward Trend Arrow. A futuristic digital infographic showcasing business strategy and growth. The scene features glowing charts, bar graphs, circular progress indicators with percentages, and stacks of gold coins, symbolizing financial success. A prominent neon arrow curves upwards, indicating a positive trend and progress. The dark, high-tech background enhances the visual impact, making it ideal for presentations on finance, business, technology, and data analysis.
Free with trial Simple hand drawn black and white illustration of a declining graph on a white background, indicating loss, decrease, or economic downturn and representing a negative trend in business or finance. Trend decrease vectors Hand Drawn Declining Graph Illustration on White Background Stock Image. Simple hand drawn black and white illustration of a declining graph on a white background, indicating loss, decrease, or economic downturn and representing a negative trend in business or finance.
Free with trial The image depicts a downward trending line, glowing in a vibrant purple hue, set against a backdrop of a star-filled night sky. a nebula adds a touch of cosmic beauty to the scene. the line itself is jagged, suggesting volatility or instability, and culminates in an arrow pointing downwards, emphasizing the negative trend. the overall impression is one of decline or loss, perhaps in a financial or abstract sense. the starry background adds a sense of scale and drama to the image. Trend decrease illustrations Falling trend line on a cosmic background. the image depicts a downward trending line, glowing in a vibrant purple hue, set against a backdrop of a star-filled night sky. a nebula adds a touch of cosmic beauty to the scene. the line itself is jagged, suggesting volatility or instability, and culminates in an arrow pointing downwards, emphasizing the negative trend. the overall impression is one of decline or loss, perhaps in a financial or abstract sense. the starry background adds a sense of scale and drama to the image.
Free with trial A 3d rendering of three stacks of gold coins on a grey platform with a white downward trend arrow pointing to the tallest stack. Trend decrease illustrations A stack of gold coins with a downward trend arrow. a 3d rendering of three stacks of gold coins on a grey platform with a white downward trend arrow pointing to the tallest stack
Free with trial Business bar graph with upward and downward arrow. Trend analysis icon vector. Trend decrease vectors Business bar graph with upward and downward arrow. Trend analysis icon
Free with trial This graphic features two distinct 3D arrows. A vibrant green arrow points upward, symbolizing increase, progress, or positive movement. Alongside it, a bold red arrow points downward, indicating a decrease, decline, or negative trend. Trend decrease illustrations Green up arrow and red down arrow symbols representing growth and decline finances or data white background. This graphic features two distinct 3D arrows. A vibrant green arrow points upward, symbolizing increase, progress, or positive movement. Alongside it, a bold red arrow points downward, indicating a decrease, decline, or negative trend
Free with trial This image is a simple vector graphic depicting a downward trending line graph. The graph is enclosed in a square with a bold black border and shows a blue line indicating a decrease in values over ti. Trend decrease illustrations Downward Trend Graph, Data Decline Icon. This image is a simple vector graphic depicting a downward trending line graph. The graph is enclosed in a square with a bold black border and shows a blue line indicating a decrease in values over ti
Free with trial This image is a simple vector graphic depicting a downward trending line graph. The graph is enclosed in a square with a bold black border and shows a blue line indicating a decrease in values over ti. Trend decrease illustrations Downward Trend Graph, Data Decline Icon. This image is a simple vector graphic depicting a downward trending line graph. The graph is enclosed in a square with a bold black border and shows a blue line indicating a decrease in values over ti
Free with trial Business bar graph icon with upward and downward arrow. Trend analysis symbol vector in circular outline. Trend decrease vectors Business bar graph icon with upward and downward arrow. Trend analysis symbol in circular outline
Free with trial Education fund academic tuition price school university rate quality going down decrease crisis financing money and cap global map transaction vector. Trend decrease illustrations Education fund academic tuition price school university rate quality going down decrease crisis financing money and cap
Free with trial A bar graph illustrates a decreasing trend in financial performance, indicated by a red arrow and a dollar symbol. Trend decrease illustrations Bar chart showing financial decline with downward trend and dollar sign. A bar graph illustrates a decreasing trend in financial performance, indicated by a red arrow and a dollar symbol
Free with trial Colorful bar chart illustrating a gradual decrease against a transparent background, highlighting a decline in data and signaling a negative financial trend or recession. Trend decrease vectors Bar chart gradually decreasing with transparent background. Colorful bar chart illustrating a gradual decrease against a transparent background, highlighting a decline in data and signaling a negative financial trend or recession
Free with trial The image depicts a financial chart, specifically a downward trending line graph, suggesting a stock market crash or economic downturn. the line is orange and jagged, indicating volatility and a significant decrease in value. the background features a dark blue grid with vertical lines, possibly representing data points or time intervals. the overall aesthetic is modern and digital, reinforcing the theme of financial technology and market analysis. the color scheme is dominated by blues and oranges, creating a sense of urgency and concern. Trend decrease illustrations Stock market crash illustration with downward trend. the image depicts a financial chart, specifically a downward trending line graph, suggesting a stock market crash or economic downturn. the line is orange and jagged, indicating volatility and a significant decrease in value. the background features a dark blue grid with vertical lines, possibly representing data points or time intervals. the overall aesthetic is modern and digital, reinforcing the theme of financial technology and market analysis. the color scheme is dominated by blues and oranges, creating a sense of urgency and concern.
Free with trial Represents a decline or decrease, commonly used in business or financial contexts to illustrate falling metrics or stock values. The bold arrow is accompanied by a thinner red line, enhancing the depiction of a steep drop. The overall design is minimalist, focusing on the concept of downward movement. Trend decrease illustrations Red arrow with a jagged downward trend on a transparent, checkered background. . Represents a decline or decrease, commonly used in business or financial contexts to illustrate falling metrics or stock values. The bold arrow is accompanied by a thinner red line, enhancing the depiction of a steep drop. The overall design is minimalist, focusing on the concept of downward movement.
Free with trial Increase and Decrease Stroke icon collections. Containing Increase, Decrease, Growth, Fall, up, down icons. Editable Stroke icon collections. Trend decrease vectors Increase and Decrease Stroke icon collections.
Free with trial A bright red, jagged arrow points downwards, indicating a sharp decline or negative trend, isolated on a white background. Trend decrease illustrations Red jagged downward trend arrow isolated on white background. A bright red, jagged arrow points downwards, indicating a sharp decline or negative trend, isolated on a white background
Free with trial Conceptual graph with decrease report. Dark diagram with recession and bankruptcy progress. Business and finance vector illustration. Trend decrease vectors Conceptual graph with decrease report. Dark diagram with recession and bankruptcy progress. Business and finance vector
Free with trial The image features a three-dimensional, glossy red arrow pointing downwards. The arrow has a smooth gradient and a sleek design, emphasizing a clear direction of decline or reduction. It is set against a plain, light-colored background, ensuring the arrow is the focal point of the image. Trend decrease illustrations A bold red downward arrow indicating a decrease or downward trend. The image features a three-dimensional, glossy red arrow pointing downwards. The arrow has a smooth gradient and a sleek design, emphasizing a clear direction of decline or reduction. It is set against a plain, light-colored background, ensuring the arrow is the focal point of the image
Free with trial A bold, glossy red arrow curves downwards, signifying a decrease in business performance, economic downturn, or negative trend. Its sleek design conveys a clear message of decline. Trend decrease illustrations Glossy red downward arrow symbolizing decline progress and business trends. A bold, glossy red arrow curves downwards, signifying a decrease in business performance, economic downturn, or negative trend. Its sleek design conveys a clear message of decline
Free with trial A sharp red arrow points downwards, illustrating a significant decrease or failure. This visual metaphor is commonly used to represent economic recession, stock market losses, or declining performance. Trend decrease illustrations Red downward trend arrow symbolizing financial decline and market downturn. A sharp red arrow points downwards, illustrating a significant decrease or failure. This visual metaphor is commonly used to represent economic recession, stock market losses, or declining performance
Free with trial Diagram with recession and bankruptcy. Graph with decrease report. Business and finance vector illustration. Trend decrease vectors Diagram with recession and bankruptcy. Graph with decrease report. Business and finance vector
Free with trial A simple, hand-drawn line graph displayed on a plain white background illustrates a notable downward trend. The black line demonstrates decreasing values over time along the defined axes. Trend decrease vectors Descending line graph displays a downward trend, isolated on white background. A simple, hand-drawn line graph displayed on a plain white background illustrates a notable downward trend. The black line demonstrates decreasing values over time along the defined axes.
Free with trial Red 3D zigzag arrow is showing downward trend on white background, subtle shadowing, copy space. Progress, decline, analytics, chart, visualization, presentation, digital. Trend decrease illustrations Red 3D zigzag arrow is showing downward trend on white background, subtle shadowing, copy space
Free with trial A glossy red arrow curves downwards, symbolizing a decrease or negative progression. This striking visual effectively communicates concepts of falling, loss, or a downward trend in a clear and impactful manner. Trend decrease illustrations Dynamic red arrow points downward indicating decline loss or negative trend. A glossy red arrow curves downwards, symbolizing a decrease or negative progression. This striking visual effectively communicates concepts of falling, loss, or a downward trend in a clear and impactful manner
Free with trial A shiny red arrow curves downwards, indicating a downward trend or negative growth. This image visually represents concepts like financial decline market crash or falling stock prices. Trend decrease illustrations Red arrow points downward showing decline trend and negative growth concept. A shiny red arrow curves downwards, indicating a downward trend or negative growth. This image visually represents concepts like financial decline market crash or falling stock prices
Free with trial A 3D bar chart with a red arrow indicating a significant downward trend, symbolizing financial loss or economic decline. Isolated on a white background. Trend decrease illustrations Bar chart showing a downward trend isolated on white background. A 3D bar chart with a red arrow indicating a significant downward trend, symbolizing financial loss or economic decline. Isolated on a white background
Free with trial The image depicts a bar graph displayed on an easel, illustrating a downward trend over time. The bars start high on the left and progressively decrease in height towards the right, with a red arrow emphasizing the decline. The graph's y-axis appears to measure an unspecified metric, while the x-axis represents a timeline. Trend decrease illustrations Graph showing decline over time. The image depicts a bar graph displayed on an easel, illustrating a downward trend over time. The bars start high on the left and progressively decrease in height towards the right, with a red arrow emphasizing the decline. The graph's y-axis appears to measure an unspecified metric, while the x-axis represents a timeline
Free with trial A bold red speech bubble paired with a downward pointing arrow, visually representing a decrease in conversation or a negative trend in communication. Trend decrease illustrations Red speech bubble icon with downward arrow symbolizing communication decline. A bold red speech bubble paired with a downward pointing arrow, visually representing a decrease in conversation or a negative trend in communication
Free with trial Diagram with recession and bankruptcy progress. Graph with decrease report. Business and finance vector. Trend decrease vectors Diagram with recession and bankruptcy progress. Graph with decrease report. Business and finance
Free with trial A striking red arrow curves downward, representing economic downturn, financial loss, or a negative trend. This visual metaphor is perfect for presentations on market changes or business performance. Trend decrease illustrations Red downward arrow symbolizing decline and negative trend in business and finance. A striking red arrow curves downward, representing economic downturn, financial loss, or a negative trend. This visual metaphor is perfect for presentations on market changes or business performance
Free with trial This black and white graphic depicts intersecting triangles with a downward-pointing arrow, rendered in a hatched style. The composition suggests a downward trend, illustrated through the combined shapes. Trend decrease illustrations Vector Graphic Showing Downward Trend Through Intersecting Triangles and Arrow. This black and white graphic depicts intersecting triangles with a downward-pointing arrow, rendered in a hatched style. The composition suggests a downward trend, illustrated through the combined shapes.
Free with trial An illuminated downward arrow with a jagged line signifies a decline, representing negative performance and can be used to illustrate a decrease in business or any downward trend. Trend decrease illustrations Declining Arrow Shows Downtrend and Negative Performance. An illuminated downward arrow with a jagged line signifies a decline, representing negative performance and can be used to illustrate a decrease in business or any downward trend
Free with trial An isometric view of a bar chart with five blue bars of decreasing height, representing a downward trend. A red arrow points downwards, indicating a negative trajectory. Trend decrease illustrations Bar chart showing a downward trend with a red arrow isolated on white background. An isometric view of a bar chart with five blue bars of decreasing height, representing a downward trend. A red arrow points downwards, indicating a negative trajectory
Free with trial The image shows a visual representation of a downward trend using a bar chart and a bold red arrow pointing downward. The chart is displayed on a light-colored easel with a small figure standing behind it, suggesting a presentation or analysis of decreasing values over time, possibly in a business or financial context. Trend decrease illustrations Declining trend illustrated with bar chart and arrow on easel. The image shows a visual representation of a downward trend using a bar chart and a bold red arrow. The image shows a visual representation of a downward trend using a bar chart and a bold red arrow pointing downward. The chart is displayed on a light-colored easel with a small figure standing behind it, suggesting a presentation or analysis of decreasing values over time, possibly in a business or financial context
Free with trial Bar chart collapse icon with downward arrow. Decline and negative trend sign symbol vector. Trend decrease vectors Bar chart collapse icon with downward arrow. Decline and negative trend sign symbol
Free with trial This image shows a bar graph with a downward trend, indicated by a red arrow. It represents a decline in business, finance, or the economy, isolated on white. Trend decrease illustrations A bar graph showing a downward trend with a red arrow isolated on white background. This image shows a bar graph with a downward trend, indicated by a red arrow. It represents a decline in business, finance, or the economy, isolated on white
Free with trial A red line graph shows a steady decline in values over a period. The downward trajectory reflects a significant decrease, with data points plotted against a grid background. Trend decrease illustrations Declining trend line illustrates significant downward movement in data over time. A red line graph shows a steady decline in values over a period. The downward trajectory reflects a significant decrease, with data points plotted against a grid background.
Free with trial Downward trend graph with large sad face and woman in casual attire. Ideal for business performance, feedback, failure, regret, decisions, emotions, analytics. Clean simple flat metaphor. Trend decrease vectors Declining Trend Graph with Sad Face and Casual Woman Highlighting Failure or Negative Feedback. Downward trend graph with large sad face and woman in casual attire. Ideal for business performance, feedback, failure, regret, decisions, emotions, analytics. Clean simple flat metaphor
Free with trial A dynamic red jagged arrow plunges downward, visually representing a sharp decline, economic downturn, or negative trend in business and finance. Ideal for charting losses or market drops. Trend decrease illustrations Red jagged arrow pointing down symbolizing financial decline or negative trend. A dynamic red jagged arrow plunges downward, visually representing a sharp decline, economic downturn, or negative trend in business and finance. Ideal for charting losses or market drops
Free with trial Increase and decrease arrows on black background. Trend decrease illustrations Increase and decrease arrows on black
Free with trial Up and down arrow on bar chart icon set. Growth and decline graph symbol illustration. Financial trend concept. Trend decrease vectors Up and down arrow on bar chart icon set. Growth and decline graph symbol. Financial trend concept
Free with trial Colorful Bar Chart Graph Showing Growth and Performance Over Time with Upward Trend. Trend decrease vectors Colorful Bar Chart Graph Showing Growth and Performance Over Time with Upward Trend
Free with trial A 3D illustration depicts a financial chart with a downward trend. Four vertical bars, colored yellow, orange, and green, are arranged in descending order of height, suggesting a decline. To the left, a prominent orange circle contains a white downward-pointing arrow, reinforcing the theme of a negative trend or decrease. The entire composition is set against a plain white background. Trend decrease illustrations Financial chart with downward trend indicator stock market. A 3D illustration depicts a financial chart with a downward trend. Four vertical bars, colored yellow, orange, and green, are arranged in descending order of height, suggesting a decline. To the left, a prominent orange circle contains a white downward-pointing arrow, reinforcing the theme of a negative trend or decrease. The entire composition is set against a plain white background
Free with trial Five colorful bars, resembling a chart, visually represent a downward trend. The bars are yellow, green, blue and purple. Trend decrease vectors Colorful bar chart illustration showing declining trend on transparent background. Five colorful bars, resembling a chart, visually represent a downward trend. The bars are yellow, green, blue and purple.
Free with trial A flat vector icon of a line graph showing a downward trend. Represents financial loss, market decline, negative statistics, or decreasing performance. Suitable for business reports, financial news, or graphics illustrating economic downturns, vector design Generative AI. Trend decrease vectors Downward trending line graph icon financial market decrease, vector design Generative AI. A flat vector icon of a line graph showing a downward trend. Represents financial loss, market decline, negative statistics, or decreasing performance. Suitable for business reports, financial news, or graphics illustrating economic downturns, vector design Generative AI
Free with trial Conceptual graph with decrease report. Diagram with recession and bankruptcy progress. Business and finance vector illustration. Trend decrease vectors Conceptual graph with decrease report. Diagram with recession and bankruptcy progress. Business and finance vector
Free with trial A glowing neon blue line graph depicts a steep downward trend with an arrow indicating a significant fall. Trend decrease illustrations Neon blue graph illustrating a sharp decline and downward trend on a dark background. A glowing neon blue line graph depicts a steep downward trend with an arrow indicating a significant fall
Free with trial Red downward trend arrow on dark surface. Trend decrease illustrations Red downward trend arrow on dark surface
Free with trial A visual representation of a percentage decrease. It features a percentage sign followed by a downward trending arrow, isolated on a white surface. The image conveys concepts of loss, decline, or negative growth. Trend decrease illustrations Percentage decrease isolated on white background. use cases: finance, economy, business. A visual representation of a percentage decrease. It features a percentage sign followed by a downward trending arrow, isolated on a white surface. The image conveys concepts of loss, decline, or negative growth
Free with trial A hand in a black suit sleeve points downward against a red background. A zigzagging red arrow aligns with the hand's gesture, symbolizing a decline or reduction. The arrow starts at the top left and moves towards the bottom right, emphasizing a downward trend. The image conveys themes of financial loss or decrease and uses bold red to highlight urgency or danger. Trend decrease illustrations A hand in a black suit sleeve points downward against a red background. A
Free with trial A simple bar chart with a falling line, symbolizing financial decline, economic downturn, decreased profits, market loss, or negative business results. Ideal for illustrating risks, challenges, crisis situations, and economic analysis. Trend decrease vectors Declining financial chart icon with downward trend showing loss, decrease and negative business performance. A simple bar chart with a falling line, symbolizing financial decline, economic downturn, decreased profits, market loss, or negative business results. Ideal for illustrating risks, challenges, crisis situations, and economic analysis.
Free with trial A simple black line graph depicts a downward trend with sharp fluctuations on white. Trend decrease illustrations Black line graph showing a downward trend on a white background chart. A simple black line graph depicts a downward trend with sharp fluctuations on white
Free with trial A minimalist graphic illustration of a downward financial trend features a green line graph with three vertical bars topped by dollar signs, where the first bar is green, the second yellow, and the third orange, symbolizing decreasing monetary value, set against a clean white background with scattered dollar signs emphasizing economic decline, conveying a clear message of financial loss, market. Trend decrease illustrations Downward financial trend with colored dollar signs on white background. A minimalist graphic illustration of a downward financial trend features a green line graph with three vertical bars topped by dollar signs, where the first bar is green, the second yellow, and the third orange, symbolizing decreasing monetary value, set against a clean white background with scattered dollar signs emphasizing economic decline, conveying a clear message of financial loss, market