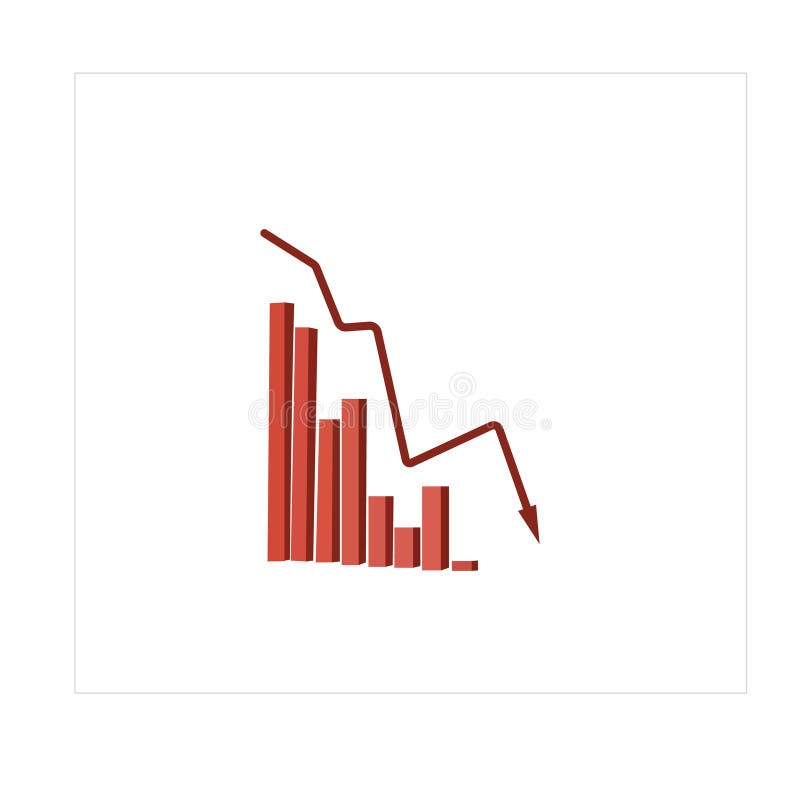
Free with trial A bar graph showing a downward trend with a red arrow indicating a decline. Trend decrease illustrations Decreasing bar graph with downward arrow isolated on white background. A bar graph showing a downward trend with a red arrow indicating a decline
Free with trial Two identical bright green arrows are positioned side by side, both pointing directly downwards. They are rendered in a clean, 3D style and stand isolated on a stark white background, creating a clear visual representation of downward movement or a negative trend. Trend decrease illustrations Two Bright Green Downward Pointing Arrows Side by Side on a White Background direction. Two identical bright green arrows are positioned side by side, both pointing directly downwards. They are rendered in a clean, 3D style and stand isolated on a stark white background, creating a clear visual representation of downward movement or a negative trend
Free with trial A man in a dark suit touches a glowing blue digital interface overlaid on a downward trending bar graph. Trend decrease illustrations Businessman touching glowing digital interface with downward trend graph technology. A man in a dark suit touches a glowing blue digital interface overlaid on a downward trending bar graph
Free with trial A striking 3D render illustrating a significant financial or business decline. The image features a minimalist bar chart with three decreasing blue-grey bars, symbolizing a negative trend or falling performance. A prominent, jagged red arrow sharply points downwards across the chart, emphatically conveying concepts of loss, recession, crisis, or market downturn. Set against a vibrant yellow background, this clean and modern graphic is ideal for presentations, reports, articles, or educational materials discussing economic challenges, poor statistics, or business risks. Trend decrease illustrations Financial Decline Bar Chart with Red Down Arrow. A striking 3D render illustrating a significant financial or business decline. The image features a minimalist bar chart with three decreasing blue-grey bars, symbolizing a negative trend or falling performance. A prominent, jagged red arrow sharply points downwards across the chart, emphatically conveying concepts of loss, recession, crisis, or market downturn. Set against a vibrant yellow background, this clean and modern graphic is ideal for presentations, reports, articles, or educational materials discussing economic challenges, poor statistics, or business risks.
Free with trial A striking 3D rendered image featuring a bar chart with decreasing red bars and a prominent red downward-pointing arrow, set against a vibrant yellow background. This minimalist visual powerfully symbolizes financial decline, economic recession, business loss, or a negative trend in performance. The clean design effectively conveys concepts of decreasing profits, market downturns, or poor investment outcomes. Ideal for presentations, financial reports, economic analysis, infographics, and articles discussing challenges, risks, or market volatility in business and finance. Trend decrease illustrations Economic Downturn Bar Chart with Downward Arrow. A striking 3D rendered image featuring a bar chart with decreasing red bars and a prominent red downward-pointing arrow, set against a vibrant yellow background. This minimalist visual powerfully symbolizes financial decline, economic recession, business loss, or a negative trend in performance. The clean design effectively conveys concepts of decreasing profits, market downturns, or poor investment outcomes. Ideal for presentations, financial reports, economic analysis, infographics, and articles discussing challenges, risks, or market volatility in business and finance.
Free with trial A striking 3D red arrow, constructed from individual rectangular blocks, curves and points downwards against a stark white background. The segmented design of the arrow suggests a process of decline or a downward trend, making it a powerful visual metaphor for concepts like economic downturn, loss, or negative progress. Trend decrease illustrations 3D Red Arrow Composed of Blocks Pointing Downwards on White descending. A striking 3D red arrow, constructed from individual rectangular blocks, curves and points downwards against a stark white background. The segmented design of the arrow suggests a process of decline or a downward trend, making it a powerful visual metaphor for concepts like economic downturn, loss, or negative progress
Free with trial A vibrant red arrow curves downwards, indicating a direction or trend. The arrow has a gradient effect and a sharp point. Trend decrease illustrations Red curved arrow pointing downward. A vibrant red arrow curves downwards, indicating a direction or trend. The arrow has a gradient effect and a sharp point
Free with trial A stark red arrow dramatically descends across a series of blue bars, illustrating a significant downward trend. Trend decrease illustrations Red arrow shows sharp decline on blue bar graph. A stark red arrow dramatically descends across a series of blue bars, illustrating a significant downward trend
Free with trial Black icon of decreasing coin stacks with a downward curving arrow on white. Clear details and vibrant colors. Trend decrease illustrations Falling coin stacks with downward trending arrow icon decrease decline. Black icon of decreasing coin stacks with a downward curving arrow on white. Clear details and vibrant colors
Free with trial Black and white icon of a bar graph with short bars and a downward pointing arrow. Trend decrease illustrations Bar graph with short bars and a downward pointing arrow bar chart decrease. Black and white icon of a bar graph with short bars and a downward pointing arrow
Free with trial Black and red arrow pointing downward on financial graph showing a decline. Business growth chart with falling trend line for investment analysis. Trend decrease illustrations Black and red arrow pointing downward on financial graph showing a decline
Free with trial A minimalist and clean line art illustration of a graph depicting a downward trend, symbolizing economic decline, failure, or a recession in business. Trend decrease vectors Simple Outline Falling Graph Line Chart Economic Recession Business Icon. A minimalist and clean line art illustration of a graph depicting a downward trend, symbolizing economic decline, failure, or a recession in business.
Free with trial A stark red arrow graphically depicts a significant downward trend on a white chart, symbolizing financial loss or market crash. Trend decrease illustrations Red arrow graph showing sharp financial decline. A stark red arrow graphically depicts a significant downward trend on a white chart, symbolizing financial loss or market crash
Free with trial A vibrant red arrow curves downwards, indicating a direction or trend. The arrow has a gradient effect and a sharp point. Trend decrease illustrations Red curved arrow pointing downward. A vibrant red arrow curves downwards, indicating a direction or trend. The arrow has a gradient effect and a sharp point
Free with trial A vibrant, glossy 3D red arrow points directly downwards, rendered with smooth, rounded edges. The clear, transparent background makes this versatile graphic ideal for various design applications. It effectively symbolizes concepts like decrease, download, decline, navigation, or drawing attention to content below. Perfect for web interfaces, mobile apps, presentations, infographics, and marketing materials requiring a clear directional indicator or a visual representation of downward trends. Trend decrease illustrations 3D Red Down Arrow Icon on Transparent Background. A vibrant, glossy 3D red arrow points directly downwards, rendered with smooth, rounded edges. The clear, transparent background makes this versatile graphic ideal for various design applications. It effectively symbolizes concepts like decrease, download, decline, navigation, or drawing attention to content below. Perfect for web interfaces, mobile apps, presentations, infographics, and marketing materials requiring a clear directional indicator or a visual representation of downward trends.
Free with trial Black icon of a falling graph with a downward arrow on a white background. Clear details and vibrant colors en. Trend decrease illustrations Falling Graph with Downward Arrow Icon on White Background downward trend decline. Black icon of a falling graph with a downward arrow on a white background. Clear details and vibrant colors en
Free with trial Neutral face symbol with downward arrow signifying decrease or decline, positioned above a cloud icon. Ideal for concepts thumbs up emotion, productivity, transition, feedback, mental state, change. Trend decrease vectors Neutral expression face with downward arrow and cloud representing mood or emotional shift. Neutral face symbol with downward arrow signifying decrease or decline, positioned above a cloud icon. Ideal for concepts thumbs up emotion, productivity, transition, feedback, mental state, change
Free with trial A woman is working on a laptop analyzing a digital graph that shows cost reduction for a successful business model She is using a pen to focus on the downward trend highlighting the strategy and financial planning for efficiency and growth This highlights digital transformation for effective business analysis and future cost management. Trend decrease illustrations Cost Reduction Strategy Digital Transformation Business Analysis and Financial Planning for Success. A woman is working on a laptop analyzing a digital graph that shows cost reduction for a successful business model She is using a pen to focus on the downward trend highlighting the strategy and financial planning for efficiency and growth This highlights digital transformation for effective business analysis and future cost management
Free with trial Smartphone screen with password protection icon, downward sale arrow, and a chart depicting analytics. Ideal for cybersecurity, digital sales, ecommerce metrics, data protection, online safety. Trend decrease vectors Mobile Security Features and Analytics Highlighting Sales Performance with Trend Insights. Smartphone screen with password protection icon, downward sale arrow, and a chart depicting analytics. Ideal for cybersecurity, digital sales, ecommerce metrics, data protection, online safety
Free with trial A stark red arrow zigzags downwards, symbolizing a significant financial or economic downturn and a sharp decrease. Trend decrease illustrations Red arrow chart showing sharp decline and downturn. A stark red arrow zigzags downwards, symbolizing a significant financial or economic downturn and a sharp decrease
Free with trial A visual representation of declining performance, with red bars and a descending line graph on a white background. Trend decrease illustrations Red bar chart showing downward trend and line graph. A visual representation of declining performance, with red bars and a descending line graph on a white background.
Free with trial This image presents a compelling visual representation of a global economic downturn. A prominent, three-dimensional white arrow dramatically plunges downward, superimposed on a world map rendered in dark, somber tones. The map serves as a backdrop to several red bar graphs, illustrating a decline in various economic indicators across different regions of the globe. The overall color scheme reinforces a sense of crisis and uncertainty. The arrow's sharp descent visually emphasizes the severity of the economic drop. Numerical data and graphical representations are included, further supporting the downward economic trend. Trend decrease illustrations Global Economic Downturn Visualized with 3D Arrow and Charts. This image presents a compelling visual representation of a global economic downturn. A prominent, three-dimensional white arrow dramatically plunges downward, superimposed on a world map rendered in dark, somber tones. The map serves as a backdrop to several red bar graphs, illustrating a decline in various economic indicators across different regions of the globe. The overall color scheme reinforces a sense of crisis and uncertainty. The arrow's sharp descent visually emphasizes the severity of the economic drop. Numerical data and graphical representations are included, further supporting the downward economic trend.
Free with trial A stark visual representation of declining oil prices features several black oil barrels, one of which is tipped over, spilling its dark contents onto a clean white surface. A bold red arrow dramatically descends from the upper left, clearly indicating a downward trend. This composition effectively communicates concepts of economic downturn, market volatility, and financial loss within the energy. Trend decrease illustrations Falling oil prices depicted by spilled oil barrels and a downward trending red arrow on a white background. A stark visual representation of declining oil prices features several black oil barrels, one of which is tipped over, spilling its dark contents onto a clean white surface. A bold red arrow dramatically descends from the upper left, clearly indicating a downward trend. This composition effectively communicates concepts of economic downturn, market volatility, and financial loss within the energy
Free with trial A visual representation of a business or financial metric showing a significant decline, depicted by a series of blue bars and a descending red arrow. Trend decrease illustrations Bar chart with red arrow indicating a downward trend. A visual representation of a business or financial metric showing a significant decline, depicted by a series of blue bars and a descending red arrow
Free with trial A simple line graph showing a downward trend with an arrow pointing down on a white background. Trend decrease illustrations Downward trending line graph with arrow indicating decline business finance. A simple line graph showing a downward trend with an arrow pointing down on a white background
Free with trial A red downward arrow and a red bar chart showing a decline are presented on a white background. Trend decrease illustrations Red Downward Arrow and Bar Chart Symbolizing Decrease and Decline Keywords: decrease, decline, down, arrow, bar. A red downward arrow and a red bar chart showing a decline are presented on a white background
Free with trial A stark red jagged arrow points downwards diagonally against a solid black background, symbolizing a significant decline or loss. Trend decrease illustrations Red jagged downward trend arrow on black background. A stark red jagged arrow points downwards diagonally against a solid black background, symbolizing a significant decline or loss
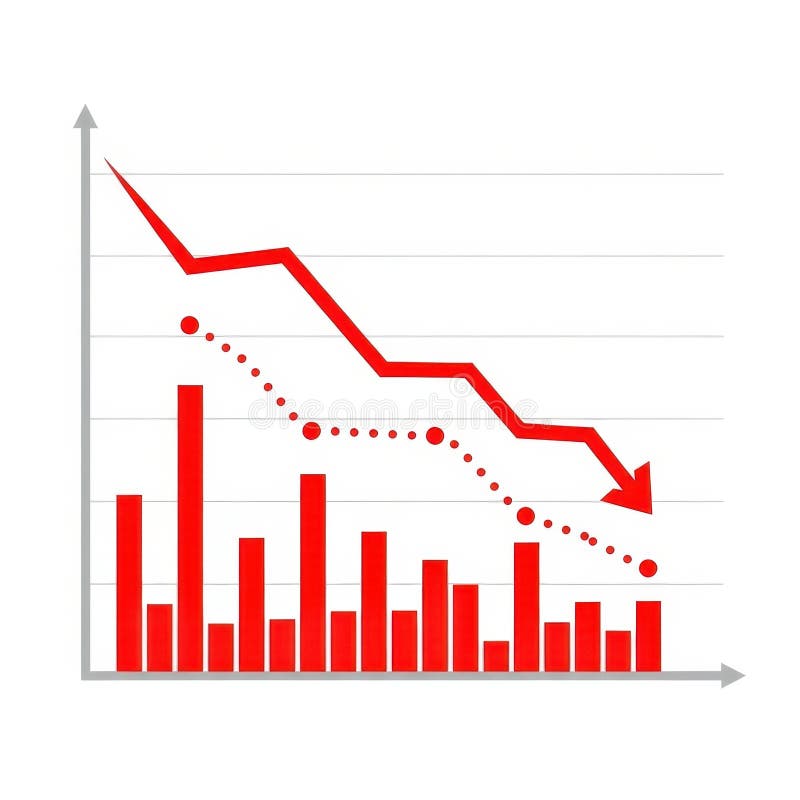
Free with trial A visual representation of negative financial performance. It features red bars and a red line graph showing a downward trend, accompanied by a dotted line indicating a similar pattern. Trend decrease illustrations Red downward trending graph with bars and dotted line. A visual representation of negative financial performance. It features red bars and a red line graph showing a downward trend, accompanied by a dotted line indicating a similar pattern
Free with trial This illustration shows a downward trend for the US dollar and an upward trend for the Japanese Yen, generated by AI. The graphic uses stylized gold coins with currency symbols and directional arrows to clearly visualize the contrasting market movements. Trend decrease illustrations USD vs. Yen: Currency Fluctuation. This illustration shows a downward trend for the US dollar and an upward trend for the Japanese Yen, generated by AI. The graphic uses stylized gold coins with currency symbols and directional arrows to clearly visualize the contrasting market movements.
Free with trial 3D rendered graphic showing the word Finance in bold black letters with a green upward trending arrow above and a red downward trending arrow below, flanked by blue opposing arrows on a grid background. Trend decrease illustrations Finance growth upward trend with opposing arrows image. 3D rendered graphic showing the word Finance in bold black letters with a green upward trending arrow above and a red downward trending arrow below, flanked by blue opposing arrows on a grid background
Free with trial A blue bar chart shows a downward trend indicated by a sharp red arrow. Isolated on a transparent background. Trend decrease vectors Blue bar chart with red downward trending arrow isolated on a transparent background. A blue bar chart shows a downward trend indicated by a sharp red arrow. Isolated on a transparent background
Free with trial Three identical green arrows are depicted pointing downwards. Each arrow is adorned with a white percentage sign (%) in its center. The arrows are arranged in a row and have a subtle gradient, giving them a sense of depth. They are presented against a black background, highlighting the visual representation of a downward trend or reduction. Trend decrease illustrations Three green arrows pointing down with percent symbols. Three identical green arrows are depicted pointing downwards. Each arrow is adorned with a white percentage sign (%) in its center. The arrows are arranged in a row and have a subtle gradient, giving them a sense of depth. They are presented against a black background, highlighting the visual representation of a downward trend or reduction
Free with trial A stark black jagged arrow descends diagonally, indicating a sharp decline or negative trend. Its sharp angles suggest volatility. Trend decrease illustrations Black jagged arrow pointing downward and to the right. A stark black jagged arrow descends diagonally, indicating a sharp decline or negative trend. Its sharp angles suggest volatility
Free with trial Wooden blocks spelling 'COST' are placed on stacks of coins, with white arrows indicating a downward trend, symbolizing cost reduction. Trend decrease illustrations Wooden blocks spelling cost descending on stacked coins with downward arrows. Wooden blocks spelling 'COST' are placed on stacks of coins, with white arrows indicating a downward trend, symbolizing cost reduction
Free with trial A single, glossy, bright green arrow pointing directly downwards is presented against a clean white background. The arrow has a smooth, rounded shape with a reflective surface, suggesting a 3D rendered object. Its simple and clear design makes it a versatile symbol for indicating direction, decrease, or negative trends. Trend decrease illustrations Glossy Green Downward Arrow Symbol on White Background direction. A single, glossy, bright green arrow pointing directly downwards is presented against a clean white background. The arrow has a smooth, rounded shape with a reflective surface, suggesting a 3D rendered object. Its simple and clear design makes it a versatile symbol for indicating direction, decrease, or negative trends
Free with trial A series of seven golden, metallic bars are arranged in a descending order, forming a bar chart that illustrates a significant decline. The bars are highly reflective, catching the light and emphasizing their three-dimensional form. The chart is presented in isolation against a pure white background, making the visual representation of a downward trend clear and impactful. Trend decrease illustrations Golden Bar Chart Showing a Steep Decline on White Background graph statistics. A series of seven golden, metallic bars are arranged in a descending order, forming a bar chart that illustrates a significant decline. The bars are highly reflective, catching the light and emphasizing their three-dimensional form. The chart is presented in isolation against a pure white background, making the visual representation of a downward trend clear and impactful
Free with trial Financial stock market chart with falling red arrow and rising green arrow. Business growth and decline concept for economic analysis success failure and investment. Trend decrease vectors Red decreasing and green increasing arrows representing market trend analytics. Financial stock market chart with falling red arrow and rising green arrow. Business growth and decline concept for economic analysis success failure and investment
Free with trial A black silhouette of a bar chart with three bars of decreasing height, representing a downward trend on a white background. Trend decrease illustrations Black Bar Chart Icon Showing Decreasing Values on White Background graph data. A black silhouette of a bar chart with three bars of decreasing height, representing a downward trend on a white background
Free with trial Black down arrows and horizontal bars arranged vertically on a white background. Clear details and vibrant col. Trend decrease illustrations Black down arrows and horizontal bars on white background descending decrease. Black down arrows and horizontal bars arranged vertically on a white background. Clear details and vibrant col
Free with trial A black jagged line graph with an arrow pointing downwards on a white background. Clear details and vibrant co. Trend decrease illustrations Black descending jagged line graph with arrow indicating downward trend chart. A black jagged line graph with an arrow pointing downwards on a white background. Clear details and vibrant co
Free with trial Downturn showing downward trending graph with arrow indicating decline keywords: graph, chart, decline. Trend decrease illustrations Downward Trending Graph With Arrow Indicating Decline Keywords: graph, chart, decline, decrease. Downturn showing downward trending graph with arrow indicating decline keywords: graph, chart, decline
Free with trial Bar chart illustration showing a descending trend. Four vertical bars in gradient hues of orange and blue decrease in height from left to right. A line graph with circles marks the top of each bar, emphasizing the downward trend. The design is simple and uses soft pastel colors, against a white background, highlighting the decreasing business data concept. Trend decrease vectors Decreasing Trend Graph: Business Data Chart Illustration. Bar chart illustration showing a descending trend. Four vertical bars in gradient hues of orange and blue decrease in height from left to right. A line graph with circles marks the top of each bar, emphasizing the downward trend. The design is simple and uses soft pastel colors, against a white background, highlighting the decreasing business data concept.
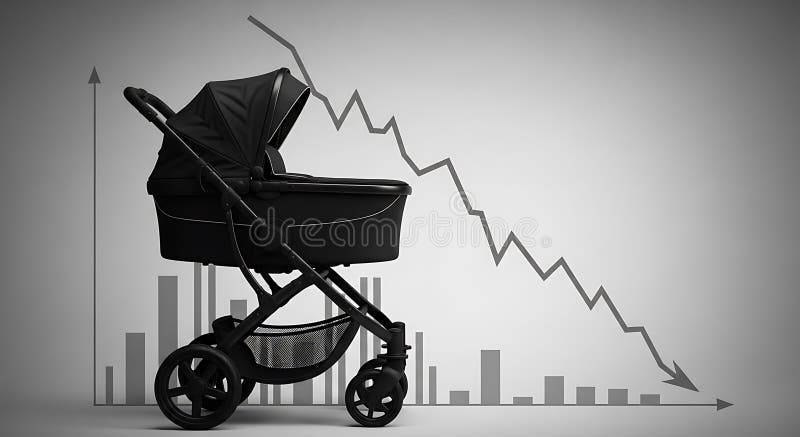
Free with trial A stark visual representation of demographic decline featuring a baby carriage silhouetted against a backdrop of a downward-trending graph and bar charts, symbolizing falling birth rates and. Trend decrease illustrations Demographic Decline Baby Carriage with Downturn Graph and Population Decrease Concept. A stark visual representation of demographic decline featuring a baby carriage silhouetted against a backdrop of a downward-trending graph and bar charts, symbolizing falling birth rates and
Free with trial Two distinct 3D arrows are presented against a white background. One arrow points directly upwards, while the other points directly downwards, symbolizing opposing directions or concepts such as progress and decline, or growth and decrease. Both arrows feature a layered, chevron-like design, giving them a modern and geometric appearance. Trend decrease illustrations Two 3D Arrows, One Pointing Up and One Pointing Down, with Layered Design on White Background. Two distinct 3D arrows are presented against a white background. One arrow points directly upwards, while the other points directly downwards, symbolizing opposing directions or concepts such as progress and decline, or growth and decrease. Both arrows feature a layered, chevron-like design, giving them a modern and geometric appearance
Free with trial Three glossy green arrows, each featuring a white percentage symbol, are pointing downwards. The arrows are arranged side-by-side and have a slight 3D effect. They are presented against a black background, conveying a message of decrease, reduction, or a sale. Trend decrease illustrations Three Green Arrows Pointing Down with Percentage Symbols. Three glossy green arrows, each featuring a white percentage symbol, are pointing downwards. The arrows are arranged side-by-side and have a slight 3D effect. They are presented against a black background, conveying a message of decrease, reduction, or a sale
Free with trial A downward pointing arrow graphic with connecting lines indicates a market dip or negative trend and can be used for financial analysis, presentations and website illustrations. Trend decrease illustrations Downward Arrow Concept Illustration. A downward pointing arrow graphic with connecting lines indicates a market dip or negative trend and can be used for financial analysis, presentations and website illustrations
Free with trial A jagged black line graph shows a steep downward trend ending with an arrow. Clear details and vibrant colors. Trend decrease illustrations Jagged black line graph trending downwards with arrow on white background line chart. A jagged black line graph shows a steep downward trend ending with an arrow. Clear details and vibrant colors
Free with trial Three bright green arrows pointing downwards are displayed side-by-side. Each arrow has a white percentage sign (%) prominently featured on its surface. The arrows have a slightly glossy appearance and are presented against a stark black background, emphasizing their downward trajectory and the concept of reduction or decrease. Trend decrease illustrations Three green downward arrows with percentage signs graphic. Three bright green arrows pointing downwards are displayed side-by-side. Each arrow has a white percentage sign (%) prominently featured on its surface. The arrows have a slightly glossy appearance and are presented against a stark black background, emphasizing their downward trajectory and the concept of reduction or decrease
Free with trial A downward trending chart line with an arrow shows negative movement against a dark background and can be used to represent concepts like loss or decrease. Trend decrease illustrations Decreasing Chart with Downward Arrow. A downward trending chart line with an arrow shows negative movement against a dark background and can be used to represent concepts like loss or decrease
Free with trial A 3D cloud icon displays a downward trending graph and falling dollar coins, symbolizing financial decline or loss. Trend decrease illustrations 3D Cloud Icon with Downward Trend Graph and Falling Dollar Coins finance economy. A 3D cloud icon displays a downward trending graph and falling dollar coins, symbolizing financial decline or loss
Free with trial Black bars decreasing in height diagonally on a white background, representing a downward trend or decline. Trend decrease illustrations Black bars decreasing in height diagonally on a white background bar chart graph. Black bars decreasing in height diagonally on a white background, representing a downward trend or decline
Free with trial Black and white illustration of a market cooling graph with a fan and dollar sign. Trend decrease illustrations Market cooling graph with fan, dollar sign and downward trend on white background. Black and white illustration of a market cooling graph with a fan and dollar sign
Free with trial Trading chart showing numbers increase and decrease on different globe areas. Financial market, investment, economy analyzing concept. Trend decrease illustrations Trading chart showing numbers increase and decrease on globe areas. Trading chart showing numbers increase and decrease on different globe areas. Financial market, investment, economy analyzing concept
Free with trial A vibrant red arrow graph dramatically depicts a downward trend, ideal for illustrating concepts of decline, loss, recession, or negative growth. The transparent background allows for seamless integration into various designs, presentations, and reports. This vector graphic is perfect for financial reports, presentations, websites, and social media posts. Trend decrease illustrations Red Downward Trending Arrow Graph on Transparent Background. A vibrant red arrow graph dramatically depicts a downward trend, ideal for illustrating concepts of decline, loss, recession, or negative growth. The transparent background allows for seamless integration into various designs, presentations, and reports. This vector graphic is perfect for financial reports, presentations, websites, and social media posts.
Free with trial A 3D bar graph illustrating a downward trend with a green arrow, featuring a heart icon with a minus sign, on a white background. Trend decrease illustrations 3D bar graph with a downward trending green arrow and a heart icon with a minus sign chart. A 3D bar graph illustrating a downward trend with a green arrow, featuring a heart icon with a minus sign, on a white background
Free with trial A black graph showing an upward trend with a curved arrow indicating a reversal on a white background. Trend decrease illustrations Upward trending graph with a curved arrow indicating a reversal on white background. A black graph showing an upward trend with a curved arrow indicating a reversal on a white background
Free with trial A red and green arrow graph shows a downward trend. The image represents financial loss, economic decline, or a negative market trend. It is a visual representation of a decreasing value. Trend decrease illustrations Red and green arrows pointing downwards on blue background. A red and green arrow graph shows a downward trend. The image represents financial loss, economic decline, or a negative market trend. It is a visual representation of a decreasing value
Free with trial A dynamic 3D visualization showcasing financial data. The scene features a rising bar chart with an upward trend arrow, symbolizing growth and success. Adjacent to it, a colorful pie chart represents data segmentation and distribution. The background is a dark, textured surface with subtle grid lines and abstract chart elements, creating a sophisticated and modern aesthetic. This imagery is ideal for presentations, reports, and digital content related to finance, business, economics, and data analysis. Trend decrease illustrations 3D Financial Data Visualization: Growth Charts and Pie Graph. A dynamic 3D visualization showcasing financial data. The scene features a rising bar chart with an upward trend arrow, symbolizing growth and success. Adjacent to it, a colorful pie chart represents data segmentation and distribution. The background is a dark, textured surface with subtle grid lines and abstract chart elements, creating a sophisticated and modern aesthetic. This imagery is ideal for presentations, reports, and digital content related to finance, business, economics, and data analysis.
Free with trial A 3D render of a white bar chart with a red arrow graph descending across it. The background is a white grid. The chart is isolated on a white surface with reflections. Trend decrease illustrations Red arrow graph chart showing downward trend on white grid background bar chart financial. A 3D render of a white bar chart with a red arrow graph descending across it. The background is a white grid. The chart is isolated on a white surface with reflections
Free with trial A modern boardroom scene features a large table surrounded by white chairs, but the focus is on a chart displaying a sharp downward trend, generated by AI for illustrative purposes. This image could represent various financial or business challenges. Trend decrease illustrations Boardroom Crisis. A modern boardroom scene features a large table surrounded by white chairs, but the focus is on a chart displaying a sharp downward trend, generated by AI for illustrative purposes. This image could represent various financial or business challenges.
Free with trial A neon sign shaped like a downward trending graph is mounted on a tile wall in a dark tunnel, symbolizing financial loss or market crash for business illustration. Trend decrease illustrations Downward Trend Neon Sign in Dark Tunnel. A neon sign shaped like a downward trending graph is mounted on a tile wall in a dark tunnel, symbolizing financial loss or market crash for business illustration
Free with trial A black icon showing a downward trending arrow over three stacks of coins of decreasing size. Trend decrease illustrations Black downward trending arrow over decreasing stacks of coins icon decrease decline. A black icon showing a downward trending arrow over three stacks of coins of decreasing size
Free with trial An abstract and futuristic visualization of a financial trading chart on a dark, cosmic background. The image features a candlestick graph transitioning from a volatile red phase into a clear bullish, upward trend in blue. This dynamic concept represents stock market growth, forex trading, cryptocurrency investment, and financial success. It's an ideal background for topics related to fintech, data analysis, economic recovery, and modern investment strategies, symbolizing progress and profitability in the digital economy. Trend decrease illustrations Futuristic Stock Market Trading Graph Background. An abstract and futuristic visualization of a financial trading chart on a dark, cosmic background. The image features a candlestick graph transitioning from a volatile red phase into a clear bullish, upward trend in blue. This dynamic concept represents stock market growth, forex trading, cryptocurrency investment, and financial success. It's an ideal background for topics related to fintech, data analysis, economic recovery, and modern investment strategies, symbolizing progress and profitability in the digital economy.
Free with trial A black geometric icon with a downward pointing arrow inside a triangle shape. Clear details and vibrant color. Trend decrease illustrations Black downward pointing arrow within a triangle on white background decline decrease. A black geometric icon with a downward pointing arrow inside a triangle shape. Clear details and vibrant color
Free with trial Four icons depict rising and falling percentage values with arrows and curved lines on a white background. Trend decrease illustrations Arrows indicating percentage increase and decrease in finance. Four icons depict rising and falling percentage values with arrows and curved lines on a white background
Free with trial This image visually represents a financial decline or economic downturn. Several stacks of shiny gold coins are prominently featured, symbolizing wealth and financial assets. A large, bold red arrow points downwards, directly indicating a decrease or loss. The composition suggests a conceptual representation of falling stock prices, economic recession, or financial crisis. It's ideal for illustrating concepts related to investment losses, market crashes, or financial instability. Trend decrease illustrations Financial Downturn: Stacks of Gold Coins with Red Downward Arrow. This image visually represents a financial decline or economic downturn. Several stacks of shiny gold coins are prominently featured, symbolizing wealth and financial assets. A large, bold red arrow points downwards, directly indicating a decrease or loss. The composition suggests a conceptual representation of falling stock prices, economic recession, or financial crisis. It's ideal for illustrating concepts related to investment losses, market crashes, or financial instability.
Free with trial The image depicts a downward trending line against a dark blue, starry background. the line itself is light blue and appears to be made of or surrounded by tiny particles, giving it a glowing effect. the line zigzags downwards, indicating a decline or loss, and ends with an arrow pointing further down. the overall impression is one of negative growth or a market downturn. Trend decrease illustrations Falling trend line with starry background. the image depicts a downward trending line against a dark blue, starry background. the line itself is light blue and appears to be made of or surrounded by tiny particles, giving it a glowing effect. the line zigzags downwards, indicating a decline or loss, and ends with an arrow pointing further down. the overall impression is one of negative growth or a market downturn.
Free with trial Declining Bar Chart Shows Economic Downturn Illustration Red Arrow Signifies Loss Trend. Trend decrease vectors Declining Bar Chart Shows Economic Downturn Illustration Red Arrow Signifies Loss Trend
Free with trial A bold red zigzag arrow sharply descends, visually representing a significant downturn, loss, or negative trend. This graphic element powerfully conveys a downward trajectory. Trend decrease illustrations Red zigzag arrow pointing downward symbolizing decline and loss. A bold red zigzag arrow sharply descends, visually representing a significant downturn, loss, or negative trend. This graphic element powerfully conveys a downward trajectory
Free with trial The image depicts a stylized, dark green forest with a bright green, fluctuating line superimposed over it. the line starts high on the left and trends downward to the right, ending with an arrow indicating a continued decline. the forest is composed of many trees with rounded canopies, creating a dense and somewhat mystical atmosphere. the overall impression is one of environmental or economic decline. Trend decrease illustrations Declining trend line in a forest landscape. the image depicts a stylized, dark green forest with a bright green, fluctuating line superimposed over it. the line starts high on the left and trends downward to the right, ending with an arrow indicating a continued decline. the forest is composed of many trees with rounded canopies, creating a dense and somewhat mystical atmosphere. the overall impression is one of environmental or economic decline.
Free with trial This image features a red downward arrow isolated on a white background. The arrow is depicted in a 3D style, with a smooth gradient shading to give it depth and dimension. The white background provides a stark contrast, making the red arrow the focal point of the image. This visual element is commonly used to represent decline, decrease, or negative trends. Trend decrease illustrations Red downward arrow isolated on white background. This image features a red downward arrow isolated on a white background. The arrow is depicted in a 3D style, with a smooth gradient shading to give it depth and dimension. The white background provides a stark contrast, making the red arrow the focal point of the image. This visual element is commonly used to represent decline, decrease, or negative trends
Free with trial A vibrant green arrow points upwards indicating progress or increase, while a glossy red arrow points downwards symbolizing decline or decrease, representing directional changes. Trend decrease illustrations Green up arrow and red down arrow icons symbolizing directional movement and change white background. A vibrant green arrow points upwards indicating progress or increase, while a glossy red arrow points downwards symbolizing decline or decrease, representing directional changes
Free with trial The image shows a stylized financial graph with a clear downward trend, rendered in a copper-like material. it sits on a polished floor in a modern interior. the background features a blurred living space, including a window with bright light, a desk, a chair, and a lamp. the graph's reflection is visible on the floor, enhancing the visual impact of the economic decline. the overall mood is somber, reflecting the negative financial trend. Trend decrease illustrations Financial downturn in modern interior space. the image shows a stylized financial graph with a clear downward trend, rendered in a copper-like material. it sits on a polished floor in a modern interior. the background features a blurred living space, including a window with bright light, a desk, a chair, and a lamp. the graph's reflection is visible on the floor, enhancing the visual impact of the economic decline. the overall mood is somber, reflecting the negative financial trend.
Free with trial The image shows a rusty metal chart depicting a downward trend, placed on a wet, dark industrial floor. the chart is designed with sharp angles, forming a line graph that consistently declines, ending with an arrow pointing downwards. the floor reflects the chart, creating a mirrored image that enhances the sense of decline and loss. the background is blurred, suggesting an industrial setting with dim lighting and a sense of neglect. the overall atmosphere is somber, conveying a message of economic downturn or failure. Trend decrease illustrations Rusty decline chart on wet industrial floor. the image shows a rusty metal chart depicting a downward trend, placed on a wet, dark industrial floor. the chart is designed with sharp angles, forming a line graph that consistently declines, ending with an arrow pointing downwards. the floor reflects the chart, creating a mirrored image that enhances the sense of decline and loss. the background is blurred, suggesting an industrial setting with dim lighting and a sense of neglect. the overall atmosphere is somber, conveying a message of economic downturn or failure.
Free with trial Two flat design icons with color. One depicts an upward bar chart with a blue arrow and percentage, the other a downward bar chart with a grey arrow and percentage. Trend decrease vectors Color Bar Chart Icons for Increase and Decrease graph Ai-Generated. Two flat design icons with color. One depicts an upward bar chart with a blue arrow and percentage, the other a downward bar chart with a grey arrow and percentage
Free with trial A high-quality conceptual image featuring a row of smooth wooden cubes spelling the word "PESSIMISM" on a wooden surface. The arrangement includes a stacked block showing a sad face emoticon and a downward-sloping line graph, symbolizing financial loss, recession, negative market sentiment, and psychological discouragement in a professional or personal context. Trend decrease illustrations Wooden Blocks Spelling Pessimism with Sad Face Icon and Downward Trend Graph. A high-quality conceptual image featuring a row of smooth wooden cubes spelling the word "PESSIMISM" on a wooden surface. The arrangement includes a stacked block showing a sad face emoticon and a downward-sloping line graph, symbolizing financial loss, recession, negative market sentiment, and psychological discouragement in a professional or personal context.
Free with trial A glossy, three-dimensional orange arrow curves downwards, clearly indicating a direction or a downward trend. This versatile graphic is perfect for representing various concepts related to movement or decline. Trend decrease illustrations Bright orange curved downward arrow icon signifying direction and movement white background. A glossy, three-dimensional orange arrow curves downwards, clearly indicating a direction or a downward trend. This versatile graphic is perfect for representing various concepts related to movement or decline
Free with trial A 3D icon features a blue pound sterling symbol within a white circle, which is bordered by a light blue ring. To the right of the circle, a small orange circle contains a white downward-pointing triangle, indicating a decrease or fall. The icon is presented on a clean white background with a subtle shadow. Trend decrease illustrations 3D Icon with Pound Sterling Symbol and Downward Arrow on White Background currency money. A 3D icon features a blue pound sterling symbol within a white circle, which is bordered by a light blue ring. To the right of the circle, a small orange circle contains a white downward-pointing triangle, indicating a decrease or fall. The icon is presented on a clean white background with a subtle shadow
Free with trial Vibrant financial decisions shown through floating digital market charts --chaos 55 --ar 16:9 --profile 8vfa4lb --v 7 Job ID: 73c43520-d3ac-4d75-940e-9fab8db6f1ed. Generative AI. Trend decrease illustrations Red Arrow Decrease on Stock Market Graph Showing Economic Downturn and Financial Decline. Vibrant financial decisions shown through floating digital market charts --chaos 55 --ar 16:9 --profile 8vfa4lb --v 7 Job ID: 73c43520-d3ac-4d75-940e-9fab8db6f1ed. Generative AI
Free with trial A conceptual image featuring wooden blocks spelling the word "TRUST" alongside a stacked block showing a downward trend graph and a sad face emoji. This composition symbolizes the loss of consumer confidence, economic recession, reputation damage, and the negative impact of poor service or financial decline in a professional business environment. Trend decrease illustrations Declining Trust and Business Failure Concept with Wooden Blocks and Sad Face Icon. A conceptual image featuring wooden blocks spelling the word "TRUST". A conceptual image featuring wooden blocks spelling the word "TRUST" alongside a stacked block showing a downward trend graph and a sad face emoji. This composition symbolizes the loss of consumer confidence, economic recession, reputation damage, and the negative impact of poor service or financial decline in a professional business environment.