Free with trial This image features a bar graph with red bars indicating a downward trend. The graph is isolated on a white background, making the red bars and the downward arrow clearly visible. The image is suitable for representing declining metrics or statistics. Trend decrease illustrations Decreasing bar graph isolated on white background. This image features a bar graph with red bars indicating a downward trend. The graph is isolated on a white background, making the red bars and the downward arrow clearly visible. The image is suitable for representing declining metrics or statistics
Free with trial Blue bars on a graph display a downward trend highlighted by a yellow arrow showing decline Great for illustrating economic concepts and market trends. Trend decrease illustrations Decreasing Bar Graph with Arrow Downward Financial Decline. Blue bars on a graph display a downward trend highlighted by a yellow arrow showing decline Great for illustrating economic concepts and market trends
Free with trial A simple bar chart and line graph with a downward arrow illustrates a negative trend like recession or business failure ideal for financial reports about crisis or loss. Trend decrease illustrations Declining Blue Bar Chart and Line Graph Showing Financial Loss on Gray Background. A simple bar chart and line graph with a downward arrow illustrates a negative trend like recession or business failure ideal for financial reports about crisis or loss
Free with trial The image depicts a white line graph sharply declining against a dark, grid-like background. the graph starts at a higher point on the left and then plummets downwards, eventually leveling out near the bottom of the frame. the grid provides a visual reference for the scale of the decline. the overall impression is one of a significant drop or downturn, possibly representing financial loss or a similar negative trend. Trend decrease illustrations Falling graph on dark grid background concept. the image depicts a white line graph sharply declining against a dark, grid-like background. the graph starts at a higher point on the left and then plummets downwards, eventually leveling out near the bottom of the frame. the grid provides a visual reference for the scale of the decline. the overall impression is one of a significant drop or downturn, possibly representing financial loss or a similar negative trend.
Free with trial The image shows a rusty, metallic graph depicting a downward trend. the graph is set against a dark, blurred background, possibly an industrial setting, with a reflective surface underneath. the arrow at the end of the graph points downwards, emphasizing the concept of decline or loss. the rust on the metal adds a sense of decay and age, further reinforcing the negative connotation. the lighting highlights the graph, making it the focal point of the image. Trend decrease illustrations Rusty decline: a visual representation of loss. the image shows a rusty, metallic graph depicting a downward trend. the graph is set against a dark, blurred background, possibly an industrial setting, with a reflective surface underneath. the arrow at the end of the graph points downwards, emphasizing the concept of decline or loss. the rust on the metal adds a sense of decay and age, further reinforcing the negative connotation. the lighting highlights the graph, making it the focal point of the image.
Free with trial A red, 3D, zigzagging arrow points downward, symbolizing decline or decrease. The arrow features smooth, glossy surfaces, accentuating its vivid color against a clean white background, creating a striking contrast. This design is often used in financial or analytical contexts to represent falling trends or negative growth. Trend decrease vectors Red 3d arrow pointing downward against black background. A red, 3D, zigzagging arrow points downward, symbolizing decline or decrease. The arrow features smooth, glossy surfaces, accentuating its vivid color against a clean white background, creating a striking contrast. This design is often used in financial or analytical contexts to represent falling trends or negative growth.
Free with trial The image displays a financial trend chart superimposed on a modern office setting. the chart depicts a declining trend, indicated by a downward-sloping line with an arrow pointing downwards. the background features a blurred office environment with windows, a plant, and furniture, creating a sense of realism and context for the financial data. the overall composition suggests a reflection or projection of financial performance within a contemporary workspace. Trend decrease illustrations Financial decline chart in modern office space. the image displays a financial trend chart superimposed on a modern office setting. the chart depicts a declining trend, indicated by a downward-sloping line with an arrow pointing downwards. the background features a blurred office environment with windows, a plant, and furniture, creating a sense of realism and context for the financial data. the overall composition suggests a reflection or projection of financial performance within a contemporary workspace.
Free with trial The image depicts a stylized representation of a business downturn chart. the chart is rendered as a glowing white line against a black background, creating a stark contrast. the line graph shows a clear downward trend, indicating a decline in business performance. the words "business downtorn" are visible above the chart. a reflective surface below the chart creates a mirrored image, enhancing the visual impact. the overall aesthetic is modern and minimalist, conveying a sense of concern about economic decline. Trend decrease illustrations Business downtorn chart with reflection effect. the image depicts a stylized representation of a business downturn chart. the chart is rendered as a glowing white line against a black background, creating a stark contrast. the line graph shows a clear downward trend, indicating a decline in business performance. the words "business downtorn" are visible above the chart. a reflective surface below the chart creates a mirrored image, enhancing the visual impact. the overall aesthetic is modern and minimalist, conveying a sense of concern about economic decline.
Free with trial Line graph with downward trend, sad face for dissatisfaction, alert bell for warning, and magnifier symbolizing evaluation. Ideal for data analysis, performance tracking, decline, warning, failure. Trend decrease vectors Declining Graph with Sad Face, Alert Bell, and Magnifier Indicating Negative Trends. Line graph with downward trend, sad face for dissatisfaction, alert bell for warning, and magnifier symbolizing evaluation. Ideal for data analysis, performance tracking, decline, warning, failure
Free with trial A conceptual image representing financial loss, economic downturn, or business failure. A person's hands are holding and seemingly guiding a glowing red line graph that is pointing sharply downwards. The arrow at the end confirms the negative trend. The neutral background keeps the focus on this clear symbol of decline. Generative AI. Trend decrease illustrations Two hands holding a glowing red line graph that is trending downwards. A conceptual image representing financial loss, economic downturn, or business failure. A person's hands are holding and seemingly guiding a glowing red line graph that is pointing sharply downwards. The arrow at the end confirms the negative trend. The neutral background keeps the focus on this clear symbol of decline. Generative AI.
Free with trial Red and green 3D arrows are set against a white background. The red arrow points downward and the green arrow points upward. Both arrows have a white percentage symbol centered on them, indicating a focus on financial or data trends. The scene is clean and minimalist, showcasing the contrast between the arrows and their significance in indicating decrease and increase. Trend decrease vectors Red down arrow and green up arrow with percentage signs on black background. Red and green 3D arrows are set against a white background. The red arrow points downward and the green arrow points upward. Both arrows have a white percentage symbol centered on them, indicating a focus on financial or data trends. The scene is clean and minimalist, showcasing the contrast between the arrows and their significance in indicating decrease and increase.
Free with trial An upward trending line graph showcases data points increasing, symbolizing growth and progress. The visual represents success, development, and positive statistics. Trend decrease vectors Positive Trend Graph, Data Points Rising Upward. An upward trending line graph showcases data points increasing, symbolizing growth and progress. The visual represents success, development, and positive statistics.
Free with trial The Price-to-Earnings (P E) ratio, and how is it used in stock valuation. Trend decrease illustrations Financial Market Data Display: Red Stock Market Trend. the Price-to-Earnings (P E) ratio, and how is it used in stock valuation
Free with trial The image shows a stylized, neon blue graph depicting a downward trend, overlaid on a background resembling the interior of a theater or auditorium. the graph is composed of many small, glowing particles, giving it a digital or futuristic appearance. the background features rows of empty seats and stage lighting, suggesting a performance venue. the overall impression is one of economic downturn or financial loss, visualized in an unusual and somewhat theatrical setting. Trend decrease illustrations Declining stock market graph in theater setting. the image shows a stylized, neon blue graph depicting a downward trend, overlaid on a background resembling the interior of a theater or auditorium. the graph is composed of many small, glowing particles, giving it a digital or futuristic appearance. the background features rows of empty seats and stage lighting, suggesting a performance venue. the overall impression is one of economic downturn or financial loss, visualized in an unusual and somewhat theatrical setting.
Free with trial The image shows a downward trending line graph, rendered in a bright, neon blue. the line is composed of many small dots, giving it a somewhat ethereal appearance. the background resembles a stage or auditorium, with rows of seats and stage lighting. the overall impression is one of decline or loss, perhaps representing a financial downturn or a negative trend in some other area. the lighting adds a sense of drama and importance to the image. Trend decrease illustrations Stock market crash with dramatic stage lighting. the image shows a downward trending line graph, rendered in a bright, neon blue. the line is composed of many small dots, giving it a somewhat ethereal appearance. the background resembles a stage or auditorium, with rows of seats and stage lighting. the overall impression is one of decline or loss, perhaps representing a financial downturn or a negative trend in some other area. the lighting adds a sense of drama and importance to the image.
Free with trial This image showcases a bar graph depicting rising factory production, generated by AI, superimposed on a blurred background of a bustling industrial facility. The upward trend suggests growth and efficiency in the manufacturing process, highlighting the positive impact of modern technology. Trend decrease illustrations Factory Production Increase. This image showcases a bar graph depicting rising factory production, generated by AI, superimposed on a blurred background of a bustling industrial facility. The upward trend suggests growth and efficiency in the manufacturing process, highlighting the positive impact of modern technology.
Free with trial Blue flat visualization showing bar chart and downward arrow over data grid with world map overlay. Analytics, finance, data analysis, digital, infographic, corporate, trend. Trend decrease illustrations Blue flat visualization showing bar chart and downward arrow over data grid with world map overlay
Free with trial A set of nine minimalist vector icons depicting various types of charts and graphs including bar charts, progress bars, and trend lines for data visualization and analytics. Trend decrease vectors Collection of simple black glyph icons representing business charts graphs and data analysis. A set of nine minimalist vector icons depicting various types of charts and graphs including bar charts, progress bars, and trend lines for data visualization and analytics
Free with trial Gold coins featuring the Bitcoin logo (? ) are arranged around a large, red downward-pointing arrow. This imagery symbolizes a decline in Bitcoin's market value. The coins have a metallic texture with embossed logos, while the bold red arrow signifies a decrease in prices or value. The white background emphasizes the contrast between the arrow and coins, reinforcing the theme of financial decline. Trend decrease vectors Bitcoin cryptocurrency falling downward trend with red arrow and coins. Gold coins featuring the Bitcoin logo (?) are arranged around a large, red downward-pointing arrow. This imagery symbolizes a decline in Bitcoin's market value. The coins have a metallic texture with embossed logos, while the bold red arrow signifies a decrease in prices or value. The white background emphasizes the contrast between the arrow and coins, reinforcing the theme of financial decline.
Free with trial A visual representation of a financial downturn, depicted by a bar chart with bars decreasing in height and a prominent red arrow pointing downwards, signifying a negative trend. Trend decrease illustrations Bar chart with red arrow showing decline isolated on white background. A visual representation of a financial downturn, depicted by a bar chart with bars decreasing in height and a prominent red arrow pointing downwards, signifying a negative trend
Free with trial A graphic representing a 50 percent reduction or decline, depicted by a red arrow and percentage. Trend decrease illustrations Red downward arrow indicating 50 percent decrease within a curved arc. A graphic representing a 50 percent reduction or decline, depicted by a red arrow and percentage
Free with trial A stark red arrow making a sharp turn downwards, symbolizing a decline, loss, or negative trend in business, finance, or any measurable metric. Trend decrease illustrations Red arrow pointing downwards isolated on white background. A stark red arrow making a sharp turn downwards, symbolizing a decline, loss, or negative trend in business, finance, or any measurable metric
Free with trial Global RAM Shortage Crisis Impacting Computer Hardware Market and Semiconductor Supply Chain with Declining Performance Trend. Trend decrease vectors Global RAM Shortage Crisis Impacting Computer Hardware Market and Semiconductor Supply Chain
Free with trial Illustration displays a black graph showing a downward trend indicated by a graph, arrow, and clock symbol on a stark white background, implying a sense of failure and loss. Trend decrease vectors Black Symbol Graph Downtrend with Time on White Backdrop Shows Decline. Illustration displays a black graph showing a downward trend indicated by a graph, arrow, and clock symbol on a stark white background, implying a sense of failure and loss.
Free with trial A visual representation of a declining financial trend, depicted by a bar chart with a red arrow indicating a downward movement, symbolizing loss or poor performance. Trend decrease illustrations Bar chart with downward trending red arrow isolated on white background. A visual representation of a declining financial trend, depicted by a bar chart with a red arrow indicating a downward movement, symbolizing loss or poor performance
Free with trial A man is pointing at a stock chart with a sell indicator and a downward arrow, indicating a potential downward trend in the market. Trend decrease vectors Man pointing at sell chart with downward arrow indicator. a man is pointing at a stock chart with a sell indicator and a downward arrow, indicating a potential downward trend in the market.
Free with trial Downward blue arrow, hand gesture, and declining bar graph. Ideal for business loss, negative trends, economy, failure, recession setback performance. Simple flat metaphor. Trend decrease illustrations Downward Arrow with Hand and Declining Bar Graph Representing Business Loss or Decrease. Downward blue arrow, hand gesture, and declining bar graph. Ideal for business loss, negative trends, economy, failure, recession setback performance. Simple flat metaphor
Free with trial A financial graph depicting a downward trend with a red arrow, blue bar chart, and white line graph on a dark blue grid background. Ideal for illustrating market decline, revenue loss, or negative performance in business, finance, and economic presentations. Trend decrease illustrations Declining Financial Graph Red Arrow and Bar Chart on Dark Grid Background. A financial graph depicting a downward trend with a red arrow, blue bar chart, and white line graph on a dark blue grid background. Ideal for illustrating market decline, revenue loss, or negative performance in business, finance, and economic presentations.
Free with trial Downward arrow, spiral calendar, and bar graph signifying trend analysis, scheduling, and metrics. Ideal for time management, progress tracking, productivity, data analytics planning forecasting. Trend decrease vectors Calendar, Downward Arrow, and Bar Graph Representing Time Management and Performance Analysis. Downward arrow, spiral calendar, and bar graph signifying trend analysis, scheduling, and metrics. Ideal for time management, progress tracking, productivity, data analytics planning forecasting
Free with trial A neon purple line graph shows a steep downward trend against a stark black background, symbolizing financial loss or negative performance. Trend decrease illustrations Vibrant neon purple graph illustrates sharp decline on black background. A neon purple line graph shows a steep downward trend against a stark black background, symbolizing financial loss or negative performance
Free with trial A 3D render shows a vibrant, pastel-colored bar chart displaying a decreasing trend with blue, yellow, and lavender bars on a transparent background. Trend decrease vectors Downward trendy pastel bar chart illustration on transparent background. A 3D render shows a vibrant, pastel-colored bar chart displaying a decreasing trend with blue, yellow, and lavender bars on a transparent background.
Free with trial An arrow pointing downward to indicate loss or decrease, isolated on a white background, symbolizing decline in a visual manner. Trend decrease illustrations Loss arrow down isolated on white background. An arrow pointing downward to indicate loss or decrease, isolated on a white background, symbolizing decline in a visual manner
Free with trial An arrow pointing downward to indicate loss or decrease, isolated on a white background, symbolizing decline in a visual manner. Trend decrease illustrations Loss arrow down isolated on white background. An arrow pointing downward to indicate loss or decrease, isolated on a white background, symbolizing decline in a visual manner
Free with trial An illustration of a red downward trending arrow icon in a frame is set against a soft, pastel pink backdrop. Trend decrease illustrations Downward Trend Arrow Icon on Pink Background Representing Financial Loss. An illustration of a red downward trending arrow icon in a frame is set against a soft, pastel pink backdrop.
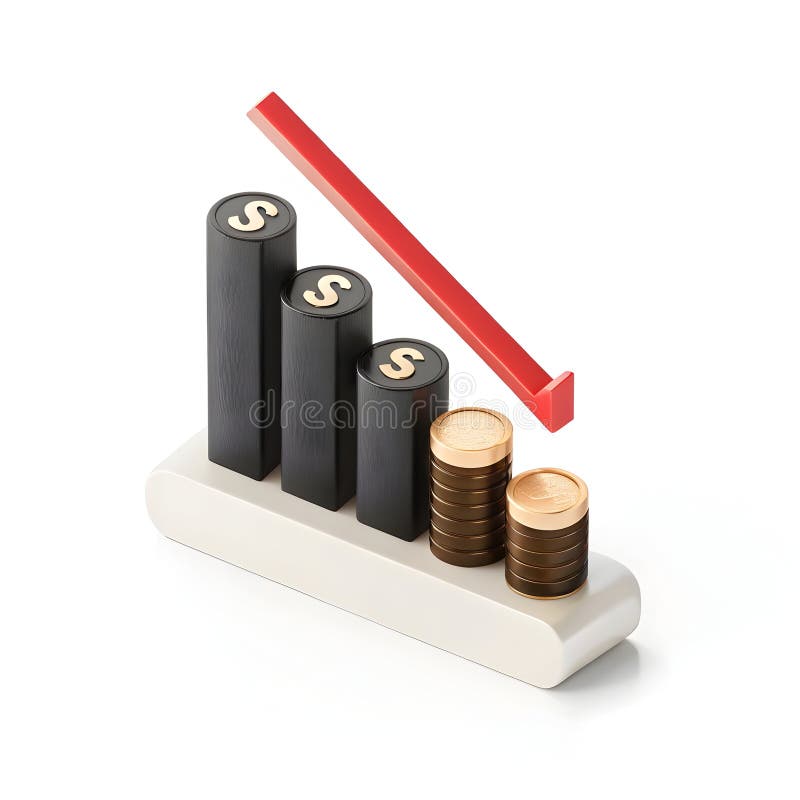
Free with trial A 3D illustration depicts a financial graph with a downward trend. Three black bars, each topped with a gold dollar sign, decrease in height from left to right. To the right of the bars, two stacks of gold coins are shown, also decreasing in height. A thick red arrow points downwards, crossing over the bars and coins, indicating a decline. The entire composition rests on a white base and is set. Trend decrease illustrations Falling financial graph with stacked coins finance. A 3D illustration depicts a financial graph with a downward trend. Three black bars, each topped with a gold dollar sign, decrease in height from left to right. To the right of the bars, two stacks of gold coins are shown, also decreasing in height. A thick red arrow points downwards, crossing over the bars and coins, indicating a decline. The entire composition rests on a white base and is set
Free with trial A black bar chart showing a downward trend with an arrow on a white background. Clear details and vibrant colo. Trend decrease illustrations Black downward trending bar chart with arrow on white background graph. A black bar chart showing a downward trend with an arrow on a white background. Clear details and vibrant colo
Free with trial A bold, red 3D arrow points downward, symbolizing decline or decrease. The arrow features a sharp, zigzag design, conveying movement and direction. Its glossy surface reflects light, enhancing its vivid appearance. The background is a clean, minimalistic white, emphasizing the arrow's striking color and form. Trend decrease vectors Red 3d arrow pointing downward against black background symbolizing decline. A bold, red 3D arrow points downward, symbolizing decline or decrease. The arrow features a sharp, zigzag design, conveying movement and direction. Its glossy surface reflects light, enhancing its vivid appearance. The background is a clean, minimalistic white, emphasizing the arrow's striking color and form.
Free with trial A stark red bar graph illustrates a sharp downward trend with a prominent arrow, visually representing financial decline, economic recession, or business failure. Trend decrease illustrations Red bar graph with downward arrow isolated on white background. A stark red bar graph illustrates a sharp downward trend with a prominent arrow, visually representing financial decline, economic recession, or business failure
Free with trial A businessman in a suit points to a check mark icon and declining graph illustrating cost reduction The visual presentation emphasizes decreasing costs to improve profits with a money bag symbolizing the potential financial gains from effective strategies and successful implementation. Trend decrease illustrations Cost reduction strategy presented by businessman demonstrating declining trend to increase profits. A businessman in a suit points to a check mark icon and declining graph illustrating cost reduction The visual presentation emphasizes decreasing costs to improve profits with a money bag symbolizing the potential financial gains from effective strategies and successful implementation
Free with trial Downward line graph with sad face reflecting poor performance, folder with binary data, and cloud element. Ideal for finance, analytics, failure, statistics, digital storage, emotions simple flat. Trend decrease illustrations Negative trend in data analysis with declining graph, sad face, and digital file management. Downward line graph with sad face reflecting poor performance, folder with binary data, and cloud element. Ideal for finance, analytics, failure, statistics, digital storage, emotions simple flat
Free with trial A sharp, transparent glass arrow pointing downwards, surrounded by glistening water droplets, signifying a downward trend or decline in a conceptual manner. Trend decrease illustrations Transparent arrow pointing downwards, isolated on white background background copy space. A sharp, transparent glass arrow pointing downwards, surrounded by glistening water droplets, signifying a downward trend or decline in a conceptual manner.
Free with trial A red grid background displays a financial chart with alternating green and white candlesticks and a prominent white arrow pointing downwards. Trend decrease illustrations Red financial chart with green and white candlesticks showing downward trend. A red grid background displays a financial chart with alternating green and white candlesticks and a prominent white arrow pointing downwards
Free with trial Candlestick charts with red and green bars display a stock market or forex trading pattern. Each candlestick represents data for a specific time period, showing opening, closing, high, and low values. Red indicates a price decrease, while green signifies an increase. The chart analyzes investment trends and is used for financial decisions in business and trading. The background is dark blue, enhancing the visibility of the vibrant candlestick colors. Trend decrease illustrations Stock market chart forex trading candlestick pattern investment finance business graph analysis data trend. Candlestick charts with red and green bars display a stock market or forex trading pattern. Each candlestick represents data for a specific time period, showing opening, closing, high, and low values. Red indicates a price decrease, while green signifies an increase. The chart analyzes investment trends and is used for financial decisions in business and trading. The background is dark blue, enhancing the visibility of the vibrant candlestick colors.
Free with trial Sad face beside declining line graph and bar chart, symbolizing setbacks. Ideal for finance, business, economy, loss, analytics, crisis performance. Simple flat metaphor. Trend decrease vectors Negative Trend Line and Declining Bar Chart Representing Business Loss or Financial Downturn. Sad face beside declining line graph and bar chart, symbolizing setbacks. Ideal for finance, business, economy, loss, analytics, crisis performance. Simple flat metaphor
Free with trial A dramatic business concept image showing a person in a business suit holding a glowing red line graph that is trending downwards with an arrow. The background is a blurred view of stock market ticker screens, clearly linking the downward trend to a financial market crash, recession, or investment loss. Generative AI. Trend decrease illustrations A person in a suit holding a plunging red arrow graph in front of stock market screens. A dramatic business concept image showing a person in a business suit holding a glowing red line graph that is trending downwards with an arrow. The background is a blurred view of stock market ticker screens, clearly linking the downward trend to a financial market crash, recession, or investment loss. Generative AI.
Free with trial Three red 3D arrows point downward, each featuring a white percentage sign (%) on a flat white surface. The design conveys a theme of decrease or reduction, often associated with discounts or financial downturns. The arrows are evenly spaced, and their bold colors create a striking visual contrast. Trend decrease illustrations Three red arrows with percentage signs pointing downwards on a black background. Three red 3D arrows point downward, each featuring a white percentage sign (%) on a flat white surface. The design conveys a theme of decrease or reduction, often associated with discounts or financial downturns. The arrows are evenly spaced, and their bold colors create a striking visual contrast.
Free with trial A red arrow pointing downward is placed above many gold bitcoin coins, signifying a decrease in cryptocurrency value. Trend decrease illustrations Red Arrow Points Down Over Numerous Gold Bitcoin Coins, Indicating Market Decline in Cryptocurrency. A red arrow pointing downward is placed above many gold bitcoin coins, signifying a decrease in cryptocurrency value
Free with trial This image shows two bar graphs. One shows an upward trend with an arrow pointing up. The other shows a downward trend with an arrow pointing down. Black and white. Trend decrease illustrations Black and white illustration showing upward and downward trending bar graphs with arrows pointing up down. This image shows two bar graphs. One shows an upward trend with an arrow pointing up. The other shows a downward trend with an arrow pointing down. Black and white.
Free with trial A visual representation of a recession or economic decline, with a stack of clothing items falling downwards, accompanied by a prominent red arrow indicating a downward trend. Trend decrease illustrations Economic downturn symbolized by falling pile of clothes and red downward arrow. A visual representation of a recession or economic decline, with a stack of clothing items falling downwards, accompanied by a prominent red arrow indicating a downward trend
Free with trial This chart depicts a significant downward trend in stock value over a period. The red line graphically represents the declining prices, indicating a bearish market or a stock facing substantial losses. Trend decrease illustrations Stock market downturn visualized red line chart showing price decline over time. This chart depicts a significant downward trend in stock value over a period. The red line graphically represents the declining prices, indicating a bearish market or a stock facing substantial losses
Free with trial A striking red arrow pointing sharply downward against a clean white background, symbolizing financial downturns, market crashes, and economic recession. The image conveys concepts of loss, decrease, and negative trends in business and finance. Trend decrease illustrations Red Arrow Pointing Downward on White Background Representing Financial Decline and Economic Recession. A striking red arrow pointing sharply downward against a clean white background, symbolizing financial downturns, market crashes, and economic recession. The image conveys concepts of loss, decrease, and negative trends in business and finance
Free with trial This image features two minimalist icons representing financial or data trends. The left icon is a white line graph with circular data points and directional arrows, set against a solid black shield shape. The right icon presents the same line graph and data points within a black outline of a shield, on a white background. Both icons depict fluctuating data, with one showing a downward trend and the other an upward trend, symbolizing market volatility, analysis, and security. Trend decrease illustrations Line Graph Icon with Shield Symbol - Upward and Downward Trends. This image features two minimalist icons representing financial or data trends. The left icon is a white line graph with circular data points and directional arrows, set against a solid black shield shape. The right icon presents the same line graph and data points within a black outline of a shield, on a white background. Both icons depict fluctuating data, with one showing a downward trend and the other an upward trend, symbolizing market volatility, analysis, and security.
Free with trial A graphic illustrating the concept of home value trends. A green arrow pointing upwards represents growth, while a red arrow pointing downwards signifies decline. A family icon is placed above the arrows. Trend decrease illustrations Family Home Value: Upward Trend, Downward Trend, Financial Concepts. A graphic illustrating the concept of home value trends. A green arrow pointing upwards represents growth, while a red arrow pointing downwards signifies decline. A family icon is placed above the arrows
Free with trial A stock market chart with a downward trend and shattered glass evokes a sense of financial loss and failure, and is used to illustrate economic downturns or market crashes. Trend decrease illustrations Financial Downfall Stock Market Chart with Shattered Glass. A stock market chart with a downward trend and shattered glass evokes a sense of financial loss and failure, and is used to illustrate economic downturns or market crashes
Free with trial A stylized illustration of a downward arrow pointing towards a dollar sign inside a circular frame symbolizing financial decline or decrease with a clean minimalistic design perfect for financial analysis and economic topics. Trend decrease illustrations Downward Arrow with Dollar Sign in Circular Frame Financial Concept Illustration. A stylized illustration of a downward arrow pointing towards a dollar sign inside a circular frame symbolizing financial decline or decrease with a clean minimalistic design perfect for financial analysis and economic topics
Free with trial A visual representation of a declining stock market trend, depicted by a bold red arrow descending across a financial graph, symbolizing economic downturn and investment loss. Trend decrease illustrations A red arrow pointing downwards on a stock market graph, isolated on white background. A visual representation of a declining stock market trend, depicted by a bold red arrow descending across a financial graph, symbolizing economic downturn and investment loss
Free with trial A graph shows a downward trend. Green bars diminish in height along a timeline. A red arrow underscores the downward movement of the data on the timeline. Trend decrease illustrations Decreasing graph showing green bars plunging downward with a red arrow indication. A graph shows a downward trend. Green bars diminish in height along a timeline. A red arrow underscores the downward movement of the data on the timeline
Free with trial A striking red arrow curves downwards, symbolizing a financial downturn economic recession or declining performance. This graphic conveys a clear message of loss, regression, or negative trends. Trend decrease illustrations Red downward arrow symbol showing decline and negative trend in business and finance. A striking red arrow curves downwards, symbolizing a financial downturn economic recession or declining performance. This graphic conveys a clear message of loss, regression, or negative trends
Free with trial A minimalist cartoon-style illustration on a white background depicts a green horseshoe-shaped symbol on the left with two arrows pointing toward it, one green arrow entering from the left and a larger red arrow exiting to the right, pointing downward to signify a decreasing trend in cancer diagnoses, while a second red arrow points upward, creating a contrast that visually communicates changing. Trend decrease illustrations Cancer diagnosis decline concept with arrows and horseshoe shape. A minimalist cartoon-style illustration on a white background depicts a green horseshoe-shaped symbol on the left with two arrows pointing toward it, one green arrow entering from the left and a larger red arrow exiting to the right, pointing downward to signify a decreasing trend in cancer diagnoses, while a second red arrow points upward, creating a contrast that visually communicates changing
Free with trial This image shows a colorful 3D bar graph representing growth or progress. The bars increase in height, then decrease slightly before another sharp increase, indicating fluctuations in data. The wooden background adds a rustic and visually appealing contrast. Trend decrease illustrations Colorful Bar Graph on Wooden Background. This image shows a colorful 3D bar graph representing growth or progress. The bars increase in height, then decrease slightly before another sharp increase, indicating fluctuations in data. The wooden background adds a rustic and visually appealing contrast.
Free with trial A bold, jagged black arrow descends diagonally, indicating a downward trend or decline, isolated on a clean white background. Trend decrease illustrations A jagged black arrow pointing downward isolated on white background. A bold, jagged black arrow descends diagonally, indicating a downward trend or decline, isolated on a clean white background
Free with trial Gold coins stacked with a Bitcoin logo and a downward red arrow visually represent a decrease in cryptocurrency market value and potential financial loss. Trend decrease illustrations Bitcoin Price Drop: Gold Coins & Red Arrow Symbolize Crypto Decline. Gold coins stacked with a Bitcoin logo and a downward red arrow visually represent a decrease in cryptocurrency market value and potential financial loss
Free with trial This graph illustrates the fluctuation of interest rates over the last 12 months, ranging from 3. 5% to 7%. The line chart provides a visual representation of the trend, allowing for easy analysis and understanding of the data. The graph is a valuable resource for businesses, investors, and individuals looking to stay informed about the current state of the economy and make informed decisions about their financial planning and strategy. Trend decrease illustrations A graph showing interest rate fluctuation over the last 12 months. This graph illustrates the fluctuation of interest rates over the last 12 months, ranging from. This graph illustrates the fluctuation of interest rates over the last 12 months, ranging from 3.5% to 7%. The line chart provides a visual representation of the trend, allowing for easy analysis and understanding of the data. The graph is a valuable resource for businesses, investors, and individuals looking to stay informed about the current state of the economy and make informed decisions about their financial planning and strategy.
Free with trial A financial graph depicting a decline, featuring vibrant red and yellow candlesticks on a sleek digital background, conveying market downturns. Trend decrease illustrations Digital stock market chart showing a downward trend with red and yellow candlesticks. A financial graph depicting a decline, featuring vibrant red and yellow candlesticks on a sleek digital background, conveying market downturns
Free with trial Turquoise 3D arrow pointing down on a podium for business loss, financial decrease, and economic crisis concepts. Trend decrease illustrations 3D Low Poly Downward Arrow on Minimal Podium. Turquoise 3D arrow pointing down on a podium for business loss, financial decrease, and economic crisis concepts.
Free with trial A vintage green gas pump with a red and white sign stands on a concrete floor against a black wall, while a large screen on the right displays a stock market chart with red, yellow, and green lines showing a downward trend, creating a mood of decay and economic decline in a dark, atmospheric setting. Trend decrease illustrations Vintage gas pump with stock market chart on screen in dark background. A vintage green gas pump with a red and white sign stands on a concrete floor against a black wall, while a large screen on the right displays a stock market chart with red, yellow, and green lines showing a downward trend, creating a mood of decay and economic decline in a dark, atmospheric setting
Free with trial 3D render showcasing descending statistical bar graph. The bars are colored differently: purple, blue, and yellow. This graphic represents statistical data trend decreasing. Trend decrease vectors Colorful statistical bar graph rendering showing decrease on transparent background. 3D render showcasing descending statistical bar graph. The bars are colored differently: purple, blue, and yellow. This graphic represents statistical data trend decreasing.
Free with trial A flat, cartoon-style line graph on a white grid background shows a green upward-pointing arrow representing growth and a red downward-pointing arrow indicating decline, with a red dollar sign placed atop the green arrow to symbolize financial gain, illustrating contrasting economic trends in a simplified, visually engaging manner ideal for business, finance, and investment-related content that. Trend decrease illustrations Upward and downward financial trend with green and red arrows on grid graph. A flat, cartoon-style line graph on a white grid background shows a green upward-pointing arrow representing growth and a red downward-pointing arrow indicating decline, with a red dollar sign placed atop the green arrow to symbolize financial gain, illustrating contrasting economic trends in a simplified, visually engaging manner ideal for business, finance, and investment-related content that
Free with trial A clean, minimalist 3D render depicts a series of white arrows of varying heights arranged in a graph-like formation. The tallest arrows, on the left, are illuminated with a warm, orange glow, symbolizing growth, success, and positive trends. The arrows decrease in size towards the right, suggesting a progression or trend line. The reflective surface and bright, airy background create a modern and optimistic feel, ideal for business, finance, and technology-related concepts. Trend decrease illustrations Rising Arrows Graph. A clean, minimalist 3D render depicts a series of white arrows of varying heights arranged in a graph-like formation. The tallest arrows, on the left, are illuminated with a warm, orange glow, symbolizing growth, success, and positive trends. The arrows decrease in size towards the right, suggesting a progression or trend line. The reflective surface and bright, airy background create a modern and optimistic feel, ideal for business, finance, and technology-related concepts.
Free with trial A conceptual vector illustration depicting the duality of business performance. On a modern teal background, two reports are shown side-by-side. One features a rising red graph symbolizing growth, profit, and success, while the other displays a descending graph representing decline, loss, and failure. This flat design graphic is ideal for financial analysis, market trend comparisons, business presentations, and infographics illustrating opposite outcomes or strategic choices. The long shadow effect adds a contemporary feel to the design. Trend decrease vectors Growth and Decline Business Charts Comparison. A conceptual vector illustration depicting the duality of business performance. On a modern teal background, two reports are shown side-by-side. One features a rising red graph symbolizing growth, profit, and success, while the other displays a descending graph representing decline, loss, and failure. This flat design graphic is ideal for financial analysis, market trend comparisons, business presentations, and infographics illustrating opposite outcomes or strategic choices. The long shadow effect adds a contemporary feel to the design.
Free with trial A gold alarm clock with a dollar sign sits on a table in front of a pink financial chart showing a downward trend This illustrates the concept of time and its value in financial matters Coins are scattered nearby adding to the money theme. Trend decrease illustrations Time is Money Alarm Clock Coins Financial Chart. A gold alarm clock with a dollar sign sits on a table in front of a pink financial chart showing a downward trend This illustrates the concept of time and its value in financial matters Coins are scattered nearby adding to the money theme
Free with trial A vibrant red, three-dimensional arrow is depicted on a plain white background. The arrow begins at the top with a curved shaft, looping over before straightening out into a pointed arrowhead that clearly indicates a downward direction. The glossy finish of the red color creates highlights, giving it a sleek and modern appearance. This graphic element symbolizes movement downwards, decrease, or a. Trend decrease illustrations A glossy red arrow curves downward to indicate a direction or decline isolated on white background. A vibrant red, three-dimensional arrow is depicted on a plain white background. The arrow begins at the top with a curved shaft, looping over before straightening out into a pointed arrowhead that clearly indicates a downward direction. The glossy finish of the red color creates highlights, giving it a sleek and modern appearance. This graphic element symbolizes movement downwards, decrease, or a
Free with trial A dynamic 3D rendering of a bar graph, depicting a downward trend with vibrant red bars and a prominent white arrow pointing downwards. The scene is set against a dark, subtly textured background, creating a dramatic visual contrast. This image effectively symbolizes decline, loss, negative financial trends, or challenges in business. Trend decrease illustrations 3D Bar Graph with Declining Red Bars and White Arrow Ai Generated. A dynamic 3D rendering of a bar graph, depicting a downward trend with vibrant red bars and a prominent white arrow pointing downwards. The scene is set against a dark, subtly textured background, creating a dramatic visual contrast. This image effectively symbolizes decline, loss, negative financial trends, or challenges in business.
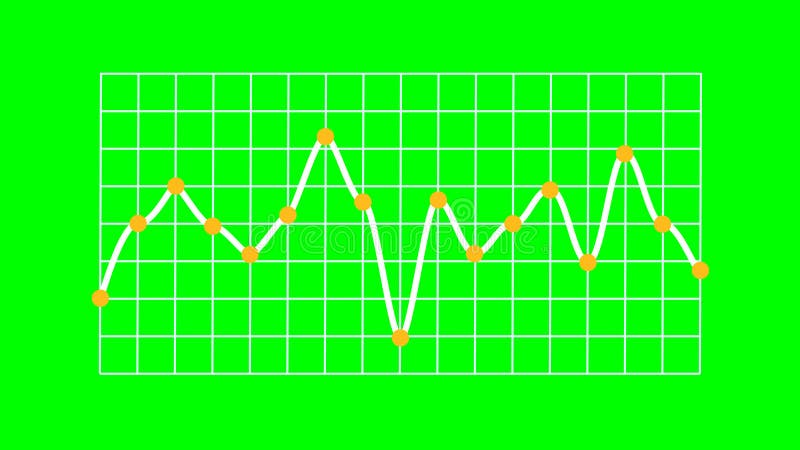
Free with trial Rendered line graph showing a single white line indicating data trends with distinct fluctuations. Yellow marker points animate vertically from the X-axis, and each plotted value features an orange circular dot. The white line runs over a structured white grid on a bright green screen background, enabling chroma keying. No axis values or units are present, emphasizing visual representation of abstract data and business trends. Trend decrease illustrations Business Trend Line Graph Showing Trading on Green Screen. Rendered line graph showing a single white line indicating data trends with distinct fluctuations. Yellow marker points animate vertically from the X-axis, and each plotted value features an orange circular dot. The white line runs over a structured white grid on a bright green screen background, enabling chroma keying. No axis values or units are present, emphasizing visual representation of abstract data and business trends.
Free with trial This image depicts a financial downturn with a graphic arrow indicating a decline in value. Trend decrease illustrations Downward trend represented by a blue arrow breaking through the floor. This image depicts a financial downturn with a graphic arrow indicating a decline in value
Free with trial Hand holding tablet with red downward trend graph, digital style on dark office background, concept of financial crisis and market collapse. Trend decrease illustrations Businessman holding tablet with falling stock market graph and red arrows representing financial crisis and global economic. Hand holding tablet with red downward trend graph, digital style on dark office background, concept of financial crisis and market collapse
Free with trial Business graph data in a bar chart showing increase and decrease with blue line illustration on plain background. Trend decrease vectors Business graph data in a bar chart showing increase and decrease with blue line illustration on plain background
Free with trial Isolated on transparent background downward arrow made of scattered red blocks. Trend decrease illustrations Graphic illustration showing downward trend with falling blocks design. Isolated on transparent background downward arrow made of scattered red blocks
Free with trial This image illustrates a comparison between an increasing trend and a decreasing trend using bar graphs and arrows. Trend decrease illustrations Comparison of increasing and decreasing trends. This image illustrates a comparison between an increasing trend and a decreasing trend using bar graphs and arrows
Free with trial This image represents a financial crisis with a downward trend and a broken surface. Trend decrease illustrations Economic downturn concept with a red graph and a blue arrow pointing down. This image represents a financial crisis with a downward trend and a broken surface