Free with trial Set of financial arrows up and down. Green and red arrows. Increase and decrease. Vector 10 EPS. Trend decrease illustrations Set of financial arrows up and down. Green and red arrows.
Free with trial The image shows a city skyline with a red downward trend line indicating a financial crisis. Vector illustration design using ai tool. Trend decrease vectors Economy crash coming. The image shows a city skyline with a red downward trend line indicating a financial crisis. Vector illustration design using ai tool.
Free with trial Flat bullish vs bearish upward downward market trend background vector. Trend decrease illustrations Flat bullish vs bearish upward downward market trend background
Free with trial Isometric illustration of a chart board displaying upward and downward trend lines. Trend decrease vectors Isometric graph chart with trends on display. Isometric illustration of a chart board displaying upward and downward trend lines
Free with trial The image illustrates the concept of deflation, showing a downward trend in the overall price level of goods and services in the economy , vintage charm. Trend decrease illustrations Economic downturn. Deflation is a decrease in the general price level in an economy. The image illustrates the concept of deflation, showing a downward trend in the overall price level of goods and services in the economy , vintage charm
Free with trial 3D isometric business chart showing a downward trend with a red arrow and colorful bar graphs on a grid background, isolated on white. Trend decrease illustrations 3D isometric business chart showing a downward trend with a red arrow and colorful bar graphs on a grid background, isolated on
Free with trial The concept of a decrease or increase in the bitcoin price after halving. Trend decrease vectors Bitcoin price after Halving event. Vector illustration. The concept of a decrease or increase in the bitcoin price after halving.
Free with trial Bar chart showing decreasing bars, with silhouetted heads and a downward arrow. Represents decline, loss, negative trend, recession, or drop in performance. Useful for financial reports, business analysis, or social trends. Trend decrease illustrations Downward trending bar chart with silhouette heads and arrow signifying decline in economy or popularity vector graphic. Bar chart showing decreasing bars, with silhouetted heads and a downward arrow. Represents decline, loss, negative trend, recession, or drop in performance. Useful for financial reports, business analysis, or social trends
Free with trial Minus 5 percent decrease red arrow. Plus 10 percent increase green arrow. Economic indicators. Financial statistics. Business performance. Market fluctuations shown. Trend decrease illustrations Red down arrow with minus 5 percent and green up arrow with plus 10 percent on white background. Minus 5 percent decrease red arrow. Plus 10 percent increase green arrow. Economic indicators. Financial statistics. Business performance. Market fluctuations shown
Free with trial A conceptual illustration featuring a red downward trend arrow pointing over stacks of gold coins that decrease in height to symbolize financial crisis, economic recession, market loss, and decreasing business profits or investment value. Trend decrease vectors A red downward arrow showing a financial downturn with stacks of gold coins decreasing in value to represent economic loss. A conceptual illustration featuring a. A conceptual illustration featuring a red downward trend arrow pointing over stacks of gold coins that decrease in height to symbolize financial crisis, economic recession, market loss, and decreasing business profits or investment value
Free with trial A detailed data visualization illustrating market trends over time. The infographic combines a line chart, which shows fluctuating values and percentages, with a bar chart representing data for specific time intervals. The line chart highlights key data points, such as peaks annotated with values like '1. 24%' and '500K'. The x-axis represents a timeline from January to March, while the y-axis. Trend decrease illustrations A modern market trend analysis visualization combining a bar and line chart for financial data isolated on white background. A detailed data visualization illustrating market trends over time. The infographic combines a line chart, which shows fluctuating values and percentages, with a bar chart representing data for specific time intervals. The line chart highlights key data points, such as peaks annotated with values like '1.24%' and '500K'. The x-axis represents a timeline from January to March, while the y-axis
Free with trial Visualizing the current economic downturn through a stark, red background flat lay, this image showcases a downward trend represented by wooden blocks. The falling blocks symbolize the decline in key market indicators and highlight the instability and uncertainty impacting global economies. This analytical approach provides insights into the factors driving market crashes and recessions, offering. Trend decrease illustrations Analyzing Economic Downturn Impacts Market Crash Predictions Investment Strategies Revealed Through Declining Wooden. Visualizing the current economic downturn through a stark, red background flat lay, this image showcases a downward trend represented by wooden blocks. The falling blocks symbolize the decline in key market indicators and highlight the instability and uncertainty impacting global economies. This analytical approach provides insights into the factors driving market crashes and recessions, offering
Free with trial Businessman Hunting Pink Piggy Bank with Red Downward Trend Arrow Spear Representing Financial Loss Economic Crisis Investment Risk Inflation and Negative Savings Performance. Trend decrease vectors Businessman Hunting Pink Piggy Bank with Red Downward Trend Arrow Spear Representing Financial Loss Economic Crisis Investment
Free with trial This compelling long exposure photograph captures a stark visual representation of economic downturn. A substantial pile of euro coins, meticulously arranged, is juxtaposed with a dramatic red, descending arrow. The long exposure technique subtly blurs the coins, adding an ethereal quality to the image, while simultaneously emphasizing the relentless, downward trend. This powerful visual metaphor. Trend decrease illustrations Euro Coin Pile Shows Mounting Financial Crisis A Long Exposure Depicts the Declining Value of Currency Highlighting. This compelling long exposure photograph captures a stark visual representation of economic downturn. A substantial pile of euro coins, meticulously arranged, is juxtaposed with a dramatic red, descending arrow. The long exposure technique subtly blurs the coins, adding an ethereal quality to the image, while simultaneously emphasizing the relentless, downward trend. This powerful visual metaphor
Free with trial A three-dimensional chart displaying colorful lines and coin representations illustrates trends in data, highlighting key financial insights and fluctuations over time. Trend decrease illustrations Trend Analysis with Colorful Graph Lines and Currency Coins Representing Data Points on a Three-Dimensional Chart. A three-dimensional chart displaying colorful lines and coin representations illustrates trends in data, highlighting key financial insights and fluctuations over time
Free with trial This image depicts two contrasting scenarios of the housing market, one showing a positive upward trend and the other a negative downward trend. Trend decrease illustrations Visual representation of real estate market trends showing both upward and downward fluctuations in housing prices and investment. This image depicts two contrasting scenarios of the housing market, one showing a positive upward trend and the other a negative downward trend
Free with trial Handmade origami style 3d chart showing falling trend. sharp pointed white paper sculpture casting shadows on flat surface. minimalist conceptual photography. economic crisis representation. business failure metaphor. clean architectural paper design. Trend decrease illustrations Creative paper art representing white downward arrow graph on light blue background symbolizing financial decline or recession. Handmade origami style 3d chart showing falling trend. sharp pointed white paper sculpture casting shadows on flat surface. minimalist conceptual photography. economic crisis representation. business failure metaphor. clean architectural paper design
Free with trial Trend template sketch design 3D photo collage of trade business goal trader success hand hold calculator young lady sit beanbag write note. Trend decrease illustrations Trend template sketch design 3D photo collage of trade business goal trader success hand hold calculator young lady sit
Free with trial Decline Visualization Dark Blue Background, Vibrant Pink Zigzags, and Yellow Bars Shown as Decreasing ThreeDimensional Cubes with Arrows Indicating the Trend by SD. Trend decrease illustrations Decline Visualization Dark Blue Background, Vibrant Pink Zigzags, and Yellow Bars Shown as Decreasing ThreeDimensional Cubes with
Free with trial A striking image of gold nuggets showcasing wealth and investment potential against a dark backdrop, featuring a financial trend line representing economic growth. Trend decrease illustrations Gold nuggets on dark surface with financial trend line in background symbolizing wealth, investment, and economic growth concepts. A striking image of gold nuggets showcasing wealth and investment potential against a dark backdrop, featuring a financial trend line representing economic growth
Free with trial Metallic financial fluctuation concept with dollar symbol, green arrow pointing up indicating growth, and red arrow pointing down for decrease. Market trends and investment. Economy changes. Trend decrease illustrations Metallic Dollar Sign With Green Up Arrow And Red Down Arrow Representing Financial Fluctuation. Metallic financial fluctuation concept with dollar symbol, green arrow pointing up indicating growth, and red arrow pointing down for decrease. Market trends and investment. Economy changes
Free with trial This monochromatic bar graph illustrates data trends over time, showcasing variations in performance and metrics, ideal for presentations and business reports. Trend decrease illustrations Black and White Bar Graph with Trend Line Showing Data Variations Over Time for Analysis and Reporting Purposes in Business. This monochromatic bar graph illustrates data trends over time, showcasing variations in performance and metrics, ideal for presentations and business reports
Free with trial Financial arrows up and down. Green and red arrow. Increase and decrease. Vector 10 EPS. Trend decrease illustrations Financial arrows up and down. Green and red arrow.
Free with trial This impactful image features a large, bold red downward arrow on a pristine white background, perfect for conveying a decrease or decline in data. Ideal for use in presentations, reports, and graphs, this professional design element is a clear and effective visual aid. The simplified design and sharp focus on the arrow ensure maximum visual impact and clarity. Whether illustrating a shrinking. Trend decrease illustrations Powerful Red Downward Arrow Graphic A Clean Professional Visual Aid for Presentations Reports and Graphs. This impactful image features a large, bold red downward arrow on a pristine white background, perfect for conveying a decrease or decline in data. Ideal for use in presentations, reports, and graphs, this professional design element is a clear and effective visual aid. The simplified design and sharp focus on the arrow ensure maximum visual impact and clarity. Whether illustrating a shrinking
Free with trial Gold Bitcoin coins and a downward arrow indicate a decrease in value. Ideal for finance, cryptocurrency, investment, or economic concept designs. Trend decrease illustrations Gold Bitcoin coins and a downward arrow indicate a decrease in value.
Free with trial Vector illustration stacked coins and arrow trending down, decreasing statistical graphic concept. Trend decrease vectors Vector illustration stack coin arrow downup trend. vector illustration stacked coins and arrow trending down, decreasing statistical graphic concept
Free with trial This abstract financial stock market trading chart with a gold arrow downtrend on a blue background conveys the concept of market volatility and uncertainty. The downward trend of the gold arrow symbolizes a decrease in stock prices or economic instability. The blue background may represent calmness or trust in the financial system despite the fluctuations. This image captures the essence of the dynamic nature of the stock market and the importance of monitoring trends for successful trading strategies. Trend decrease illustrations Abstract Financial Stock Market Trading Chart with Gold Arrow Downtrend on Blue Background. This abstract financial stock market trading chart with a gold arrow downtrend on a blue background conveys the concept of market volatility and uncertainty. The downward trend of the gold arrow symbolizes a decrease in stock prices or economic instability. The blue background may represent calmness or trust in the financial system despite the fluctuations. This image captures the essence of the dynamic nature of the stock market and the importance of monitoring trends for successful trading strategies.
Free with trial Three dimensional bright green arrows pointing downwards with white percentage symbols symbolizing a reduction or sale isolated on a transparent background. Trend decrease vectors Three bright green downward pointing arrows with percentage symbols indicating a decrease or discount isolated on transparent. Three dimensional bright green arrows pointing downwards with white percentage symbols symbolizing a reduction or sale isolated on a transparent background
Free with trial A high-quality, hand-drawn vector graphic of a simple red arrow pointing downwards. This versatile image is ideal for various applications, including presentations, websites, social media posts, and infographics. The clean and minimalist style ensures seamless integration into any design project. Perfect for visually representing concepts such as decrease, decline, negative trends, or reduction. Download this royalty-free vector today!. Trend decrease illustrations Hand-drawn Red Down Arrow: Simple, Clean Vector Graphic for Presentations, Websites, and Social Media. Perfect for. A high-quality, hand-drawn vector graphic of a simple red arrow pointing downwards. This versatile image is ideal for various applications, including presentations, websites, social media posts, and infographics. The clean and minimalist style ensures seamless integration into any design project. Perfect for visually representing concepts such as decrease, decline, negative trends, or reduction. Download this royalty-free vector today!
Free with trial This high-quality vector graphic features a simple, hand-drawn red arrow pointing downwards. It's perfect for illustrating decline, decrease, or negative trends in presentations, reports, websites, and infographics. The clean and minimalist style ensures versatility across various design projects. Easily scalable and editable, this vector graphic is a valuable addition to any designer's toolkit. Its simple design makes it suitable for a wide range of applications and audiences. Trend decrease illustrations Hand-Drawn Red Down Arrow: Simple, Clean, and Versatile Vector Graphic for Presentations, Websites, and More. Perfect. This high-quality vector graphic features a simple, hand-drawn red arrow pointing downwards. It's perfect for illustrating decline, decrease, or negative trends in presentations, reports, websites, and infographics. The clean and minimalist style ensures versatility across various design projects. Easily scalable and editable, this vector graphic is a valuable addition to any designer's toolkit. Its simple design makes it suitable for a wide range of applications and audiences.
Free with trial The red graph slopes downwards against a black backdrop, portraying a declining trend. Trend decrease illustrations In a black backdrop, a red graph is visibly descending. The red graph slopes downwards against a black backdrop, portraying a declining trend
Free with trial Three red arrows with percentage signs pointing down, symbolizing a financial decline or reduction, isolated on a transparent background. Trend decrease vectors Three bright red downward pointing arrows with white percentage symbols signifying a decrease in value or interest rates isolated. Three red arrows with percentage signs pointing down, symbolizing a financial decline or reduction, isolated on a transparent background
Free with trial Stock market trading technical analysis bar chart fall banner. Business failure candlestick graph exchange down trend. Economic downturn and investment loss graph. Trader financial index crash. Eps. Trend decrease vectors Stock market trading technical analysis bar chart fall banner. Business failure candlestick graph exchange down trend
Free with trial Red Toy Houses on Financial Documents with a Falling Trend Showing Real Estate Market Decline, Generated by AI. Trend decrease illustrations Red Toy Houses on Financial Documents with a Falling Trend Showing Real Estate Market Decline
Free with trial Stock market charts depicting a downward trend, symbolizing a financial crisis, set on a dark, abstract background, illustrating the concept of economic decline. Trend decrease illustrations Stock market charts depicting a downward trend, symbolizing a financial crisis, set on a dark, abstract background, illustrating
Free with trial 3D rendered graph showing decreasing stock prices against a circuit board background. Illustrates market downturn in technology sector. Trend decrease illustrations Market Trend Analysis: 3D Render of Decreasing Stock Prices and Circuit Board Background Illustrating Technological Market. 3D rendered graph showing decreasing stock prices against a circuit board background. Illustrates market downturn in technology sector
Free with trial Decrease icon or logo isolated sign symbol vector illustration - Collection of high quality black style vector icons, seles chart icon isolated sign symbol vector illustration - Collection of high quality. Trend decrease vectors Decrease icon or logo isolated sign symbol vector illustration
Free with trial Composite trend artwork sketch image photo collage of trader business loss crisis inflation bank credit coins young shocked lady staring. Trend decrease illustrations Composite trend artwork sketch image photo collage of trader business loss crisis inflation bank credit coins young
Free with trial Magnifying glass focuses on declining spreadsheet numbers during economic downturn. Financial data shows significant drop in figures. Business analyst examines, alarming trend. Trend decrease illustrations Magnifying glass focuses on declining spreadsheet numbers during economic downturn. Financial data shows significant drop in
Free with trial Stock market trading technical analysis bar chart fall banner. Business candlestick graph exchange down trend. Economic downturn and investment loss graph. Trader financial index crash and bankruptcy. Trend decrease illustrations Stock market trading technical analysis bar chart fall banner. Business candlestick graph exchange down trend. Economy. Stock market trading technical analysis bar chart fall banner. Business candlestick graph exchange down trend. Economic downturn and investment loss graph. Trader financial index crash and bankruptcy
Free with trial Stock market trading technical analysis bar chart fall banner. Business candlestick graph exchange down trend. Economic downturn and investment loss graph. Trader financial index crash and bankruptcy. Trend decrease vectors Stock market trading technical analysis bar chart fall banner. Business candlestick graph exchange down trend. Economy. Stock market trading technical analysis bar chart fall banner. Business candlestick graph exchange down trend. Economic downturn and investment loss graph. Trader financial index crash and bankruptcy
Free with trial A wooden arrow pointing down is on top of a stack of wooden blocks. The arrow represents a downward trend or a decrease in something generated by AI. Trend decrease vectors A wooden arrow pointing down is on top of a stack of wooden blocks generated by AI. A wooden arrow pointing down is on top of a stack of wooden blocks. The arrow represents a downward trend or a decrease in something generated by AI
Free with trial Anxious Trader Female Character Panics As Ethereum Cryptocurrency Price Decrease, Fearing Financial Loss And Uncertainty In Market, Exacerbating The Downward Trend. Cartoon People Vector Illustration. Trend decrease vectors Anxious Trader Female Character Panics As Cryptocurrency Prices Decrease, Fearing Financial Loss And Uncertainty. Anxious Trader Female Character Panics As Ethereum Cryptocurrency Price Decrease, Fearing Financial Loss And Uncertainty In Market, Exacerbating The Downward Trend. Cartoon People Vector Illustration
Free with trial A striking and impactful collection of illustrations depicting a stock market crash with dramatic downward trend graphs. Trend decrease vectors Stock market crash down graph illustration. A striking and impactful collection of illustrations depicting a stock market crash with dramatic downward trend graphs
Free with trial Market Risk concept. An apprehensive investor considers potential financial downturns, highlighted by warning signs and a downward trend. Risk assessment in investment. Flat vector illustratio. Trend decrease vectors Market Risk concept. Flat vector. Market Risk concept. An apprehensive investor considers potential financial downturns, highlighted by warning signs and a downward trend. Risk assessment in investment. Flat vector illustratio
Free with trial Clean animated bar chart visualizing rising and falling market trends with green bars representing growth, profit, and positive performance, and red bars indicating decline, loss, and negative movement. Symbolizes financial volatility, stock market cycles, economic fluctuations, investment performance, and business analytics. Ideal for illustrating bullish and bearish phases, economic indicators, trading activity, and financial data visualization. Trend decrease illustrations Financial Market Trend Animation Showing Upturn and Downturn Phases. Clean animated bar chart visualizing rising and falling market trends with green bars representing growth, profit, and positive performance, and red bars indicating decline, loss, and negative movement. Symbolizes financial volatility, stock market cycles, economic fluctuations, investment performance, and business analytics. Ideal for illustrating bullish and bearish phases, economic indicators, trading activity, and financial data visualization.
Free with trial Businessman are sit down on a business graph. Chart in the fall. Business falling down. Negative trend. Crisis impact. economy going down. vector, illustration. Trend decrease illustrations Businessman are sit down on a business graph. Chart in the fall. Business falling down. Negative trend. Crisis impact. economy
Free with trial A graphic representing financial or performance decline featuring an orange arrow pointing downwards over a wavy line, with the word LOSS displayed below. Trend decrease illustrations Orange downward trend arrow over wavy line with loss text. A graphic representing financial or performance decline featuring an orange arrow pointing downwards over a wavy line, with the word LOSS displayed below
Free with trial A 3D icon depicting an orange arrow pointing downwards in a zigzag pattern. The icon suggests downward movement, decline, decrease, or negative progress. It's commonly used to represent falling trends, negative changes, or downward movement in data or statistics. Trend decrease vectors Arrow Chart Down 3D Icon. A 3D icon depicting an orange arrow pointing downwards in a zigzag pattern. The icon suggests downward movement, decline, decrease, or negative progress. It's commonly used to represent falling trends, negative changes, or downward movement in data or statistics.
Free with trial Bull growth vs bear decline market trend concept background vector. Trend decrease vectors Bull growth vs bear decline market trend concept background
Free with trial Bull Market, Bull or bullish run Bear or bearish market trend in stocks. Trade exchange, green up or red down arrows graph. Cryptocurrency price chart. Global economy crash or boom. Trend decrease vectors Bull Market
Free with trial A white and red isometric arrow moving downward on a dark red grid pattern. Business concept representing decrease, loss, negative profit, economic crash, and market decline with blurred background. Trend decrease illustrations Isometric red arrow moving down on dark grid background with selective focus. A white and red isometric arrow moving downward on a dark red grid pattern. Business concept representing decrease, loss, negative profit, economic crash, and market decline with blurred background.
Free with trial This image depicts a global economic downturn using a visual representation. A large, white downward-pointing arrow dominates the scene, positioned over a grayscale world map. The map is overlaid on a dark red background, which further emphasizes the negative trend. Red bar graphs, scattered across the map, visually represent the economic decline in different regions, highlighting the severity of the situation. Numerical data points on the graph add to the visual impact and sense of decline. The overall effect creates a powerful and alarming visual metaphor for a worldwide economic crisis or recession. Trend decrease illustrations Global Economic Downturn Illustrated with World Map and Charts. This image depicts a global economic downturn using a visual representation. A large, white downward-pointing arrow dominates the scene, positioned over a grayscale world map. The map is overlaid on a dark red background, which further emphasizes the negative trend. Red bar graphs, scattered across the map, visually represent the economic decline in different regions, highlighting the severity of the situation. Numerical data points on the graph add to the visual impact and sense of decline. The overall effect creates a powerful and alarming visual metaphor for a worldwide economic crisis or recession.
Free with trial Decline food sales data illustration fruits vegetables, items year, trend analysis decline food sales data. Trend decrease illustrations Decline food sales data
Free with trial Warning red arrow curved illustration urgency curve, sharp intense, symbol trend warning red arrow curved. Trend decrease illustrations Warning red arrow curved
Free with trial This image shows a red line graph with a downward trend on a blue background. Vector illustration design using ai tool. Trend decrease vectors Financial crisis graph. This image shows a red line graph with a downward trend on a blue background. Vector illustration design using ai tool.
Free with trial This image shows a downward trend in a stock market chart with people losing money. Vector illustration design using ai tool. Trend decrease vectors Recession illustration. This image shows a downward trend in a stock market chart with people losing money. Vector illustration design using ai tool.
Free with trial Red arrow with a broken line indicating a sharp decline, showing a financial downturn. Trend decrease vectors Red arrow showing financial decline with broken line and downward trend. Red arrow with a broken line indicating a sharp decline, showing a financial downturn.
Free with trial Chat arrow down icon Vector set on white background. EPS 10. Trend decrease vectors Chart arrow down icon set. decline downward chart vector symbol. stock trend downturn graph sign. negative economy bar Chart. Chat arrow down icon Vector set on white background. EPS 10
Free with trial Chat arrow down icon Vector set on white background. EPS 10. Trend decrease vectors Chart arrow down icon set. decline downward chart vector symbol. stock trend downturn graph sign. negative economy bar Chart. Chat arrow down icon Vector set on white background. EPS 10
Free with trial Reduction green down arrow illustration fall trend, loss diminish, lower subtract reduction green down arrow. Trend decrease illustrations Reduction green down arrow
Free with trial This image shows a bar chart with a downward trend line, indicating economic decline. Vector illustration design using ai tool. Trend decrease vectors Economic recession chart. This image shows a bar chart with a downward trend line, indicating economic decline. Vector illustration design using ai tool.
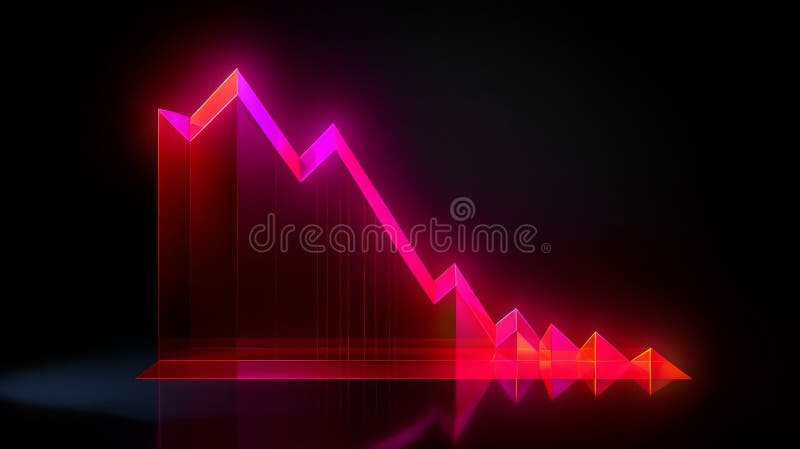
Free with trial Professional conceptual 3D render of a falling red financial graph on a dark background. The chart shows a sharp downward trend with a "CRISIS" tag at the lowest point, representing stock market failure, business bankruptcy, inflation, and economic downturn. Trend decrease illustrations Red line graph showing a sharp decline and economic crisis on a dark grid background. Professional conceptual 3D render of a falling red financial graph on a dark background. The chart shows a sharp downward trend with a "CRISIS" tag at the lowest point, representing stock market failure, business bankruptcy, inflation, and economic downturn.
Free with trial This striking image, generated by AI, depicts a group of people descending a hill, mirroring a sharply falling graph. It visually represents economic downturn or societal decline, offering a powerful metaphor for hardship and uncertainty. The stylistic choices create a sense of unease and forebodin. Trend decrease illustrations Descending Trend. This striking image, generated by AI, depicts a group of people descending a hill, mirroring a sharply falling graph. It visually represents economic downturn or societal decline, offering a powerful metaphor for hardship and uncertainty. The stylistic choices create a sense of unease and forebodin
Free with trial This image shows a 3D bar graph, generated by AI, depicting a rise and subsequent fall in values. The red bars illustrate a peak, followed by a sharp decline, possibly representing a trend in data or market fluctuations. The visual is clean and easy to understand, highlighting the dramatic change i. Trend decrease illustrations Red 3D Bar Graph. This image shows a 3D bar graph, generated by AI, depicting a rise and subsequent fall in values. The red bars illustrate a peak, followed by a sharp decline, possibly representing a trend in data or market fluctuations. The visual is clean and easy to understand, highlighting the dramatic change i
Free with trial Generative AI : Abstract pink crisis business and forex chart on blurry toned city wallpaper with bokeh circles Downward trend and financial downfall concept Double exposure busine. Trend decrease illustrations Generative AI Abstract pink crisis business and forex chart on blurry toned city wallpaper with bokeh circles Down. Generative AI : Abstract pink crisis business and forex chart on blurry toned city wallpaper with bokeh circles Downward trend and financial downfall concept Double exposure busine
Free with trial This colorful bar graph, generated by AI, depicts a downward trend using vibrant red, green, and yellow paint. The melting paint adds a dynamic, visually engaging element to the standard bar chart format, showcasing data decline creatively. Trend decrease illustrations Melting Bar Graph. This colorful bar graph, generated by AI, depicts a downward trend using vibrant red, green, and yellow paint. The melting paint adds a dynamic, visually engaging element to the standard bar chart format, showcasing data decline creatively.
Free with trial Bullish profit vs bearish loss stock market trend concept background vector. Trend decrease vectors Bullish profit vs bearish loss stock market trend concept background
Free with trial Company graphs data illustration time valleys, volatility market, background trend company graphs data. Trend decrease illustrations Company graphs data
Free with trial Chat arrow down icon Vector set on white background. EPS 10. Trend decrease vectors Chart arrow down icon set. decline downward chart vector symbol. stock trend downturn graph sign. negative economy bar Chart. Chat arrow down icon Vector set on white background. EPS 10
Free with trial The image depicts a red graph indicating a decrease in oil prices, with oil pumps in the background. Trend decrease illustrations Oil industry decline concept with pump jacks and a downward trend graph. The image depicts a red graph indicating a decrease in oil prices, with oil pumps in the background
Free with trial This image shows a declining bar graph with broken bars and a downward trend line. Vector illustration design using ai tool. Trend decrease vectors Stock market crash. This image shows a declining bar graph with broken bars and a downward trend line. Vector illustration design using ai tool.
Free with trial This image shows a rolled-up graph with a red line depicting a downturn, generated by AI. It visually represents a negative trend or decline in data, potentially illustrating economic recession, market loss, or other negative statistical trends. The clean design allows for easy visualization of the. Trend decrease illustrations Declining Graph Report. This image shows a rolled-up graph with a red line depicting a downturn, generated by AI. It visually represents a negative trend or decline in data, potentially illustrating economic recession, market loss, or other negative statistical trends. The clean design allows for easy visualization of the
Free with trial Downward arrow with percent sign icon set. Line, solid and filled outline style. Finance symbol for decrease, loss, or declining interest icon. Trend decrease vectors Arrow down percent icon set in line, solid and filled outline style. Downward arrow with percent sign icon set. Line, solid and filled outline style. Finance symbol for decrease, loss, or declining interest icon.
Free with trial Vector illustration of a red arrow trending down. Trend decrease vectors Red arrow downward trend. vector illustration of a red arrow trending down
Free with trial Three red, 3D arrows curving downwards, generated by AI, symbolize decline, decrease, or downturn. The image offers a visual representation of negative trends or a downward trajectory, suitable for presentations or reports. Trend decrease illustrations Red Arrows Pointing Down. Three red, 3D arrows curving downwards, generated by AI, symbolize decline, decrease, or downturn. The image offers a visual representation of negative trends or a downward trajectory, suitable for presentations or reports.
Free with trial Generative AI : Abstract pink crisis business and forex chart on blurry toned city wallpaper with bokeh circles Downward trend and financial downfall concept Double exposure busine. Trend decrease illustrations Generative AI Abstract pink crisis business and forex chart on blurry toned city wallpaper with bokeh circles Down. Generative AI : Abstract pink crisis business and forex chart on blurry toned city wallpaper with bokeh circles Downward trend and financial downfall concept Double exposure busine
Free with trial Generative AI : Abstract pink crisis business and forex chart on blurry toned city wallpaper with bokeh circles Downward trend and financial downfall concept Double exposure busine. Trend decrease illustrations Generative AI Abstract pink crisis business and forex chart on blurry toned city wallpaper with bokeh circles Down. Generative AI : Abstract pink crisis business and forex chart on blurry toned city wallpaper with bokeh circles Downward trend and financial downfall concept Double exposure busine
Free with trial Generative AI : Abstract pink crisis business and forex chart on blurry toned city wallpaper with bokeh circles Downward trend and financial downfall concept Double exposure busine. Trend decrease illustrations Generative AI Abstract pink crisis business and forex chart on blurry toned city wallpaper with bokeh circles Down. Generative AI : Abstract pink crisis business and forex chart on blurry toned city wallpaper with bokeh circles Downward trend and financial downfall concept Double exposure busine
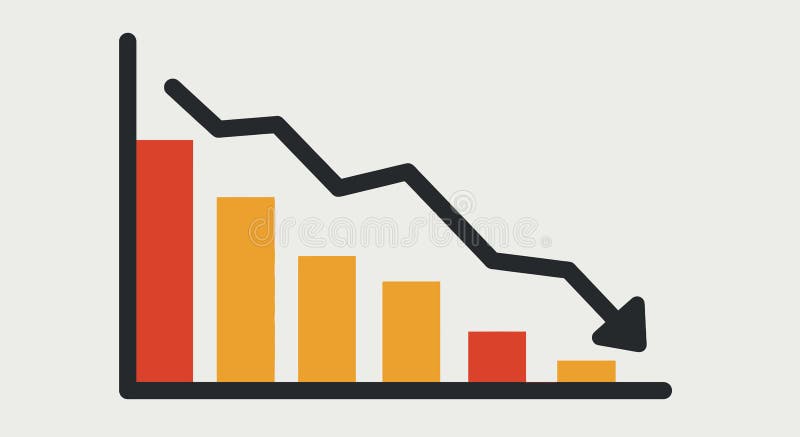
Free with trial A minimalist bar chart with a descending line graph overlay, symbolizing financial loss, performance decline, or negative data trends. Ideal for presentations, dashboards, economic reports, and warning visuals. Trend decrease vectors Downward Trend Bar Chart Icon. A minimalist bar chart with a descending line graph overlay, symbolizing financial loss, performance decline, or negative data trends. Ideal for presentations, dashboards, economic reports, and warning visuals