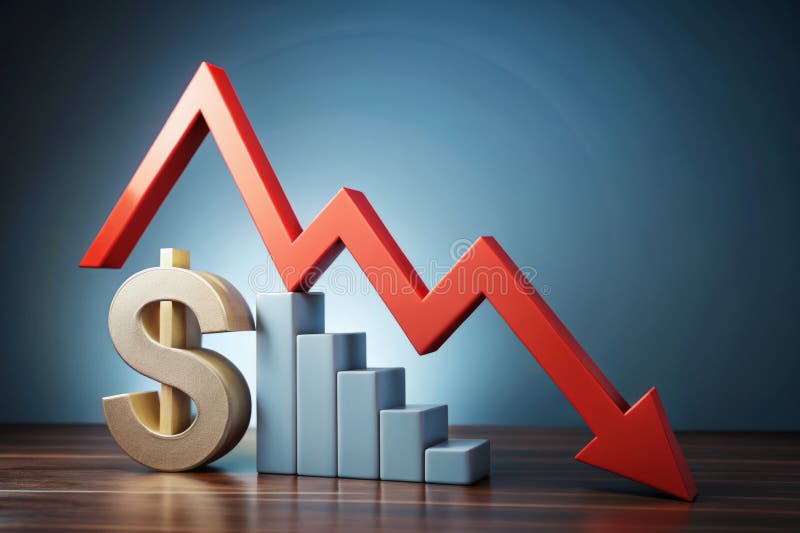
Free with trial This image features a red stock market decline chart with a dark background. It represents a financial crisis concept with a descending bar graph, indicating a negative trend in the market. The use of red highlights the severity of the decline and signals a potential risk in the investment landscape. Trend decrease illustrations Red Stock Market Decline Chart with Dark Background representing Financial Crisis Concept. This image features a red stock market decline chart with a dark background. It represents a financial crisis concept with a descending bar graph, indicating a negative trend in the market. The use of red highlights the severity of the decline and signals a potential risk in the investment landscape
Free with trial A cartoon character is depicted holding a large red downward arrow, representing decrease or decline against a plain white background. Trend decrease illustrations Character Holding a Large Red Downward Arrow Symbolizing Decline on a White Background. A cartoon character is depicted holding a large red downward arrow, representing decrease or decline against a plain white background
Free with trial Trend artwork composite sketch image photo collage of laptop device monitor confused man look shock appear hand hold trash paper throw. Trend decrease illustrations Trend artwork composite sketch image photo collage of laptop device monitor confused man look shock appear hand hold
Free with trial A stylized 3D business growth chart depicted against a light blue background. The chart features a blue mountain-like shape representing a peak, with two intersecting lines. One line, marked with pink nodes, shows fluctuations, while another line with green nodes indicates a general upward trend. This visual metaphor conveys concepts of business performance, market trends, and financial analysis. Trend decrease illustrations 3D Stylized Business Growth Chart with Red and Green Nodes on Blue Background graph data. A stylized 3D business growth chart depicted against a light blue background. The chart features a blue mountain-like shape representing a peak, with two intersecting lines. One line, marked with pink nodes, shows fluctuations, while another line with green nodes indicates a general upward trend. This visual metaphor conveys concepts of business performance, market trends, and financial analysis
Free with trial A 3D illustration depicts financial data analysis. On the left, a purple rectangular panel shows a red downward-trending arrow and a small pie chart with red, yellow, and blue segments. Below it, another purple panel displays a candlestick chart with red and blue bars. To the right, an orange magnifying glass with a turquoise lens hovers, suggesting investigation. The entire composition is set. Trend decrease illustrations 3D Render of Financial Data Visualization with Downward Trend Graph and Magnifying Glass. A 3D illustration depicts financial data analysis. On the left, a purple rectangular panel shows a red downward-trending arrow and a small pie chart with red, yellow, and blue segments. Below it, another purple panel displays a candlestick chart with red and blue bars. To the right, an orange magnifying glass with a turquoise lens hovers, suggesting investigation. The entire composition is set
Free with trial Business decline and financial crisis illustrated on a chalkboard, showing a downward trend. Hand drawing orange arrow over white bar chart on blue background with ample copy space. Ideal for economic reports, financial news, marketing, or presentations needing a negative trend. Trend decrease illustrations Business Decline Financial Chart Hand Drawing Chalkboard Recession Background Copy Space. Business decline and financial crisis illustrated on a chalkboard, showing a downward trend. Hand drawing orange arrow over white bar chart on blue background with ample copy space. Ideal for economic reports, financial news, marketing, or presentations needing a negative trend.
Free with trial A stark visual representation of a downward trend in business metrics and market conditions. Trend decrease illustrations Red arrow graph illustrates sharp decline in financial performance and economic downturn. A stark visual representation of a downward trend in business metrics and market conditions
Free with trial A red bar graph with a descending arrow on a white plane. The graph shows a downward trend, visually representing loss or decline in areas such as finance, business, the economy, or the market. It is isolated on white. Trend decrease illustrations Red bar graph with arrow isolated on white background. use cases: finance, business, economy. A red bar graph with a descending arrow on a white plane. The graph shows a downward trend, visually representing loss or decline in areas such as finance, business, the economy, or the market. It is isolated on white
Free with trial This detailed graph highlights the stark contrast between a declining and ascending trend, using vibrant orange shades to showcase dynamic changes over time. Trend decrease illustrations Graphical Representation of Contrasting Trends in Shades of Orange Exhibiting Dynamic Changes. This detailed graph highlights the stark contrast between a declining and ascending trend, using vibrant orange shades to showcase dynamic changes over time
Free with trial Red background with a downward arrow and grid pattern, with vertical bars at the bottom, suggesting a decline or decrease in a metric Vertical Mobile Wallpaper. Trend decrease illustrations Red background, downward arrow with grid pattern, vertical bars suggest decline. red background with a downward arrow and grid pattern, with vertical bars at the bottom, suggesting a decline or decrease in a metric Vertical Mobile Wallpaper
Free with trial Red background with a downward arrow and grid pattern, with vertical bars at the bottom, suggesting a decline or decrease in a metric. Trend decrease illustrations Red background, downward arrow with grid pattern, vertical bars suggest decline. red background with a downward arrow and grid pattern, with vertical bars at the bottom, suggesting a decline or decrease in a metric
Free with trial 3D collage poster template trend of recession economy investor budget loss finance arrow down young lady sit budget income broken coins. Trend decrease illustrations 3D collage poster template trend of recession economy investor budget loss finance arrow down young lady sit budget
Free with trial A vibrant red arrow points downward against a clean, solid-colored backdrop, symbolizing a decline or shift in focus. This visual representation effectively conveys motion and change. Trend decrease illustrations Red downward arrow on a solid background indicating a decrease or direction change in trends. A vibrant red arrow points downward against a clean, solid-colored backdrop, symbolizing a decline or shift in focus. This visual representation effectively conveys motion and change.
Free with trial A 3D bar chart displays a downward trend. The bars are alternating green and pink, decreasing in height from left to right. A bright yellow arrow points downwards, crossing over the bars and emphasizing the decline. The background is a solid, light blue. Trend decrease illustrations Downward Trending Bar Chart with Yellow Arrow Indicating Decline on Light Blue Background. A 3D bar chart displays a downward trend. The bars are alternating green and pink, decreasing in height from left to right. A bright yellow arrow points downwards, crossing over the bars and emphasizing the decline. The background is a solid, light blue
Free with trial Three stacks of golden coins are arranged on a white surface. A prominent red arrow, indicating a downward trend, is positioned diagonally above the coins, pointing towards the right. The arrow's sharp angles and vibrant red color convey a sense of financial decline or loss. The coins are depicted in varying heights, with a single coin resting on top of the middle stack. Trend decrease illustrations Red downward trending graph arrow over stacks of gold coins on a white background finance. Three stacks of golden coins are arranged on a white surface. A prominent red arrow, indicating a downward trend, is positioned diagonally above the coins, pointing towards the right. The arrow's sharp angles and vibrant red color convey a sense of financial decline or loss. The coins are depicted in varying heights, with a single coin resting on top of the middle stack
Free with trial This image depicts a stock market decline with a red bar chart against a dark background, illustrating a financial crisis concept. The chart shows a downward trend, indicating negative market performance. Trend decrease illustrations Red Stock Market Decline Chart Displaying Financial Crisis on Dark Background. This image depicts a stock market decline with a red bar chart against a dark background, illustrating a financial crisis concept. The chart shows a downward trend, indicating negative market performance
Free with trial Three stacks of gold coins decrease in height from left to right, with a red arrow pointing downwards across them. Isolated on a transparent background. Trend decrease vectors Stacks of gold coins with red downward trend arrow isolated on a transparent background money. Three stacks of gold coins decrease in height from left to right, with a red arrow pointing downwards across them. Isolated on a transparent background
Free with trial Bar chart showing downward trend with dollar symbol. Trend decrease vectors Bar chart showing downward trend with dollar symbol
Free with trial Bar chart showing downward trend with dollar symbol. Trend decrease vectors Bar chart showing downward trend with dollar symbol
Free with trial Bar chart showing downward trend with dollar symbol. Trend decrease vectors Bar chart showing downward trend with dollar symbol
Free with trial Bar chart showing downward trend with dollar symbol. Trend decrease vectors Bar chart showing downward trend with dollar symbol
Free with trial A vibrant red arrow points downward against a minimalistic, clean solid background, effectively conveying a message of decline or drop in values, trends, or performance metrics. Trend decrease illustrations Bright red downward arrow on a smooth, clean, solid background indicating a decline or decrease. A vibrant red arrow points downward against a minimalistic, clean solid background, effectively conveying a message of decline or drop in values, trends, or performance metrics.
Free with trial A single red arrow with a curved path indicating a downward trend, isolated on a clean white background. Trend decrease illustrations A simple red curved arrow pointing downwards and to the right isolated on white background. A single red arrow with a curved path indicating a downward trend. A single red arrow with a curved path indicating a downward trend, isolated on a clean white background
Free with trial A glossy red arrow points downwards, symbolizing direction change, decline, or a downward trend. Perfect for various applications. Trend decrease illustrations Bright red down arrow symbol indicating direction or decrease isolated on white isolated on white background. A glossy red arrow points downwards, symbolizing direction change, decline, or a downward trend. Perfect for various applications
Free with trial A bold red arrow points downward, symbolizing a negative trend or decline, often associated with financial or performance metrics. This visual representation is commonly used in reports. Trend decrease vectors Red downward arrow indicating decline in trends or performance metrics across data visuals. A bold red arrow points downward, symbolizing a negative trend or decline, often associated with financial or performance metrics. This visual representation is commonly used in reports.
Free with trial Composite trend artwork sketch image collage of business arrow down bankruptcy loss money coins young guy walk down recession reduction. Trend decrease illustrations Composite trend artwork sketch image collage of business arrow down bankruptcy loss money coins young guy walk down
Free with trial Business chart icon set with graph, statistic, line and bar diagram for finance or analysis. Pie graphics with horizontal and donut layout for data growth. Vector report for trend or economy by pictogram scheme. Trend decrease vectors Business chart icon set with graph, statistic, line and bar diagram for finance or analysis. Pie graphics with
Free with trial Composite trend artwork sketch image collage of business trader arrow down lose money crisis charts down pile coins young lady sad sit. Trend decrease illustrations Composite trend artwork sketch image collage of business trader arrow down lose money crisis charts down pile coins
Free with trial A vibrant red arrow curves downwards, indicating a decline or negative trend, isolated on a clean white background. Trend decrease illustrations Red arrow pointing down isolated on white background. A vibrant red arrow curves downwards, indicating a decline or negative trend, isolated on a clean white background
Free with trial Downward trend in global recession icon, financial decline with world map and arrow, line art icon set. Trend decrease vectors Downward trend in global recession icon, financial decline with world map and arrow, line art icon set
Free with trial Percentage symbol in circle with arrow up and arrow down icons represents financial growth and decrease. Trend decrease vectors Percentage symbol in circle with arrow up and arrow down icons represents financial growth and decrease
Free with trial In a softly lit setting, a hand holds a translucent card. On the card, a downward-pointing arrow graphic is displayed, symbolizing decline, loss, or negative trend. The color palette is minimal. Trend decrease illustrations A hand delicately holds a card displaying a stark white arrow pointing downwards, indicating loss. In a softly lit setting, a hand holds a translucent card. On the card, a downward-pointing arrow graphic is displayed, symbolizing decline, loss, or negative trend. The color palette is minimal
Free with trial This image visually depicts the impact of declining currency and interest rates within an economic context. A percentage model, a fundamental tool in economic analysis, serves as the foundation. The downward-pointing arrow dramatically illustrates the negative trend, signifying a decrease in both the value of a specific currency and the interest rates associated with loans and investments. This. Trend decrease illustrations Understanding Declining Currency and Interest Rates: A Visual Representation of Economic Trends. This image visually depicts the impact of declining currency and interest rates within an economic context. A percentage model, a fundamental tool in economic analysis, serves as the foundation. The downward-pointing arrow dramatically illustrates the negative trend, signifying a decrease in both the value of a specific currency and the interest rates associated with loans and investments. This
Free with trial This powerful visual concept depicts a devastating financial crisis and economic downturn. Symbolic wooden blocks, including a crumbling bank structure, represent bank failure and the ensuing recession. A cracked block and a falling arrow down highlight the downward trend and potential for loss in the stock market crash. Ideal for illustrating themes of investment risk, debt, finance, business. Trend decrease illustrations Financial crisis concept illustrating bank failure and economic decline with symbolic blocks. This powerful visual concept depicts a devastating financial crisis and economic downturn. Symbolic wooden blocks, including a crumbling bank structure, represent bank failure and the ensuing recession. A cracked block and a falling arrow down highlight the downward trend and potential for loss in the stock market crash. Ideal for illustrating themes of investment risk, debt, finance, business
Free with trial Generative ai, The image shows a red background with a grid pattern on it. The image also contains a large red arrow pointing down, suggesting a sharp decline. The image is likely representative of a negative financial trend on a stock chart or a si. Trend decrease illustrations The image shows a red arrow pointing down on a red background grid. The arrow is pointing down with a sharp decline, symbolizing a. generative ai, The image shows a red background with a grid pattern on it. The image also contains a large red arrow pointing down, suggesting a sharp decline. The image is likely representative of a negative financial trend on a stock chart or a si
Free with trial A single, glossy green arrow points directly downwards. The arrow has a smooth, rounded appearance and a reflective surface, suggesting a 3D rendered object. It is presented in isolation on a clean white background, making it a clear and prominent visual element. This icon commonly represents a decrease, download, or negative direction. Trend decrease illustrations Glossy Green Downward Arrow Icon on a White Background image photo. A single, glossy green arrow points directly downwards. The arrow has a smooth, rounded appearance and a reflective surface, suggesting a 3D rendered object. It is presented in isolation on a clean white background, making it a clear and prominent visual element. This icon commonly represents a decrease, download, or negative direction
Free with trial Three stacks of gold coins decrease in height from left to right, overlaid by a red arrow pointing downwards. Isolated on a transparent background. Trend decrease vectors Stacks of gold coins with red downward trending arrow isolated on a transparent background money. Three stacks of gold coins decrease in height from left to right, overlaid by a red arrow pointing downwards. Isolated on a transparent background
Free with trial Template poster trend artwork photo collage of young lady sit down arrow crack dollar bankruptcy finance economy inflation budget crisis. Trend decrease illustrations Template poster trend artwork photo collage of young lady sit down arrow crack dollar bankruptcy finance economy
Free with trial Composite 3D photo collage design trend sketch of young lady wow face stand hand hold scissors cut percent arrow earnings market bank. Trend decrease illustrations Composite 3D photo collage design trend sketch of young lady wow face stand hand hold scissors cut percent arrow
Free with trial Trend artwork collage template sketch of oil barrel sanctions arrow business finance investor reduction earnings inflation young man run. Trend decrease illustrations Trend artwork collage template sketch of oil barrel sanctions arrow business finance investor reduction earnings
Free with trial A character is gripping a large red arrow pointing downward, representing a decrease or decline in values, set against a clean white background. Trend decrease illustrations Character Holding a Large Red Downward Arrow Symbolizes Decline Against a Simple White Background. A character is gripping a large red arrow pointing downward, representing a decrease or decline in values, set against a clean white background
Free with trial Vertical bar graph, bars decrease left to right, red arrow points down Vertical Mobile Wallpaper. Trend decrease illustrations Vertical bar graph, bars decrease left to right, red arrow points down
Free with trial Vertical bar graph, bars decrease left to right, red arrow points down For Social Media Post Size. Trend decrease illustrations Vertical bar graph, bars decrease left to right, red arrow points down
Free with trial Vertical bar graph, bars decrease left to right, red arrow points down Generative AI. Trend decrease illustrations Vertical bar graph, bars decrease left to right, red arrow points down
Free with trial Composite trend artwork 3D sketch image photo collage of workspace stats trader business analyze budget young guy confused upset crisis. Trend decrease illustrations Composite trend artwork 3D sketch image photo collage of workspace stats trader business analyze budget young guy
Free with trial A red bar chart illustrating a downward trend, with bars decreasing in height and a red arrow pointing downwards, signifying decline and loss. Trend decrease illustrations Bar chart with downward trending arrow isolated on white background. A red bar chart illustrating a downward trend, with bars decreasing in height and a red arrow pointing downwards, signifying decline and loss
Free with trial A sharp red arrow, indicating a downward trend, is superimposed over a thick stack of green dollar bills. The dollar bills are depicted with a subtle texture and the dollar sign. The image is set against a clean white background, emphasizing the concept of financial decline or loss. Trend decrease illustrations Red Downward Arrow Graph Over a Stack of Green Dollar Bills on White Background money finance. A sharp red arrow, indicating a downward trend, is superimposed over a thick stack of green dollar bills. The dollar bills are depicted with a subtle texture and the dollar sign. The image is set against a clean white background, emphasizing the concept of financial decline or loss
Free with trial A close-up, angled view of a digital stock market ticker board. The screen displays rows of numbers in vibrant red and green LED lights against a dark background. Red numbers typically indicate a price decrease or negative performance, while green signifies an increase or positive performance. The display shows various financial data, including stock prices, trading volumes, and potentially chart lines, creating a dynamic and abstract representation of financial markets and trading. Trend decrease illustrations Stock Market Ticker Display with Red and Green Numbers. A close-up, angled view of a digital stock market ticker board. The screen displays rows of numbers in vibrant red and green LED lights against a dark background. Red numbers typically indicate a price decrease or negative performance, while green signifies an increase or positive performance. The display shows various financial data, including stock prices, trading volumes, and potentially chart lines, creating a dynamic and abstract representation of financial markets and trading.
Free with trial A character stands alone, holding a large red arrow pointing downward, symbolizing a decline or decrease, set against a plain white backdrop. Trend decrease illustrations Character Holding a Large Red Downward Arrow Indicating Decline on a White Background. A character stands alone, holding a large red arrow pointing downward, symbolizing a decline or decrease, set against a plain white backdrop
Free with trial A 3D illustration depicts a large white dollar sign centered on a vibrant purple circle. Two smaller white circles are positioned on either side of the purple circle. A green upward-pointing arrow is in the top right circle, signifying growth or increase, while a red downward-pointing arrow is in the bottom left circle, indicating decline or decrease. The composition is set against a clean white. Trend decrease illustrations 3D Dollar Sign with Up and Down Arrows Indicating Financial Growth and Decline on White Background. A 3D illustration depicts a large white dollar sign centered on a vibrant purple circle. Two smaller white circles are positioned on either side of the purple circle. A green upward-pointing arrow is in the top right circle, signifying growth or increase, while a red downward-pointing arrow is in the bottom left circle, indicating decline or decrease. The composition is set against a clean white
Free with trial A laptop computer showing various graphs and charts representing trend analysis for website traffic, Incorporate trend analysis for website traffic fluctuations. Trend decrease illustrations A laptop computer showing various graphs and charts representing trend analysis for website traffic, Incorporate trend analysis
Free with trial Composite trend artwork photo collage of office manager young woman rich earn work arrow down loss money hand hold banknote stand ladder. Trend decrease illustrations Composite trend artwork photo collage of office manager young woman rich earn work arrow down loss money hand hold
Free with trial A character stands isolated and holds a large red downward arrow, representing a decrease in values or metrics. Trend decrease illustrations Character Holding a Large Red Downward Arrow Symbolizing Decline on a White Background. A character stands isolated and holds a large red downward arrow, representing a decrease in values or metrics
Free with trial Trend artwork banner sketch 3d photo collage of loader truck carry wooden cube dollar currency tower arrow decline problem usa. Trend decrease illustrations Trend artwork banner sketch 3d photo collage of loader truck carry wooden cube dollar currency tower arrow decline
Free with trial Three stacks of gold coins are arranged from tallest to shortest on a plain pink background. A large, bold red arrow points diagonally downwards, indicating a decrease or loss. The visual represents a financial or economic downturn. Trend decrease illustrations Stacks of Gold Coins Decreasing in Height with a Red Arrow Pointing Downward on a Pink Background. Three stacks of gold coins are arranged from tallest to shortest on a plain pink background. A large, bold red arrow points diagonally downwards, indicating a decrease or loss. The visual represents a financial or economic downturn
Free with trial Two prominent blue three-dimensional arrows are positioned vertically against a stark white background. One arrow points directly upwards, and the other points directly downwards, symbolizing opposing directions or concepts such as increase and decrease. Trend decrease illustrations Two Blue 3D Arrows Pointing Up and Down on a White Background Keywords: arrow, arrows, up arrow, down arrow, direction, movement. Two prominent blue three-dimensional arrows are positioned vertically against a stark white background. One arrow points directly upwards, and the other points directly downwards, symbolizing opposing directions or concepts such as increase and decrease
Free with trial Trend composite sketch template 3D photo collage of salary trade dollars economy young lady burnout arrow down bank credit card inflation. Trend decrease illustrations Trend composite sketch template 3D photo collage of salary trade dollars economy young lady burnout arrow down bank
Free with trial Trend artwork creative sketch 3D photo collage of young lady cover face depressed sit arrow coins savings investment economy income market. Trend decrease illustrations Trend artwork creative sketch 3D photo collage of young lady cover face depressed sit arrow coins savings investment
Free with trial 3D collage trend artwork composite poster of bag dept arrow down crisis pile coins human legs sit earnings currency market income budget. Trend decrease illustrations 3D collage trend artwork composite poster of bag dept arrow down crisis pile coins human legs sit earnings currency
Free with trial Stock market trading technical analysis bar chart fall. Business candlestick graph exchange down trend. Crisis economy and investment loss graph. Trader financial index crash concept. Money losing eps. Trend decrease vectors Stock market trading technical analysis bar chart fall. Business candlestick graph exchange down trend. Crisis economy
Free with trial Composite trend artwork sketch image photo collage of sale black friday shopping worker hold hammer crash usd symbol dollar crisis loss. Trend decrease illustrations Composite trend artwork sketch image photo collage of sale black friday shopping worker hold hammer crash usd symbol
Free with trial Red arrow pointing downward represents a financial downturn and economic loss against a backdrop of bar graphs indicating market decline and potential investment risks suggesting a challenging econom. Trend decrease illustrations Red downward trend arrow illustrates financial loss and market decline on a bar graph background. Red arrow pointing downward represents a financial downturn and economic loss against a backdrop of bar graphs indicating market decline and potential investment risks suggesting a challenging econom
Free with trial Composite 3D photo collage design trend sketch of aged woman work laptop stand arrow graphics oil stock distribution finance work trade. Trend decrease illustrations Composite 3D photo collage design trend sketch of aged woman work laptop stand arrow graphics oil stock distribution
Free with trial Trend artwork creative sketch 3D photo collage of price growth budget down reduction investor economy business young lady stand pressure. Trend decrease illustrations Trend artwork creative sketch 3D photo collage of price growth budget down reduction investor economy business young
Free with trial A vivid red arrow plunges diagonally downwards against a white grid. This image symbolizes economic downturn, financial loss, or a negative trend. It's ideal for illustrating market decline or recession. Trend decrease illustrations Red arrow pointing down isolated on white background, for financial and economic decline use cases. A vivid red arrow plunges diagonally downwards against a white grid. This image symbolizes economic downturn, financial loss, or a negative trend. It's ideal for illustrating market decline or recession
Free with trial Composite trend artwork 3D image photo collage of copyspace young woman miniature stand huge arrow show direction down star achieve goal. Trend decrease illustrations Composite trend artwork 3D image photo collage of copyspace young woman miniature stand huge arrow show direction down
Free with trial Trend composite sketch template 3D photo collage of world map laptop dispaly graphics young lady walk splash fuel oil barrel distribution. Trend decrease illustrations Trend composite sketch template 3D photo collage of world map laptop dispaly graphics young lady walk splash fuel oil
Free with trial Trend design 3D photo collage of two huge hand hold piece coin young man fall down inflation investor business budget reduction economy. Trend decrease illustrations Trend design 3D photo collage of two huge hand hold piece coin young man fall down inflation investor business budget
Free with trial Generative ai, A red grid background with a white arrow pointing downwards which is overlaid on top of red bars to portray a negative trend. Trend decrease illustrations A red, gridded background shows a white arrow dramatically plummeting downward indicating a sharp decline. generative ai, A red grid background with a white arrow pointing downwards which is overlaid on top of red bars to portray a negative trend
Free with trial A glossy green arrow pointing downwards, emblazoned with a white percentage symbol, symbolizing decreasing prices, financial decline, sales reduction, and negative economic trends. Trend decrease illustrations Green downward arrow with percentage symbol indicating sales decrease and financial growth decline. A glossy green arrow pointing downwards, emblazoned with a white percentage symbol, symbolizing decreasing prices, financial decline, sales reduction, and negative economic trends
Free with trial Declining red arrow and bar graph against a matching backdrop visually represent a significant economic downturn and financial market losses indicating potential business risks and investment failure. Trend decrease illustrations Red downward trend line and bar graph illustrate economic decline and financial market downturn effect. Declining red arrow and bar graph against a matching backdrop visually represent a significant economic downturn and financial market losses indicating potential business risks and investment failure
Free with trial Trend artwork composite sketch image 3D photo collage of young man trader keep balance on huge arrow grow earn bitcoin lose crisis. Trend decrease illustrations Trend artwork composite sketch image 3D photo collage of young man trader keep balance on huge arrow grow earn bitcoin
Free with trial Composite trend artwork 3D sketch image collage of arrow down business loss money point safe deposit box hand hold bag dollar lady stand. Trend decrease illustrations Composite trend artwork 3D sketch image collage of arrow down business loss money point safe deposit box hand hold bag
Free with trial Composite image montage trend 3D collage of silhouette young lady stand banknote devaluation inflation economy finance crisis investor. Trend decrease illustrations Composite image montage trend 3D collage of silhouette young lady stand banknote devaluation inflation economy finance
Free with trial Composite trend artwork collage of office manager young man hand hold huge coin loser fall down arrow loss money crisis bankruptcy fly. Trend decrease illustrations Composite trend artwork collage of office manager young man hand hold huge coin loser fall down arrow loss money crisis
Free with trial A bold red arrow sharply declines in a zigzag pattern, symbolizing a steep drop in performance or value. This visual powerfully conveys financial loss, economic downturn, or negative trends. Trend decrease illustrations Red arrow descending sharp decline downward trend graph represents financial loss economic downturn. A bold red arrow sharply declines in a zigzag pattern, symbolizing a steep drop in performance or value. This visual powerfully conveys financial loss, economic downturn, or negative trends
Free with trial Composite trend artwork image photo collage of office manager young lady work laptop arrow down loss money hand gesture catch coins pile. Trend decrease illustrations Composite trend artwork image photo collage of office manager young lady work laptop arrow down loss money hand gesture
Free with trial The image depicts a business professional in a suit interacting with a transparent digital chart displaying a declining trend in business performance. The visualization includes green bar charts and a line graph, complemented by a prominent downward arrow and percentage symbol indicating a decrease. This modern digital interface symbolizes data-driven decision-making, financial analysis, and real-time monitoring of business metrics for strategic planning. Trend decrease illustrations Business Performance Decline Visualization with Interactive Data Analytics and Percentage Drop Indicator. The image depicts a business professional in a suit interacting with a transparent digital chart displaying a declining trend in business performance. The visualization includes green bar charts and a line graph, complemented by a prominent downward arrow and percentage symbol indicating a decrease. This modern digital interface symbolizes data-driven decision-making, financial analysis, and real-time monitoring of business metrics for strategic planning.
Free with trial Composite trend artwork 3D sketch image photo collage of trader business money broken lose young man run huge coin arrow down businessman. Trend decrease illustrations Composite trend artwork 3D sketch image photo collage of trader business money broken lose young man run huge coin arrow
Free with trial Financial chart illustration. Declining graphic concept. Red arrow decrease Vector. Business diagram symbol. EPS 10. Trend decrease vectors Financial chart illustration. Declining graphic concept. Red arrow decrease Vector. Business diagram symbol.