Free with trial A man stands in front of a bar and line graph showing a downward trend. Vector art design using ai tool. Trend decrease vectors Stock Market Downward Illustration. A man stands in front of a bar and line graph showing a downward trend. Vector art design using ai tool.
Free with trial Decline flat style spiraling revenue chart illustration profit loss, trend data, visualization finance decline flat style spiraling revenue chart. Trend decrease illustrations Decline flat style spiraling revenue chart
Free with trial Blue three dimensional arrow pointing down on a white background. Trend decrease illustrations Blue 3d arrow pointing down representing negative trend. Blue three dimensional arrow pointing down on a white background
Free with trial This image features two variations of a decreasing graph icon. One is an outline version, and the other is a solid black version. Both show a bar graph with descending bars and a curved arrow pointing downwards, symbolizing a decline or decrease. These icons are suitable for illustrating concepts like loss, recession, negative trends, or falling statistics in various contexts. Trend decrease illustrations Decreasing Graph Icon Set. This image features two variations of a decreasing graph icon. One is an outline version, and the other is a solid black version. Both show a bar graph with descending bars and a curved arrow pointing downwards, symbolizing a decline or decrease. These icons are suitable for illustrating concepts like loss, recession, negative trends, or falling statistics in various contexts.
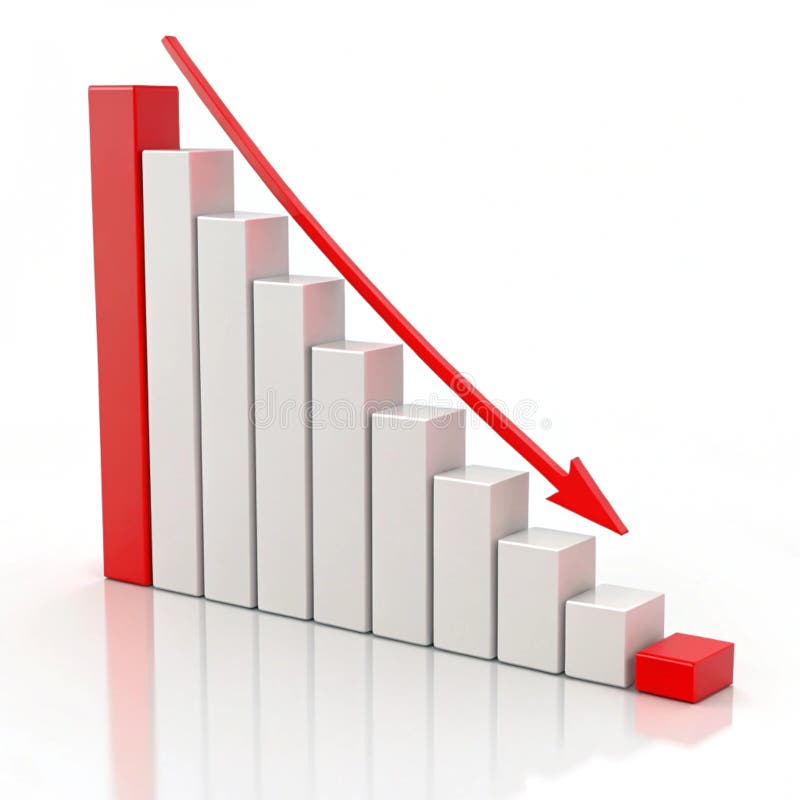
Free with trial A 3D stock market chart displays a bearish trend, with red bars dominating the view. The visual represents downturns in market performance and investor sentiment. Trend decrease illustrations Bearish Stock Market Graph. A 3D stock market chart displays a bearish trend, with red bars dominating the view. The visual represents downturns in market performance and investor sentiment.
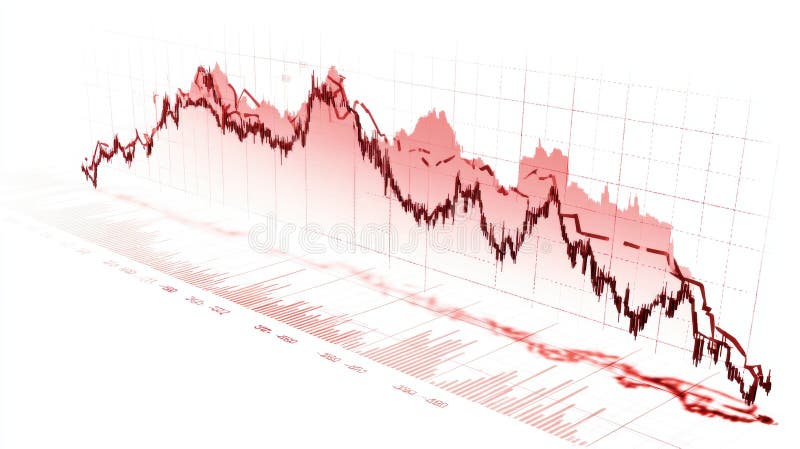
Free with trial This image shows a detailed close-up of a stock market graph depicting a significant decline. The red color emphasizes the negative trend, illustrating potential losses or economic downturn. This visualization was generated by AI for analysis and presentation purposes. Trend decrease illustrations Red Market Decline Graph. This image shows a detailed close-up of a stock market graph depicting a significant decline. The red color emphasizes the negative trend, illustrating potential losses or economic downturn. This visualization was generated by AI for analysis and presentation purposes.
Free with trial A business professional displays a digital graph of business growth trends. The graph showcases upward and downward fluctuations, representing the dynamic and complex nature of market analysis. The image is a visual representation of business growth and analysis using technology. The professional is likely studying data to make informed decisions for optimal performance and future growth. Trend decrease illustrations Business Growth Trend Analysis with Digital Graph. A business professional displays a digital graph of business growth trends. The graph showcases upward and downward fluctuations, representing the dynamic and complex nature of market analysis. The image is a visual representation of business growth and analysis using technology. The professional is likely studying data to make informed decisions for optimal performance and future growth
Free with trial A simple, bold red arrow trending downwards against a white background. The arrow zigzags downwards, ending with an arrowhead pointing down, resting on a horizontal red line. This image represents concepts like financial loss, economic downturn, market crash, failure, and negative trends. It's suitable for illustrating articles, presentations, or reports dealing with business, finance, and economics. Trend decrease illustrations Red Downward Trend Arrow. A simple, bold red arrow trending downwards against a white background. The arrow zigzags downwards, ending with an arrowhead pointing down, resting on a horizontal red line. This image represents concepts like financial loss, economic downturn, market crash, failure, and negative trends. It's suitable for illustrating articles, presentations, or reports dealing with business, finance, and economics.
Free with trial Dollar Decrease Bar Chart Icon. Flat design vector of a dollar coin and a falling bar chart. Perfect for finance, business, and loss themes. Isolated on white. Trend decrease vectors Dollar Decrease Bar Chart Icon. Flat design vector of a dollar coin and a falling bar chart. Perfect for finance, business, and loss themes. Isolated on white
Free with trial This image depicts a domino effect illustrating a market crash, with a downward trend generated by AI. The falling dominos symbolize the cascading impact of economic instability, highlighting the fragility of financial systems and the potential for rapid decline. Trend decrease illustrations Domino Effect: Market Crash. This image depicts a domino effect illustrating a market crash, with a downward trend generated by AI. The falling dominos symbolize the cascading impact of economic instability, highlighting the fragility of financial systems and the potential for rapid decline.
Free with trial This image shows a downward trend in stock prices with candlestick charts and arrows indicating the decline. Vector illustration design using ai tool. Trend decrease vectors Stock crash. This image shows a downward trend in stock prices with candlestick charts and arrows indicating the decline. Vector illustration design using ai tool.
Free with trial Conceptual image illustrating falling rent prices. A wooden house and the word 'RENT' constructed from blocks are shown falling from the sky, accompanied by scattered coins. A large red arrow points downwards, emphasizing the downward trend. In the background, a city skyline emerges from a sea of clouds, bathed in the warm light of a sunset or sunrise. This image can be used to represent economic downturns, housing market fluctuations, or financial challenges related to renting. Trend decrease illustrations Falling Rent Prices Concept. Conceptual image illustrating falling rent prices. A wooden house and the word 'RENT' constructed from blocks are shown falling from the sky, accompanied by scattered coins. A large red arrow points downwards, emphasizing the downward trend. In the background, a city skyline emerges from a sea of clouds, bathed in the warm light of a sunset or sunrise. This image can be used to represent economic downturns, housing market fluctuations, or financial challenges related to renting.
Free with trial This 3D rendering shows a circular arrangement of red arrows pointing downwards, illustrating a negative trend. The image is generated by AI and is perfect for representing concepts like market decline, economic downturn, or loss. Trend decrease illustrations Circular Red Downward Arrow. This 3D rendering shows a circular arrangement of red arrows pointing downwards, illustrating a negative trend. The image is generated by AI and is perfect for representing concepts like market decline, economic downturn, or loss.
Free with trial A 3D rendered image of a large, glossy red arrow curving downwards on a clean, white background. The arrow's smooth, rounded shape and vibrant color create a sense of direction and emphasis. The image is suitable for illustrating concepts such as decline, decrease, failure, or downward trends in various contexts like finance, business, or statistics. Trend decrease illustrations Red Arrow Pointing Downward. A 3D rendered image of a large, glossy red arrow curving downwards on a clean, white background. The arrow's smooth, rounded shape and vibrant color create a sense of direction and emphasis. The image is suitable for illustrating concepts such as decline, decrease, failure, or downward trends in various contexts like finance, business, or statistics.
Free with trial A 3D red arrow pointing downwards in a zigzag pattern, symbolizing a decline or loss, isolated on a white background. Trend decrease illustrations Red downward trend arrow isolated on white background. A 3D red arrow pointing downwards in a zigzag pattern, symbolizing a decline or loss, isolated on a white background
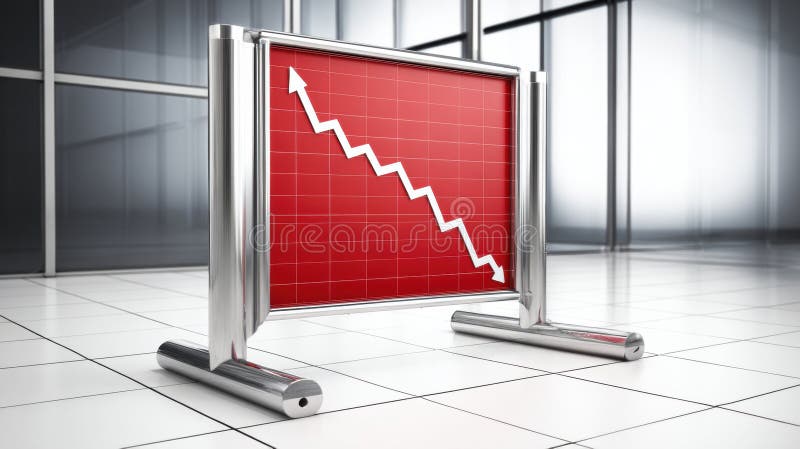
Free with trial This image shows a red graph displaying a downward trend, generated by AI. The graph is presented on a freestanding, metallic sign, suggesting a public display of economic or market data indicating a decline or downturn. The clean, modern setting adds to the professional feel, implying a serious fi. Trend decrease illustrations AI-Generated Declining Graph. This image shows a red graph displaying a downward trend, generated by AI. The graph is presented on a freestanding, metallic sign, suggesting a public display of economic or market data indicating a decline or downturn. The clean, modern setting adds to the professional feel, implying a serious fi
Free with trial A hand holds a piece of paper with a hand-drawn graph showing a sharp decline. The downward trend is clearly visible, indicating a negative development. This image was generated by AI and is ideal for illustrating concepts like economic downturn, market crash, or business failure. Trend decrease illustrations Hand Holding Declining Graph. A hand holds a piece of paper with a hand-drawn graph showing a sharp decline. The downward trend is clearly visible, indicating a negative development. This image was generated by AI and is ideal for illustrating concepts like economic downturn, market crash, or business failure.
Free with trial Bar graphs data illustration company year, color performance, categories trend bar graphs data. Trend decrease illustrations Bar graphs data
Free with trial Black and white icon depicting a downward arrow and a dollar symbol inside a speech bubble, positioned above an oil barrel with a droplet symbol. The design conveys a decrease in oil prices, using simple, bold lines for clear interpretation. Trend decrease vectors World Crude Oil Prices Down. Black and white icon depicting a downward arrow and a dollar symbol inside a speech bubble, positioned above an oil barrel with a droplet symbol. The design conveys a decrease in oil prices, using simple, bold lines for clear interpretation.
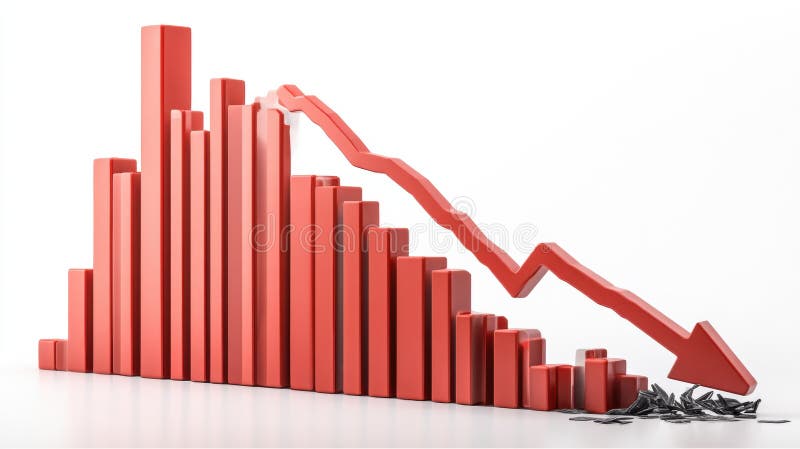
Free with trial A 3D rendering of a bar graph depicting a sharp decline in values. The red bars decrease in size, culminating in a large downward red arrow, symbolizing a significant economic downturn or market crash. The broken pieces at the bottom represent the loss or damage incurred. Trend decrease illustrations Red Bar Graph Showing Decline. A 3D rendering of a bar graph depicting a sharp decline in values. The red bars decrease in size, culminating in a large downward red arrow, symbolizing a significant economic downturn or market crash. The broken pieces at the bottom represent the loss or damage incurred.
Free with trial This image shows a red arrow sinking into clear water, creating a splash. The arrow, generated by AI, symbolizes a downward trend or decline, perhaps in market values or other metrics. The high-quality rendering emphasizes the impact and visual appeal. Trend decrease illustrations Red Arrow Plunging into Water. This image shows a red arrow sinking into clear water, creating a splash. The arrow, generated by AI, symbolizes a downward trend or decline, perhaps in market values or other metrics. The high-quality rendering emphasizes the impact and visual appeal.
Free with trial This image shows multiple yellow sticky notes, each with a downward-pointing black arrow, generated by AI. It represents a concept of decline or negative progression, perhaps in business or data analysis. The consistent pattern suggests a systematic downward trend. Trend decrease illustrations Downward Trending Sticky Notes. This image shows multiple yellow sticky notes, each with a downward-pointing black arrow, generated by AI. It represents a concept of decline or negative progression, perhaps in business or data analysis. The consistent pattern suggests a systematic downward trend.
Free with trial A hand holds a piece of paper with a simple line graph, possibly representing data or a trend, generated by AI. The minimalist design emphasizes the visual simplicity and the concept of data representation. The image could be used to illustrate various concepts related to progress, decline, or chan. Trend decrease illustrations Hand Holding Simple Line Graph. A hand holds a piece of paper with a simple line graph, possibly representing data or a trend, generated by AI. The minimalist design emphasizes the visual simplicity and the concept of data representation. The image could be used to illustrate various concepts related to progress, decline, or chan
Free with trial Stacks of transparent glass coins depict a downward trend, generated by AI, symbolizing financial downturn or economic recession. The image uses a dark background to highlight the contrast between the fragility of the glass coins and the severity of the market decline. Trend decrease illustrations AI-Generated Glass Coin Decline. Stacks of transparent glass coins depict a downward trend, generated by AI, symbolizing financial downturn or economic recession. The image uses a dark background to highlight the contrast between the fragility of the glass coins and the severity of the market decline.
Free with trial A 3D render shows two gold coins and a red downward trending arrow on a black surface within an open beige case. The case is angled with the lid open, revealing a dark interior. The objects are rendered with a smooth, glossy finish against a clean white background. Trend decrease illustrations Gold coins red down arrow red arrow down trend. A 3D render shows two gold coins and a red downward trending arrow on a black surface within an open beige case. The case is angled with the lid open, revealing a dark interior. The objects are rendered with a smooth, glossy finish against a clean white background
Free with trial This 3D bar graph, generated by AI, visually represents a sharp market decline. The red bars show a dramatic decrease in value, culminating in a broken arrow symbolizing a complete market crash. The image powerfully illustrates economic downturn. Trend decrease illustrations Declining Bar Graph: Market Crash. This 3D bar graph, generated by AI, visually represents a sharp market decline. The red bars show a dramatic decrease in value, culminating in a broken arrow symbolizing a complete market crash. The image powerfully illustrates economic downturn.
Free with trial Seamless diagonal pattern of simple black arrows pointing down left on a minimalist white background, suggesting a descending trend or direction. Trend decrease vectors Seamless diagonal pattern of simple black arrows pointing down left on a minimalist white background, suggesting a
Free with trial Isometric bar graph with decreasing trend shows negative financial results with dollar bills and coins, representing economic downturn and financial crisis. Trend decrease vectors Isometric bar graph with decreasing trend shows negative financial results with dollar bills and coins, representing
Free with trial A stylized illustration depicts a bar chart with blue bars of varying heights against a dark blue grid background. A prominent red and yellow arrow, symbolizing a downward trend, dramatically descends across the chart. This graphic represents financial decline, market crash, economic recession, or negative growth. Its clean, vector-style design makes it suitable for presentations, reports, and articles on business, finance, and economics. Trend decrease illustrations Declining Bar Chart with Red Arrow. A stylized illustration depicts a bar chart with blue bars of varying heights against a dark blue grid background. A prominent red and yellow arrow, symbolizing a downward trend, dramatically descends across the chart. This graphic represents financial decline, market crash, economic recession, or negative growth. Its clean, vector-style design makes it suitable for presentations, reports, and articles on business, finance, and economics.
Free with trial A simple, flat design graphic illustrating a downward trend in a graph. A stylized person with flames above their head is positioned below the declining line graph, symbolizing stress, loss, or a negative impact. Suitable for presentations, articles, or social media posts related to business performance, market analysis, personal development, or any situation involving a downward trend. The flat design makes it versatile and easily adaptable for various uses. Trend decrease vectors Declining Graph with Stressed Person. A simple, flat design graphic illustrating a downward trend in a graph. A stylized person with flames above their head is positioned below the declining line graph, symbolizing stress, loss, or a negative impact. Suitable for presentations, articles, or social media posts related to business performance, market analysis, personal development, or any situation involving a downward trend. The flat design makes it versatile and easily adaptable for various uses.
Free with trial A green downward trending stock chart is displayed on an orange grid, suggesting a negative financial trend for analysis. Trend decrease illustrations Green Stock Chart with Orange Grid. A green downward trending stock chart is displayed on an orange grid, suggesting a negative financial trend for analysis
Free with trial A single, glossy, three-dimensional blue arrow points directly downwards against a clean white background. The surface of the arrow is smooth and reflective, giving it a rounded, substantial appearance. This isolated graphic is a clear indicator of direction or a downward trend. Trend decrease illustrations Glossy Blue Downward Arrow on a White Background image photo. A single, glossy, three-dimensional blue arrow points directly downwards against a clean white background. The surface of the arrow is smooth and reflective, giving it a rounded, substantial appearance. This isolated graphic is a clear indicator of direction or a downward trend
Free with trial A hand holding a piece of paper with a graph on it. The graph shows a downward trend, which could indicate a decrease in sales or a decline in a particular metric. Trend decrease illustrations A hand holding a piece of paper with a graph on it
Free with trial This vibrant illustration depicts financial growth, showcasing a dramatic upward trend after an initial decline. The 3D bar chart and upward arrow, generated by AI, symbolize overcoming challenges and achieving significant financial success. The gold coin further emphasizes the positive outcome. Trend decrease illustrations AI-Generated Financial Growth Chart. This vibrant illustration depicts financial growth, showcasing a dramatic upward trend after an initial decline. The 3D bar chart and upward arrow, generated by AI, symbolize overcoming challenges and achieving significant financial success. The gold coin further emphasizes the positive outcome.
Free with trial This image depicts a dramatic market decline, visualized as a 3D graph showing a sharp downward trend. The red color emphasizes the severity of the losses, and the detailed chart is generated by AI, offering a realistic representation of financial instability. It can be used to illustrate economic. Trend decrease illustrations Red Market Crash Graph. This image depicts a dramatic market decline, visualized as a 3D graph showing a sharp downward trend. The red color emphasizes the severity of the losses, and the detailed chart is generated by AI, offering a realistic representation of financial instability. It can be used to illustrate economic
Free with trial Abstract 3D rendering of a blue bar chart receding into the distance. The bars are arranged in descending order, suggesting a decline or downward trend. The reflective surface adds depth and visual interest, creating a clean and modern aesthetic. This image can be used to illustrate concepts such as financial downturn, market analysis, or statistical data representation. Trend decrease illustrations Abstract Blue Bar Chart. Abstract 3D rendering of a blue bar chart receding into the distance. The bars are arranged in descending order, suggesting a decline or downward trend. The reflective surface adds depth and visual interest, creating a clean and modern aesthetic. This image can be used to illustrate concepts such as financial downturn, market analysis, or statistical data representation.
Free with trial Graphic illustration of a downward trending red arrow over blue and red vertical bar graph on a light grey background. Image. Trend decrease illustrations Bar Graph with Decreasing Trend Line. Graphic illustration of a downward trending red arrow over blue and red vertical bar graph on a light grey background. Image
Free with trial A graph with a red arrow pointing upward. The graph is orange and blue. The graph is a representation of a trend or growth. Trend decrease vectors A graph with a red arrow pointing upward
Free with trial Vector icon of a downward arrow or falling graph, symbolizing financial decline, loss trends, market crash, and negative economic performance. Ideal for finance apps, investment platforms, business reports, stock market analysis, and economic infographics. Clean, impactful, and scalable for both digital and print use. Trend decrease vectors Financial Decline Trend Loss Graph Icon. Vector icon of a downward arrow or falling graph, symbolizing financial decline, loss trends, market crash, and negative economic performance. Ideal for finance apps, investment platforms, business reports, stock market analysis, and economic infographics. Clean, impactful, and scalable for both digital and print use.
Free with trial Financial chart with red and orange bars on a dark background. Concept of market crash, recession, and falling stock index. 3D Rendering. Trend decrease illustrations Financial chart displaying a downward trend with red and orange bars. 3D Rendering. Financial chart with red and orange bars on a dark background. Concept of market crash, recession, and falling stock index. 3D Rendering
Free with trial Vector illustration of a red downward trend line graph showing economic crisis, financial loss, or business decline. Concept of recession, risk, and negative performance. Trend decrease vectors Downward trend red graph illustration. Vector illustration of a red downward trend line graph showing economic crisis, financial loss, or business decline. Concept of recession, risk, and negative performance.
Free with trial A bright blue neon arrow points downwards, indicating a decreasing trend against a dark metallic background lit by spotlights, suggesting decline or loss. Trend decrease illustrations Downward Arrow Neon on Dark Background. A bright blue neon arrow points downwards, indicating a decreasing trend against a dark metallic background lit by spotlights, suggesting decline or loss
Free with trial A vibrant, glossy blue arrow curves downwards, indicating a direction or trend. The arrow is rendered in 3D and isolated on a clean white background, emphasizing its shape and reflective surface. This visual element can represent concepts like decline, progress, or a specific path. Trend decrease illustrations Glossy Blue Arrow Curving Downwards on a White Background curved. A vibrant, glossy blue arrow curves downwards, indicating a direction or trend. The arrow is rendered in 3D and isolated on a clean white background, emphasizing its shape and reflective surface. This visual element can represent concepts like decline, progress, or a specific path
Free with trial A yellow downward trending line is depicted on a dark background, suggesting a negative trend or decline in data presentation. Trend decrease illustrations Downward Chart Line on Black Background. A yellow downward trending line is depicted on a dark background, suggesting a negative trend or decline in data presentation
Free with trial A purple downward arrow signifies a decline in a modern style, suitable for demonstrating loss, decline, or economic downturn. Trend decrease illustrations Downward Trend Arrow with Glitch Effect. A purple downward arrow signifies a decline in a modern style, suitable for demonstrating loss, decline, or economic downturn
Free with trial A green, jagged arrow points downward on a blue grid background, conveying a sense of decline or decrease for visualizations. Trend decrease illustrations Downward Green Arrow on Grid Background. A green, jagged arrow points downward on a blue grid background, conveying a sense of decline or decrease for visualizations
Free with trial A bold red arrow curves downwards, indicating a trend or direction. This clean graphic is isolated on a bright surface, perfect for illustrating decline or movement. Trend decrease illustrations Red arrow pointing down on. A bold red arrow curves downwards, indicating a trend or direction. This clean graphic is isolated on a bright surface, perfect for illustrating decline or movement
Free with trial A modern flat design icon representing financial data analysis and market trends. This vector illustration features a combination of a green bar chart and a dark grey line graph, showing fluctuations in performance. An upward arrow indicates initial growth, followed by a volatile trend line symbolizing concepts like market instability, economic changes, profit and loss, or business analytics. This versatile graphic is perfect for infographics, financial reports, presentations, websites, and applications related to business, finance, statistics, and economics. Isolated on a white background for easy use. Trend decrease vectors Financial Market Fluctuation Graph Icon. A modern flat design icon representing financial data analysis and market trends. This vector illustration features a combination of a green bar chart and a dark grey line graph, showing fluctuations in performance. An upward arrow indicates initial growth, followed by a volatile trend line symbolizing concepts like market instability, economic changes, profit and loss, or business analytics. This versatile graphic is perfect for infographics, financial reports, presentations, websites, and applications related to business, finance, statistics, and economics. Isolated on a white background for easy use.
Free with trial A simple and bold blue arrow icon pointing directly downwards, isolated on a clean white background. This minimalist, flat design graphic is a versatile symbol representing concepts like downloading, decrease, reduction, decline, or moving down. It's an ideal vector-style element for user interfaces (UI), web design, mobile applications, presentations, and infographics. The clean and universally understood pictogram effectively indicates direction, a downward trend, or a call to action like 'scroll down' or 'download'. Trend decrease illustrations Blue Down Arrow Icon on White Background. A simple and bold blue arrow icon pointing directly downwards, isolated on a clean white background. This minimalist, flat design graphic is a versatile symbol representing concepts like downloading, decrease, reduction, decline, or moving down. It's an ideal vector-style element for user interfaces (UI), web design, mobile applications, presentations, and infographics. The clean and universally understood pictogram effectively indicates direction, a downward trend, or a call to action like 'scroll down' or 'download'.
Free with trial A conceptual image illustrating a decline in the cocoa market. In the foreground, a pile of raw cocoa beans sits on a white surface. Behind them, a 3D bar chart shows a steep downward trend, with tall green bars transitioning to shorter red bars, symbolizing falling prices, reduced production, or financial loss. This graphic is ideal for representing economic downturns, agricultural commodity trading, market analysis, business reports, and news related to the chocolate industry's performance, supply chain issues, or crop failure. Trend decrease illustrations Cocoa Market Decline with Beans and Graph. A conceptual image illustrating a decline in the cocoa market. In the foreground, a pile of raw cocoa beans sits on a white surface. Behind them, a 3D bar chart shows a steep downward trend, with tall green bars transitioning to shorter red bars, symbolizing falling prices, reduced production, or financial loss. This graphic is ideal for representing economic downturns, agricultural commodity trading, market analysis, business reports, and news related to the chocolate industry's performance, supply chain issues, or crop failure.
Free with trial A powerful graphic illustration captures the essence of a financial bear market. A formidable bear stands against a red backdrop as a sharp arrow trends downwards, symbolizing economic recession, stock market downturns, and the inherent risks of investment. This modern and stylized design is perfect for concepts related to financial crisis, economic challenges, and trading. Trend decrease illustrations Bear Market Trend Financial Illustration. A powerful graphic illustration captures the essence of a financial bear market. A formidable bear stands against a red backdrop as a sharp arrow trends downwards, symbolizing economic recession, stock market downturns, and the inherent risks of investment. This modern and stylized design is perfect for concepts related to financial crisis, economic challenges, and trading
Free with trial This image shows a hand-drawn graph depicting a sharp decline, generated by AI for illustrative purposes. It's a simple yet effective visual representation of negative growth or market downturn, useful for presentations or reports. Trend decrease illustrations Downward Trend on Whiteboard. This image shows a hand-drawn graph depicting a sharp decline, generated by AI for illustrative purposes. It's a simple yet effective visual representation of negative growth or market downturn, useful for presentations or reports.
Free with trial Line graph showing negative results with fire burning above it, representing financial loss. Trend decrease illustrations Graph showing negative trend with fire burning on top. Line graph showing negative results with fire burning above it, representing financial loss
Free with trial Blue arrow pointing downward next to a house outline and a coin, symbolizing a decline in housing market value. Ideal for real estate, economy, investment, finance, mortgage, crisis depreciation. A. Trend decrease illustrations Decrease in Home Value Concept with House and Falling Coin. Blue arrow pointing downward next to a house outline and a coin, symbolizing a decline in housing market value. Ideal for real estate, economy, investment, finance, mortgage, crisis depreciation. A
Free with trial A red arrow is showing the trend of the market to a downtrend. Background for the economy and data analysis. Trend decrease vectors Red Downtrend Arrow Object Abstract Background. A red arrow is showing the trend of the market to a downtrend. Background for the economy and data analysis.
Free with trial The image shows a futuristic analytics display with a stock market graph. the graph, rendered in bright green, shows a sharp downward trend, culminating in a large arrow pointing downwards, indicating a significant crash. the graph is overlaid on a grid of orange lines. the background is dark, with several screens displaying data in the distance. the word "analytics" is visible in the upper right corner, suggesting the image represents a visualization of market data and analysis during a downturn. Trend decrease illustrations Stock market crash analytics display scene. the image shows a futuristic analytics display with a stock market graph. the graph, rendered in bright green, shows a sharp downward trend, culminating in a large arrow pointing downwards, indicating a significant crash. the graph is overlaid on a grid of orange lines. the background is dark, with several screens displaying data in the distance. the word "analytics" is visible in the upper right corner, suggesting the image represents a visualization of market data and analysis during a downturn.
Free with trial A modern, colorful bar chart illustrates a downward trend in financial performance or statistical data. Trend decrease illustrations Financial Data Analysis Graph Illustration. A modern, colorful bar chart illustrates a downward trend in financial performance or statistical data
Free with trial A simple black and white graphic depicts a bar chart with decreasing bars and a downward trending arrow, indicating a decline. Trend decrease illustrations Bar chart showing downward trend and arrow. A simple black and white graphic depicts a bar chart with decreasing bars and a downward trending arrow, indicating a decline
Free with trial Green arrow pointing down representing negative trend in business. Trend decrease illustrations Long green arrow is pointing down on a white background. Green arrow pointing down representing negative trend in business
Free with trial Visualization collapsing data analytics chart illustration trend analysis, dashboard metrics, anomaly decline visualization collapsing data analytics chart. Trend decrease illustrations Visualization collapsing data analytics chart
Free with trial The image shows a downward trending line, illuminated with a bright blue glow, resembling a graph or chart. the line starts high on the left and descends diagonally to the lower right, ending in an arrow pointing downwards. the background is a dark, metallic texture, lit by several spotlights from above, creating a dramatic effect. the floor reflects the blue light, adding depth to the scene. the overall impression is one of decline or failure, possibly related to business or finance. Trend decrease illustrations Declining trend line with arrow in spotlight. the image shows a downward trending line, illuminated with a bright blue glow, resembling a graph or chart. the line starts high on the left and descends diagonally to the lower right, ending in an arrow pointing downwards. the background is a dark, metallic texture, lit by several spotlights from above, creating a dramatic effect. the floor reflects the blue light, adding depth to the scene. the overall impression is one of decline or failure, possibly related to business or finance.
Free with trial A vibrant blue neon arrow points downward, glowing intensely against a dark background. Ideal for representing decline, decrease, or negative trends in digital, technological, or futuristic designs. This 3D rendered graphic element is perfect for websites, presentations, and applications requiring a modern, impactful visual. Trend decrease illustrations Glowing neon arrow downward direction pointer. A vibrant blue neon arrow points downward, glowing intensely against a dark background. Ideal for representing decline, decrease, or negative trends in digital, technological, or futuristic designs. This 3D rendered graphic element is perfect for websites, presentations, and applications requiring a modern, impactful visual
Free with trial Three red, downward-pointing arrows are presented against a black background. Each arrow displays a white percentage symbol "%", signifying a decrease or reduction. The central arrow is larger than the two side arrows, drawing attention to the concept of percentage decline or a sale. Trend decrease illustrations Three Red Arrows With Percentage Symbols down arrows. Three red, downward-pointing arrows are presented against a black background. Each arrow displays a white percentage symbol "%", signifying a decrease or reduction. The central arrow is larger than the two side arrows, drawing attention to the concept of percentage decline or a sale
Free with trial A red line graph trends downward against a dark background, suggesting a decline or negative trend, which can be used in business presentations or financial reports. Trend decrease illustrations Decreasing Red Line Graph on Black Background. A red line graph trends downward against a dark background, suggesting a decline or negative trend, which can be used in business presentations or financial reports
Free with trial Red arrow pointing down and the word down illuminated on a digital stock ticker display, indicating a market downturn. Trend decrease illustrations Stock market crash showing downward trend on digital display. Red arrow pointing down and the word down illuminated on a digital stock ticker display, indicating a market downturn
Free with trial A red arrow zigzags downward on a blue surface, symbolizing loss or decreasing trends which can be used for business presentations and visualizations. Trend decrease illustrations Red Arrow Decreasing Trend on Blue Background. A red arrow zigzags downward on a blue surface, symbolizing loss or decreasing trends which can be used for business presentations and visualizations
Free with trial A bold, stylized arrow rendered in shades of blue with a smooth gradient, curving downwards and to the right. The arrow features a thick black outline, giving it a graphic and modern appearance. Its dynamic shape suggests movement, direction, or a downward trend. This versatile graphic is perfect for illustrating concepts like decline, progress, navigation, or data flow in presentations, websites, and marketing materials. Trend decrease vectors Dynamic Blue Downward Arrow with Gradient Effect. A bold, stylized arrow rendered in shades of blue with a smooth gradient, curving downwards and to the right. The arrow features a thick black outline, giving it a graphic and modern appearance. Its dynamic shape suggests movement, direction, or a downward trend. This versatile graphic is perfect for illustrating concepts like decline, progress, navigation, or data flow in presentations, websites, and marketing materials.
Free with trial A 3D illustration of a downwards statistic chart, isolated on white background, symbolizing decline, loss, or decrease in trends. Trend decrease illustrations Statistic down 3D illustration isolated on white background. A 3D illustration of a downwards statistic chart, isolated on white background, symbolizing decline, loss, or decrease in trends
Free with trial A 3D illustration of a downwards statistic chart, isolated on white background, symbolizing decline, loss, or decrease in trends. Trend decrease illustrations Statistic down 3D illustration isolated on white background. A 3D illustration of a downwards statistic chart, isolated on white background, symbolizing decline, loss, or decrease in trends
Free with trial Line chart going down on a website, showing a negative trend in statistics. Trend decrease illustrations Website showing a graph representing decreasing statistics. Line chart going down on a website, showing a negative trend in statistics
Free with trial Chorgic radiant sales chart in an organic style illustration growth trend, alysis data, performce metrics chorgic radiant sales chart in an organic style. Trend decrease illustrations Chorgic radiant sales chart in an organic style
Free with trial A descending bar graph with a dollar coin and downward pointing arrow signifies a decrease in the stock market, suitable for illustrating financial loss. Trend decrease illustrations Stock Market Plunge with Dollar Coin and Graph. A descending bar graph with a dollar coin and downward pointing arrow signifies a decrease in the stock market, suitable for illustrating financial loss
Free with trial A red arrow zigzags downward on a light blue surface showing a negative trend or decline, suitable for illustrating concepts related to losses or downturns. Trend decrease illustrations Red Arrow Pointing Downward on Blue Background. A red arrow zigzags downward on a light blue surface showing a negative trend or decline, suitable for illustrating concepts related to losses or downturns
Free with trial A bold red arrow illustrates a downward trend, symbolizing financial decline, market loss, or economic recession. This visual cue effectively communicates negative performance and challenges. Trend decrease illustrations Red arrow charting decline on white background. A bold red arrow illustrates a downward trend, symbolizing financial decline, market loss, or economic recession. This visual cue effectively communicates negative performance and challenges
Free with trial Bear money down graph stock market concept Vector bull with Red arrow stock price decrease. Trend decrease vectors Bear money up graph stock market concept Vector. bear money down graph stock market concept Vector bull with Red arrow stock price decrease
Free with trial A simple graphic showing a downward trend with a red line graph and several vertical bars of varying heights and colors. Trend decrease vectors Downward trending bar and line graph chart data. A simple graphic showing a downward trend with a red line graph and several vertical bars of varying heights and colors
Free with trial Silhouette figures in a line represent a decrease in population growth. A family unit in orange, depicts growth, while an orange downward trending line suggests a decline. The figures are in profile view, and stand in a straight line. A light gray or white background is used. The visual style is simple, flat, and abstract. Suitable for representing demographic trends, population studies, or. Trend decrease illustrations Decreasing population growth silhouette figures. Silhouette figures in a line represent a decrease in population growth. A family unit in orange, depicts growth, while an orange downward trending line suggests a decline. The figures are in profile view, and stand in a straight line. A light gray or white background is used. The visual style is simple, flat, and abstract. Suitable for representing demographic trends, population studies, or
Free with trial Uptrend and downtrend zigzag arrow icon in rounded corner. Increase and decrease arrows sign symbol. Trend decrease vectors Uptrend and downtrend zigzag arrow icon in rounded corner
Free with trial The image depicts a financial graph with a downward trend, represented by red and blue neon lines against a dark, textured concrete wall and floor. the graph starts high on the left and sharply declines towards the lower right, ending with a prominent red arrow pointing downwards. a spotlight from above illuminates the graph, casting shadows and highlighting the rough texture of the concrete, creating a dramatic and somber mood. the overall composition conveys a sense of economic downturn or financial loss. Trend decrease illustrations Descending financial graph on dark concrete wall. the image depicts a financial graph with a downward trend, represented by red and blue neon lines against a dark, textured concrete wall and floor. the graph starts high on the left and sharply declines towards the lower right, ending with a prominent red arrow pointing downwards. a spotlight from above illuminates the graph, casting shadows and highlighting the rough texture of the concrete, creating a dramatic and somber mood. the overall composition conveys a sense of economic downturn or financial loss.
Free with trial The image displays a downward trending blue line with a neon glow, set against a dark, brushed metallic background. the line is jagged, suggesting fluctuations or volatility in the data it represents. spotlights from above illuminate the scene, adding depth and emphasizing the downward direction of the line. the overall impression is one of decline or loss, potentially related to financial markets, performance metrics, or other data sets where a downward trend is significant. Trend decrease illustrations Decreasing blue line on dark metallic background. the image displays a downward trending blue line with a neon glow, set against a dark, brushed metallic background. the line is jagged, suggesting fluctuations or volatility in the data it represents. spotlights from above illuminate the scene, adding depth and emphasizing the downward direction of the line. the overall impression is one of decline or loss, potentially related to financial markets, performance metrics, or other data sets where a downward trend is significant.