Free with trial Businessman stick figure character in suit standing front of downward trend graph chart. concerned situation. Business failure, crisis, bankruptcy, down negative arrow. hand drawn doodle illustration. Trend decrease vectors Businessman stick figure character in suit standing front of downward trend graph chart. concerned situation. Business failure
Free with trial Declining bar chart with downward arrow indicates negative trend. Trend decrease vectors Declining bar chart with downward arrow indicates negative trend
Free with trial A conceptual infographic visually representing the economic trend of rising prices contrasted with falling income, depicted by upward and downward arrows. Trend decrease illustrations Infographic showing rising prices and falling income. A conceptual infographic visually representing the economic trend of rising prices contrasted with falling income, depicted by upward and downward arrows.
Free with trial A black framed display shows a white gridded background with a prominent red arrow depicting a sharp downward trend. The arrow is thick and three-dimensional, clearly indicating a significant decline. The display sits on a light gray surface, with a blurred cityscape visible through a window in the background. The overall mood is one of negative economic or financial news. The image is clean and, generated by AI. Trend decrease illustrations Red Downward Trending Graph on White Display Screen. A black framed display shows a white gridded background with a prominent red arrow depicting a sharp downward trend. The arrow is thick and three-dimensional, clearly indicating a significant decline. The display sits on a light gray surface, with a blurred cityscape visible through a window in the background. The overall mood is one of negative economic or financial news. The image is clean and, generated by AI.
Free with trial A vector illustration showing a magnifying glass focused on a bar graph and line chart indicating growth. The magnifying glass has a blue frame and red handle. The chart depicts an upward trend, suggesting positive business performance. This image is suitable for illustrating data analysis, business strategy, market research, and financial growth concepts. Trend decrease vectors Analyzing Growth: Magnifying Glass on Business Chart. A vector illustration showing a magnifying glass focused on a bar graph and line chart indicating growth. The magnifying glass has a blue frame and red handle. The chart depicts an upward trend, suggesting positive business performance. This image is suitable for illustrating data analysis, business strategy, market research, and financial growth concepts.
Free with trial Beige mailbox on wooden post with a declining bar graph, suggesting a decrease in mail volume or economic downturn. Image is digitally rendered. Trend decrease illustrations Beige Mailbox and Declining Bar Graph on Wooden Post. Beige mailbox on wooden post with a declining bar graph, suggesting a decrease in mail volume or economic downturn. Image is digitally rendered
Free with trial A vivid red zig-zag arrow illustrates a downward trend, symbolizing financial decline, market volatility, or negative progress. This versatile graphic is perfect for business and finance presentations. Trend decrease vectors Red zig zag arrow isolated on transparent background transparent background. A vivid red zig-zag arrow illustrates a downward trend, symbolizing financial decline, market volatility, or negative progress. This versatile graphic is perfect for business and finance presentations
Free with trial Red metallic bars show a downward trend against a colorful bokeh background. Perfect for illustrating financial reports or presentations. Trend decrease illustrations Decreasing Bar Graph Chart Showing Financial Decline. Red metallic bars show a downward trend against a colorful bokeh background. Perfect for illustrating financial reports or presentations
Free with trial Illustration of a businessman falling along a downward red arrow symbolizing economic recession. Represents financial loss, business downturn, and market challenges with bold graphic style and dynamic colors. Trend decrease illustrations Abstract businessman falling with red downward trend arrow. Illustration of a businessman falling along a downward red arrow symbolizing economic recession. Represents financial loss, business downturn, and market challenges with bold graphic style and dynamic colors
Free with trial A glossy, bright blue arrow curves downwards, indicating a negative trend or direction. Isolated on a clean white background. Trend decrease illustrations Shiny blue downward curved arrow on white background. A glossy, bright blue arrow curves downwards, indicating a negative trend or direction. Isolated on a clean white background
Free with trial This abstract chart, generated by AI, displays a downward trend using a bold red line against a backdrop of scattered points and scribbles. The image suggests a decline or negative correlation, possibly representing economic data or a conceptual illustration. The style is reminiscent of a hand-draw. Trend decrease illustrations AI-Generated Abstract Chart. This abstract chart, generated by AI, displays a downward trend using a bold red line against a backdrop of scattered points and scribbles. The image suggests a decline or negative correlation, possibly representing economic data or a conceptual illustration. The style is reminiscent of a hand-draw
Free with trial A bold red zigzag arrow descends diagonally, symbolizing a downward trend or negative movement. Trend decrease vectors Red zigzag arrow pointing downward indicating decline. A bold red zigzag arrow descends diagonally, symbolizing a downward trend or negative movement
Free with trial Chart showing downward trend with red nodes, sad face, recovery checkmark, warning alerts, and webpage visuals. Ideal for finance, business, analysis, recovery strategy monitoring evaluation. Trend decrease illustrations Negative Market Trends and Analytics with Recovery Progress Indicators. Chart showing downward trend with red nodes, sad face, recovery checkmark, warning alerts, and webpage visuals. Ideal for finance, business, analysis, recovery strategy monitoring evaluation
Free with trial A bold, glossy red arrow curves downwards, pointing sharply to the left. It signifies a downward trend or direction. Trend decrease illustrations Vibrant red downward curved arrow symbol. A bold, glossy red arrow curves downwards, pointing sharply to the left. It signifies a downward trend or direction
Free with trial A black and white icon depicting a bar chart with bars decreasing in height, indicating a significant downward trend. Trend decrease illustrations Bar chart showing a sharp decline with downward arrow. A black and white icon depicting a bar chart with bars decreasing in height, indicating a significant downward trend
Free with trial Dollar coin beside a bar graph showing downward trend under a cloud. Ideal for finance, economy, investment, loss, analytics, business performance, global market. Simple flat metaphor. Trend decrease vectors Dollar Coin and Declining Bar Graph Representing Financial Loss Concept. Dollar coin beside a bar graph showing downward trend under a cloud. Ideal for finance, economy, investment, loss, analytics, business performance, global market. Simple flat metaphor
Free with trial A stark red jagged arrow descends diagonally against a solid black background, symbolizing a sharp decline or negative trend. Trend decrease illustrations Red jagged arrow pointing downward on black background. A stark red jagged arrow descends diagonally against a solid black background, symbolizing a sharp decline or negative trend
Free with trial A bright red arrow curves downwards against a light background, symbolizing a downward movement. Trend decrease illustrations A vibrant red curved arrow points downwards indicating a decline or negative trend. A bright red arrow curves downwards against a light background, symbolizing a downward movement
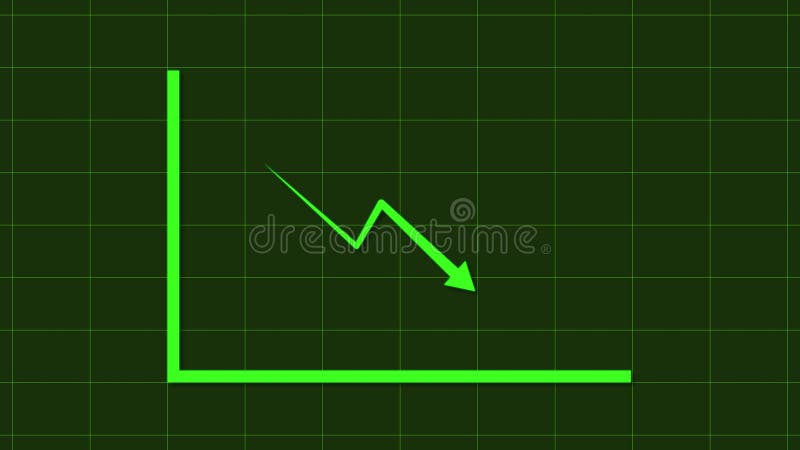
Free with trial A bright green line graph shows a downward trend with a sharp drop, set against a dark, grid-lined background. Trend decrease illustrations Green line graph illustrates sharp decline on a dark grid background. A bright green line graph shows a downward trend with a sharp drop, set against a dark, grid-lined background
Free with trial A graph with a red line trending downwards on a blue grid background with grid lines and bokeh effects. Trend decrease illustrations Graph showing a downward trend with a red line on a blue grid background. A graph with a red line trending downwards on a blue grid background with grid lines. A graph with a red line trending downwards on a blue grid background with grid lines and bokeh effects
Free with trial Stock market crash illustration with a red arrow and financial data on a white background. Concept of financial crisis and market recession. 3D Rendering. Trend decrease illustrations Stock market crash showing a falling trend with red arrow and data on white background. 3D Rendering. Stock market crash illustration with a red arrow and financial data on a white background. Concept of financial crisis and market recession. 3D Rendering
Free with trial Line icon of a flip chart showing decreasing bars, suggesting a negative trend during a business presentation. Trend decrease vectors Flip chart showing decreasing bars graphic for business presentation. Line icon of a flip chart showing decreasing bars, suggesting a negative trend during a business presentation
Free with trial A flat vector illustration depicting a business downturn and bankruptcy. A graph with a sharp downward trend terminates in a broken light bulb, symbolizing failure. Isolated on a white background for versatility. Trend decrease illustrations Dramatic Business Decline: Graph Ends in Broken Bulb Symbolizing Failure. 8k. A flat vector illustration depicting a business downturn and bankruptcy. A graph with a sharp downward trend terminates in a broken light bulb, symbolizing failure. Isolated on a white background for versatility
Free with trial A shiny barrel sits under a large blue downward arrow, symbolizing decrease. Trend decrease illustrations Metal barrel falls with a bold blue downward arrow nearby. A shiny barrel sits under a large blue downward arrow, symbolizing decrease
Free with trial A line of white cubes with black arrows pointing down and to the left, set against a bright yellow background. The arrows indicate a downward trend. Trend decrease illustrations A line of arrow cubes pointing down on yellow background. A line of white cubes with black arrows pointing down and to the left, set against a bright yellow background. The arrows indicate a downward trend
Free with trial Financial chart showing a downward trend with red and blue lines, representing market fluctuations. Dark background. Trend decrease illustrations Stock Market Chart Showing Downtrend, Red and Blue Colors. Financial chart showing a downward trend with red and blue lines, representing market fluctuations. Dark background
Free with trial A detailed financial chart is presented with numerous vertical bars and multiple overlapping line graphs in blue, white, and orange. Red and green arrows indicate downward and upward movements, respectively, with specific numerical data points displayed. The overall trend shows fluctuations but a general upward trajectory towards the right. Trend decrease illustrations Detailed Financial Chart with Upward and Downward Trends. A detailed financial chart is presented with numerous vertical bars and multiple overlapping line graphs in blue, white, and orange. Red and green arrows indicate downward and upward movements, respectively, with specific numerical data points displayed. The overall trend shows fluctuations but a general upward trajectory towards the right
Free with trial A dark icon showing a dollar sign within a circle, with a downward arrow signifying a decrease in price or value. Trend decrease vectors Dollar sign with downward arrow indicating cost reduction. A dark icon showing a dollar sign within a circle, with a downward arrow signifying a decrease in price or value
Free with trial Two bar charts are displayed side by side. One shows a clear upward trend with a green arrow, while the other shows a downward trend with a red arrow. Trend decrease illustrations Bar charts showing contrasting upward and downward trends. Two bar charts are displayed side by side. One shows a clear upward trend with a green arrow, while the other shows a downward trend with a red arrow
Free with trial A glossy, three-dimensional red arrow curves downwards, symbolizing a significant drop or negative movement. Trend decrease illustrations Bold red arrow indicates sharp decline and negative trend. A glossy, three-dimensional red arrow curves downwards, symbolizing a significant drop or negative movement
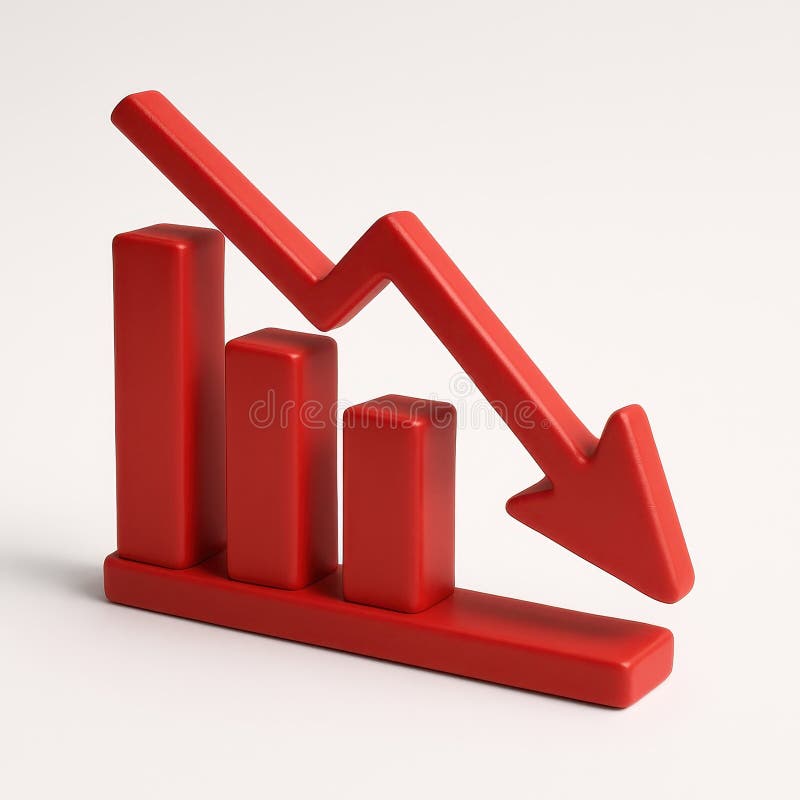
Free with trial This 3D rendering shows a bar graph with a sharp downward trend, symbolized by a large red arrow. The graph visually represents a significant decline or decrease in a particular metric. The dark red bars and bright red arrow create a strong visual impact. Trend decrease illustrations Declining Bar Graph. This 3D rendering shows a bar graph with a sharp downward trend, symbolized by a large red arrow. The graph visually represents a significant decline or decrease in a particular metric. The dark red bars and bright red arrow create a strong visual impact.
Free with trial Blue downward arrow, circular user avatar, abstract line, and curve visuals. Ideal for analytics, statistics, loss, user activity disengagement performance digital trends. Clean flat metaphor. Trend decrease illustrations Downward Arrow and User Avatar Representing Decline or Decrease in User Activity. Blue downward arrow, circular user avatar, abstract line, and curve visuals. Ideal for analytics, statistics, loss, user activity disengagement performance digital trends. Clean flat metaphor
Free with trial Description: A 3D rendering of a businessman figure presenting a bar chart showing upward growth trend on a whiteboard. The chart illustrates business success and progress. Trend decrease illustrations Businessman Presenting Positive Growth Chart on Whiteboard. Description: A 3D rendering of a businessman figure presenting a bar chart showing upward growth trend on a whiteboard. The chart illustrates business success and progress.
Free with trial A businessman in a suit draws a red downward trend line, symbolizing financial loss or economic downturn. The image conveys concepts of business, finance, and market volatility. The lighting is soft, and the composition focuses on the hand and graph. Trend decrease illustrations Businessman\'s Hand Drawing Red Downward Graph, Economic Decline Concept. A businessman in a suit draws a red downward trend line, symbolizing financial loss or economic downturn. The image conveys concepts of business, finance, and market volatility. The lighting is soft, and the composition focuses on the hand and graph
Free with trial Two bar charts, one green showing growth and one red showing decline, with trend lines and arrows. Trend decrease illustrations Bar charts showing upward and downward trends. Two bar charts, one green showing growth and one red showing decline, with trend lines and arrows
Free with trial A 3D render of a bar chart displaying a significant downward trend. Blue bars of varying heights represent data points, intersected by a sharp orange line that clearly illustrates a decline over time. The dark, reflective surface below the chart suggests a digital display or a futuristic interface. This image is ideal for representing financial losses, market crashes, performance decline, or negative trends in various industries. Trend decrease illustrations Downtrending Bar Chart with Orange Line on Dark Background. A 3D render of a bar chart displaying a significant downward trend. Blue bars of varying heights represent data points, intersected by a sharp orange line that clearly illustrates a decline over time. The dark, reflective surface below the chart suggests a digital display or a futuristic interface. This image is ideal for representing financial losses, market crashes, performance decline, or negative trends in various industries.
Free with trial Calculator alongside arrows indicating increase and decrease, and a line graph with fluctuations. Ideal for finance, budgeting, economics, analysis, statistics, decision-making, simple flat metaphor. Trend decrease illustrations Calculator with Arrows and Graph Representing Financial Analysis and Data Trends. Calculator alongside arrows indicating increase and decrease, and a line graph with fluctuations. Ideal for finance, budgeting, economics, analysis, statistics, decision-making, simple flat metaphor
Free with trial Visualizing a sharp downward trend, this graphic powerfully represents financial downturns and declining business performance, ideal for economic analyses and cautionary tales. Trend decrease vectors Dynamic chart shows steep decline impacting business growth and financial performance. Visualizing a sharp downward trend, this graphic powerfully represents financial downturns and declining business performance, ideal for economic analyses and cautionary tales
Free with trial Purple downward arrow against background of broken old computers. Decreasing market trend for outdated technology. Graph showing recession and fall. Trend decrease illustrations Purple downward arrow against background of broken old computers
Free with trial Bar graph with weather icons and rising line chart on grid backdrop. Ideal for analytics, statistics, weather data, trend analysis, business forecasting, seasonal planning. A simple flat metaphor. Trend decrease illustrations Seasonal Data Trends Displayed on Bar Graph with Line Chart and Weather Icons. Bar graph with weather icons and rising line chart on grid backdrop. Ideal for analytics, statistics, weather data, trend analysis, business forecasting, seasonal planning. A simple flat metaphor
Free with trial Downward trend graph with data points, sad face icon, and user profile silhouette. Ideal for business, economy, performance, analytics, customer satisfaction, decision-making simple flat metaphor. Trend decrease vectors Declining Business Performance Represented by Graph, Sad Face, and User Profile. Downward trend graph with data points, sad face icon, and user profile silhouette. Ideal for business, economy, performance, analytics, customer satisfaction, decision-making simple flat metaphor
Free with trial A solitary, three-dimensional red arrow points directly downwards against a plain white background. The arrow has a solid, blocky shaft and a sharp, pointed head, casting a subtle shadow. Its simple form and bold color make it a clear visual indicator of direction or a negative trend. Trend decrease illustrations 3D Rendered Red Downward Arrow on White Background direction. A solitary, three-dimensional red arrow points directly downwards against a plain white background. The arrow has a solid, blocky shaft and a sharp, pointed head, casting a subtle shadow. Its simple form and bold color make it a clear visual indicator of direction or a negative trend
Free with trial A hand manipulates a red arrow pointing downwards, superimposed on a bar graph, illustrating a market downturn. This image, generated by AI, symbolizes economic recession, financial crisis, or business failure, showcasing the impact of negative trends. Trend decrease illustrations Declining Market Trend. A hand manipulates a red arrow pointing downwards, superimposed on a bar graph, illustrating a market downturn. This image, generated by AI, symbolizes economic recession, financial crisis, or business failure, showcasing the impact of negative trends.
Free with trial This 3D rendering shows a downward trending graph, illustrating a market decline. The red arrows and translucent grid highlight the severity of the fall, generated by AI for visual representation of economic downturn. Trend decrease illustrations Declining Market Trend. This 3D rendering shows a downward trending graph, illustrating a market decline. The red arrows and translucent grid highlight the severity of the fall, generated by AI for visual representation of economic downturn.
Free with trial Red descending arrow signifies a negative trend or decrease against a clean white backdrop Use it for economic or statistical presentations. Trend decrease illustrations Red Arrow Illustrating a Decreasing Trend on a White Background. Red descending arrow signifies a negative trend or decrease against a clean white backdrop Use it for economic or statistical presentations
Free with trial Red arrow graphically illustrates a sharp downward trend against a solid blue backdrop, creating a sense of loss and decline suitable for financial and economic visualizations. Trend decrease illustrations Red Arrow Pointing Down on Blue Background Indicating Decline. Red arrow graphically illustrates a sharp downward trend against a solid blue backdrop, creating a sense of loss and decline suitable for financial and economic visualizations
Free with trial Stack of golden coins depicting a downward trend via a red arrow, conveying financial loss and market decline, set against a warm brown backdrop, for economic and investment themed content. Trend decrease illustrations Falling Golden Coins Stack with Red Arrow on Brown Background. Stack of golden coins depicting a downward trend via a red arrow, conveying financial loss and market decline, set against a warm brown backdrop, for economic and investment themed content
Free with trial Wooden numbers representing 96% are placed on a dark wooden surface, with a red downward-pointing arrow positioned beside them. Trend decrease illustrations 96% Decrease Shown with Wooden Numbers and Arrow. Wooden numbers representing 96% are placed on a dark wooden surface, with a red downward-pointing arrow positioned beside them.
Free with trial This image shows colorful financial charts and graphs, generated by AI, illustrating various data points and percentages. The overlaid arrows suggest a downward trend, potentially indicating a negative market shift or economic decline. The visual representation aids in quick understanding of compl. Trend decrease illustrations Financial Data Analysis. This image shows colorful financial charts and graphs, generated by AI, illustrating various data points and percentages. The overlaid arrows suggest a downward trend, potentially indicating a negative market shift or economic decline. The visual representation aids in quick understanding of compl
Free with trial Illustrated graphic showing downward trend with shrinking beans. Trend decrease vectors Illustrated graphic showing downward trend with shrinking beans
Free with trial Chart with downward trend, sad face indicating negative results, user profile photo with verification checkmark. Ideal for performance, feedback, user analytics, identity, emotions, progress. Trend decrease illustrations Declining Performance Chart with Sad Face and User Profile Verification Concept. Chart with downward trend, sad face indicating negative results, user profile photo with verification checkmark. Ideal for performance, feedback, user analytics, identity, emotions, progress
Free with trial This AI-generated illustration depicts the concept of deflation in economics, represented by a downward graph arrow. The monochrome design uses simple graphics to visualize the financial decline, symbolizing a negative trend in the economy. This representation effectively conveys the essence of deflation as a significant economic phenomenon. Trend decrease vectors Deflation Concept Vector Illustration with Downward Graph Arrow. This AI-generated illustration depicts the concept of deflation in economics, represented by a downward graph arrow. The monochrome design uses simple graphics to visualize the financial decline, symbolizing a negative trend in the economy. This representation effectively conveys the essence of deflation as a significant economic phenomenon.
Free with trial A bright red arrow points directly downwards towards a single gold coin embossed with a dollar sign. The coin is depicted as a shiny, metallic disc. Both the arrow and the coin are rendered in 3D and are presented on a clean white background, creating a clear visual representation of a financial decrease or cost reduction. Trend decrease illustrations Red Downward Arrow Pointing Towards a Gold Dollar Coin on White Background money currency. A bright red arrow points directly downwards towards a single gold coin embossed with a dollar sign. The coin is depicted as a shiny, metallic disc. Both the arrow and the coin are rendered in 3D and are presented on a clean white background, creating a clear visual representation of a financial decrease or cost reduction
Free with trial A hand draws a downward trending graph on a whiteboard, illustrating a market decline. This image, generated by AI, is perfect for illustrating concepts like economic downturn, market analysis, or financial forecasting. The simple yet effective visual communicates the message instantly. Trend decrease illustrations AI-Generated Market Trend. A hand draws a downward trending graph on a whiteboard, illustrating a market decline. This image, generated by AI, is perfect for illustrating concepts like economic downturn, market analysis, or financial forecasting. The simple yet effective visual communicates the message instantly.
Free with trial The "Vector Dollar Down Icon Symbol" is a graphical representation designed to indicate a decrease or downward trend related to financial aspects, specifically involving currency or value. Trend decrease vectors Vector Dollar Down Icon Symbol
Free with trial A single, glossy green arrow points directly downwards. The arrow has a rounded, smooth appearance and is rendered in 3D. It is presented on a clean white background, making it stand out as a distinct icon or symbol. The image is simple and direct, conveying a sense of direction or decrease. Trend decrease illustrations Glossy Green Downward Arrow Icon on White Background image photo. A single, glossy green arrow points directly downwards. The arrow has a rounded, smooth appearance and is rendered in 3D. It is presented on a clean white background, making it stand out as a distinct icon or symbol. The image is simple and direct, conveying a sense of direction or decrease
Free with trial This image shows a graph depicting a sharp market downturn, generated by AI. The downward trend is emphasized by large black arrows, illustrating a significant and rapid decline. The rolled-up paper suggests the ongoing nature of the crisis, implying further potential losses. Trend decrease illustrations Market Crash Visualization. This image shows a graph depicting a sharp market downturn, generated by AI. The downward trend is emphasized by large black arrows, illustrating a significant and rapid decline. The rolled-up paper suggests the ongoing nature of the crisis, implying further potential losses.
Free with trial A hand-drawn graph displays a significant downturn, visually depicting economic decline or financial loss. This simplistic illustration can be used to represent business failure, market risk, or a negative trend in various financial and economic analyses. Trend decrease illustrations Hand Drawn Graph Showing a Downturn Representing Economic Decline. A hand-drawn graph displays a significant downturn, visually depicting economic decline or financial loss. This simplistic illustration can be used to represent business failure, market risk, or a negative trend in various financial and economic analyses
Free with trial Bar graph consisting of rectangular blocks in different colors: blue, green, yellow, orange, purple, and pink, decreasing in height. Overlaying the graph is a bold, zigzagging red arrow pointing downward, representing a declining trend. The red arrow contrasts sharply with the pastel-colored bars, emphasizing a negative change or trend. Set against a white background for clarity and focus. Trend decrease illustrations Declining Trends: A Bar Graph with a Downward Red Arrow. Generative AI. Bar graph consisting of rectangular blocks in different colors: blue, green, yellow, orange, purple, and pink, decreasing in height. Overlaying the graph is a bold, zigzagging red arrow pointing downward, representing a declining trend. The red arrow contrasts sharply with the pastel-colored bars, emphasizing a negative change or trend. Set against a white background for clarity and focus.
Free with trial This image features a bold threedimensional red arrow pointing downwards set against a clean white background The arrow is centrally positioned creating a strong focal point The simple design lends itself to conveying themes of direction decrease or downward trends It could be used to illustrate concepts like loss decline or a need to move forward or downward depending on context The clean lines. Trend decrease illustrations Bright Red Arrow Pointing Down on a White Background Illustration. This image features a bold threedimensional red arrow pointing downwards set against a clean white background The arrow is centrally positioned creating a strong focal point The simple design lends itself to conveying themes of direction decrease or downward trends It could be used to illustrate concepts like loss decline or a need to move forward or downward depending on context The clean lines
Free with trial Downward blue arrow paired with stacked coins and musical notes representing revenue decline in music. Ideal for economics, music pricing, financial loss, digital sales, charts, trends, simple flat. Trend decrease vectors Declining Trend in Music Revenue Represented by Arrow, Money Coins, and Musical Notes. Downward blue arrow paired with stacked coins and musical notes representing revenue decline in music. Ideal for economics, music pricing, financial loss, digital sales, charts, trends, simple flat
Free with trial A digital screen displays a stark red line graph showing a significant downward trend. The graph is set against a grid background, emphasizing the sharp decline. The image conveys a sense of financial loss, economic downturn, or negative performance. Generated by AI. Trend decrease illustrations Digital screen displaying a sharp downward trending red line graph. A digital screen displays a stark red line graph showing a significant downward trend. The graph is set against a grid background, emphasizing the sharp decline. The image conveys a sense of financial loss, economic downturn, or negative performance. Generated by AI.
Free with trial A 3D render of a fluctuating arrow pointing down. Symbolizes financial decline, stock market loss, or a negative data trend. Ideal for business infographics. Isolated. Trend decrease illustrations 3D Arrow Down Icon for Financial Decline, Stock Market Loss, and Graph. A 3D render of a fluctuating arrow pointing down. Symbolizes financial decline, stock market loss, or a negative data trend. Ideal for business infographics. Isolated
Free with trial A simple, 3D rendered blue arrow points directly downwards against a stark white background. The arrow has rounded edges and a smooth finish, conveying a clear sense of direction or a decrease. The isolated graphic is ideal for representing negative trends, movement, or commands. Trend decrease illustrations Single Blue Downward Arrow Icon on White Background direction move. A simple, 3D rendered blue arrow points directly downwards against a stark white background. The arrow has rounded edges and a smooth finish, conveying a clear sense of direction or a decrease. The isolated graphic is ideal for representing negative trends, movement, or commands
Free with trial A striking 3D render visualizes economic decline with a vibrant red bar graph against a clean white background. This impactful image vividly represents a financial crisis and recession, showcasing a clear downward trend through its falling bars and an implied arrow. It symbolizes loss, failure, and potential bankruptcy within the business and finance sectors. Ideal for illustrating articles on the. Trend decrease illustrations Red economic decline bar graph depicting financial downfall and negative trends on white background. A striking 3D render visualizes economic decline with a vibrant red bar graph against a clean white background. This impactful image vividly represents a financial crisis and recession, showcasing a clear downward trend through its falling bars and an implied arrow. It symbolizes loss, failure, and potential bankruptcy within the business and finance sectors. Ideal for illustrating articles on the
Free with trial Abstract financial background with arrows going forward. Concept decrease. Vector illustration. Abstract background with white paper arrows. Trend decrease vectors Abstract financial background with arrows Concept decrease. Vector illustration. Abstract financial background with arrows going forward. Concept decrease. Vector illustration. Abstract background with white paper arrows.
Free with trial Illustration of a businessman in a suit falling off an upward trend line symbolizing a stock market crash or financial crisis, with a cityscape background and a red color palette. Trend decrease illustrations Businessman falling off upward trend line in a stock market crash illustration. Illustration of a businessman in a suit falling off an upward trend line symbolizing a stock market crash or financial crisis, with a cityscape background and a red color palette.
Free with trial 3d rendering of emojis with different mood placed on a blue and red graph showing decrease in customer satisfaction. Trend decrease illustrations Customer satisfaction decreasing showing by emojis on graph going downward. 3d rendering of emojis with different mood placed on a blue and red graph showing decrease in customer satisfaction
Free with trial Vector drawing illustration stacked coins and arrow trending down, decreasing statistical graphic concept, drawn in black and white color. Trend decrease vectors Vector drawn illustration black and white icon coins and down arrow trend. vector drawing illustration stacked coins and arrow trending down, decreasing statistical graphic concept, drawn in black and white color
Free with trial A hand holding a pen points at a red, downward-trending line graph, symbolizing a financial market decline. The background features a digital display of stock market data, highlighting the negative trend. The lighting and composition emphasize the concept of financial loss. Trend decrease illustrations Stock Market Downturn: Hand with Pen Pointing at Red Declining Graph. A hand holding a pen points at a red, downward-trending line graph, symbolizing a financial market decline. The background features a digital display of stock market data, highlighting the negative trend. The lighting and composition emphasize the concept of financial loss
Free with trial Bar chart with upward trend, sad face, and analytics dashboard highlights challenges in progress or data performance. Ideal for financial difficulty, business risk, loss assessment, data analysis. Trend decrease vectors Rising Bar Graph with Sad Face Symbolizing Negative Growth or Challenges in Analytics. Bar chart with upward trend, sad face, and analytics dashboard highlights challenges in progress or data performance. Ideal for financial difficulty, business risk, loss assessment, data analysis
Free with trial Red financial chart with a sharp downward trend indicating a market crash or economic decline. The graph features jagged, descending lines with timestamps labeled on the x-axis as 06 231 and 08 231. The dark background enhances the focus on the bright red line, making the steep drop in value evident. Occasional data points are highlighted with small glowing dots, emphasizing key moments. The overall design conveys a sense of urgency and loss in financial markets. Trend decrease illustrations Dramatic downward trend financial chart illustrating market crash, economic decline, and losses. Red financial chart with a sharp downward trend indicating a market crash or economic decline. The graph features jagged, descending lines with timestamps labeled on the x-axis as 06 231 and 08 231. The dark background enhances the focus on the bright red line, making the steep drop in value evident. Occasional data points are highlighted with small glowing dots, emphasizing key moments. The overall design conveys a sense of urgency and loss in financial markets.
Free with trial A red downward trending arrow is superimposed over a stack of gold bullion bars. The bars are arranged in a pyramid formation on a white background. The red arrow extends diagonally from the top of the stack towards the bottom right, indicating a decrease or decline. Gold bars symbolize wealth or financial investment, while the arrow suggests a drop in value or market trend. Trend decrease illustrations Red downward trending arrow superimposed over a stack of gold bullion bars on a white background. A red downward trending arrow is superimposed over a stack of gold bullion bars. The bars are arranged in a pyramid formation on a white background. The red arrow extends diagonally from the top of the stack towards the bottom right, indicating a decrease or decline. Gold bars symbolize wealth or financial investment, while the arrow suggests a drop in value or market trend.
Free with trial Two distinct lines illustrate a decrease and an increase, creating a dynamic contrast in shades of orange that captures attention and represents change. Trend decrease illustrations Visual Representation of Contrasting Trends With Realistic Orange Hues. Two distinct lines illustrate a decrease and an increase, creating a dynamic contrast in shades of orange that captures attention and represents change
Free with trial A collection of simple finance graphic element icons, depicting trends, charts, and money. These icons can be used to visualize various financial concepts, such as growth, decline, and investment. Trend decrease vectors Simple Style Finance Graphic Element Icons with Trend, Chart and Money. A collection of simple finance graphic element icons, depicting trends, charts, and money. These icons can be used to visualize various financial concepts, such as growth, decline, and investment.
Free with trial This image captures a sprawling urban cityscape at dusk, featuring numerous illuminated skyscrapers. A prominent red arrow graphic overlays the scene, indicating a sharp downward trend or decline. The setting sun casts a warm glow on the sky, contrasting with the cool tones of the city lights and buildings. This visual metaphor is ideal for representing financial market crashes, economic recession, business failure, or any concept of negative growth in a metropolitan context. Trend decrease illustrations Cityscape Downturn: Financial Decline Overlay on Urban Skyline at Dusk. This image captures a sprawling urban cityscape at dusk, featuring numerous illuminated skyscrapers. A prominent red arrow graphic overlays the scene, indicating a sharp downward trend or decline. The setting sun casts a warm glow on the sky, contrasting with the cool tones of the city lights and buildings. This visual metaphor is ideal for representing financial market crashes, economic recession, business failure, or any concept of negative growth in a metropolitan context.
Free with trial A chart showing a decrease with an arrow pointing down, isolated on a white background, representing a decline in data or performance. Trend decrease illustrations Decreasing chart with arrow isolated on white background. A chart showing a decrease with an arrow pointing down, isolated on a white background, representing a decline in data or performance
Free with trial Visualize impactful data with this dynamic water intensity graph, showcasing a strong downward trend over time. Perfect for illustrating progress in conservation and efficiency. Trend decrease vectors Dramatic water graph visually represents declining water intensity over time, showing efficiency gains. Visualize impactful data with this dynamic water intensity graph, showcasing a strong downward trend over time. Perfect for illustrating progress in conservation and efficiency
Free with trial A digital illustration showing a blue, dotted Earth globe overlaid with red and blue stock market trend lines, representing global market fluctuations and financial data analysis. Trend decrease illustrations Global Market Fluctuations: Red and Blue Stock Trends Over Earth Globe. A digital illustration showing a blue, dotted Earth globe overlaid with red and blue stock market trend lines, representing global market fluctuations and financial data analysis