Free with trial Graph going Up and Down sign with green and red arrows vector. Flat design vector illustration concept of sales bar chart symbol icon with arrow moving down and sales bar chart with arrow moving up. Trend decrease vectors Graph going Up and Down sign with green and red arrows vector. Flat design vector illustration concept of sales bar chart symbol. Graph going Up and Down sign with green and red arrows vector. Flat design vector illustration concept of sales bar chart symbol icon with arrow moving down and sales bar chart with arrow moving up.
Free with trial Arrow Down rubber seal stamp watermark. Icon vector symbol with grunge design and corrosion texture. Scratched red ink emblem on a white background. eps10. Trend decrease vectors Arrow Down rubber seal stamp watermark. Icon vector symbol with grunge design and corrosion texture. Scratched red ink
Free with trial Growth graph, business decline graph or diagram with arrow up, down icon design black symbol isolated on white background. Vector EPS 10. Trend decrease vectors Growth graph, business decline graph or diagram with arrow up, down icon design black symbol isolated on white background. Vector
Free with trial Eps Vector Illustration of Dotted Up Down Arrows. Trend decrease vectors Dotted Up Down Arrows
Free with trial Hand drawing a chart about employment and unemployment trends - concept image. Trend decrease illustrations Hand drawing a chart about employment and unemployment trends -
Free with trial Green, red arrows in opposite direction. Up, down and left right arrow icon set. - Royalty free vector illustration. Trend decrease vectors Green, red arrows in opposite direction. Up, down and left right
Free with trial Red down arrow icon in comics style isolated on white background. Trend decrease illustrations Red down arrow icon, comics style. Red down arrow icon in comics style isolated on white background
Free with trial Two lines are representing increasing and declining trends over a grid background, symbolizing market analysis, financial performance, or business progress. Trend decrease vectors Two lines are representing increasing and declining trends over a grid background, symbolizing market analysis
Free with trial Businessman try hard to hold on falling graph down. Business Concept. Trend decrease vectors Businessman try hard to hold on falling graph down
Free with trial Decline Graph, Chart with bars declining, Chart icon on white background. Trend decrease vectors Decline Graph, Chart with bars declining, Chart icon
Free with trial Loss bar chart icon vector, filled flat sign, solid pictogram isolated on white. Symbol, logo illustration. Pixel perfect graphics. Trend decrease vectors Loss bar chart icon vector
Free with trial Decline chart icon isolated on dark background. Simple vector logo. Trend decrease vectors Decline chart icon isolated on dark background
Free with trial Graph chart with exponential decay bars and arrows on white background. 3d illustration. Trend decrease illustrations Exponential decay decline statistical graph on white background. Graph chart with exponential decay bars and arrows on white background. 3d illustration
Free with trial The growth and decline concept with businessmen. Trend decrease illustrations The growth and decline concept with businessmen
Free with trial Decreasing stocks bars graphic icon in trendy design style. decreasing stocks bars graphic icon isolated on white background. decreasing stocks bars graphic vector icon simple and modern flat symbol. Trend decrease vectors Decreasing stocks bars graphic icon in trendy design style. decreasing stocks bars graphic icon isolated on white background.
Free with trial Flat vector illustration of global economic impacts, economy graph chart down because coronavirus. Economic recession concept because of pandemic. Trend decrease illustrations Flat vector illustration of global economic impacts, economy graph chart down because coronavirus. Economic recession concept
Free with trial Arrow graph icon, up and down. simple color vector symbol in flat style EPS10. Trend decrease vectors Arrow graph icon, up and down. simple color vector symbol in flat style
Free with trial Gray vector arrow down icon in dispersed, pixelated halftone and undamaged whole versions. Disappearing effect involves rectangle dots. Points are composed into dissolving arrow down figure. Trend decrease vectors Broken Pixel Halftone Arrow Down Icon. Gray vector arrow down icon in dispersed, pixelated halftone and undamaged whole versions. Disappearing effect involves rectangle dots. Points are composed into dissolving arrow down figure.
Free with trial Vector concept illustration of impact of coronavirus on the stock exchange and global economy. Covid-19 virus causes market fall down. Background with candlestick stock charts and viruses. Trend decrease vectors Vector concept illustration of impact of coronavirus on the stock exchange and global economy. Covid-19 virus causes market fall
Free with trial Vector concept illustration of impact of coronavirus on the stock exchange and global economy. Covid-19 virus causes market fall down. Background with candlestick stock charts and viruses. Trend decrease vectors Vector concept illustration of impact of coronavirus on the stock exchange and global economy. Covid-19 virus causes market fall
Free with trial Graph with arrow going down on screen monitor PC. vector symbol. Trend decrease illustrations Graph with arrow going down on screen monitor PC. vector symbol
Free with trial Bright Abstract purple background with white paper arrows on dark backdrop. Arrows move to back. Futuristic Vector illustration. Trend decrease vectors Bright Abstract purple background with white paper arrows on dark
Free with trial Recession concept. Falling market. The trading broker is horrified at the falling market. Financial graph down. Vector illustration flat design. Trend decrease vectors Recession concept. Falling market. Vector illustration flat design. Recession concept. Falling market. The trading broker is horrified at the falling market. Financial graph down. Vector illustration flat design.
Free with trial A striking red line graph against a dark backdrop, illustrating a stock market crash and highlighting a financial crisis. The image conveys a sense of loss and economic downturn. Trend decrease illustrations Stock market crash illustration with red line graph on a dark background depicting financial crisis concept. A striking red line graph against a dark backdrop. A striking red line graph against a dark backdrop, illustrating a stock market crash and highlighting a financial crisis. The image conveys a sense of loss and economic downturn
Free with trial Red chart Graph showing bear market with green Stop Loss line. Cut losses. Isolated on white. 3D render. Clipping path included. Trend decrease illustrations Stop-loss order chart illustration. Red chart Graph showing bear market with green Stop Loss line. Cut losses. Isolated on white. 3D render. Clipping path included.
Free with trial The concept of interest rate monitoring. Professionals analyze fluctuations in mortgage rates using a magnifying glass and charts, ensuring profitable financial decisions. Banking ideas. Flat vector. Trend decrease vectors The concept of interest rate monitoring. Flat vector. The concept of interest rate monitoring. Professionals analyze fluctuations in mortgage rates using a magnifying glass and charts, ensuring profitable financial decisions. Banking ideas. Flat vector.
Free with trial Set of 3d up down arrows in perspective. Green, red arrows. - Royalty free vector illustration. Trend decrease vectors Set of 3d up down arrows in perspective. Green, red arrows.
Free with trial Set of 3d up down arrows in perspective. Green, red arrows. - Royalty free vector illustration. Trend decrease vectors Set of 3d up down arrows in perspective. Green, red arrows.
Free with trial Graph Chart Up Down Business Declining in Pandemic Economic Recession Illustration. Trend decrease vectors Graph Chart Up Down Business Declining in Pandemic Economic Recession Illustration
Free with trial Set of Euro Coins. Money growth and downtrend concept. Blank and broken coins. Low poly, wireframe digital 3d vector illustration. Abstract polygonal image on blue neon background. Trend decrease vectors Set of Euro Coins. Money growth and downtrend concept. Blank and broken coins. Low poly, wireframe digital 3d vector illustration
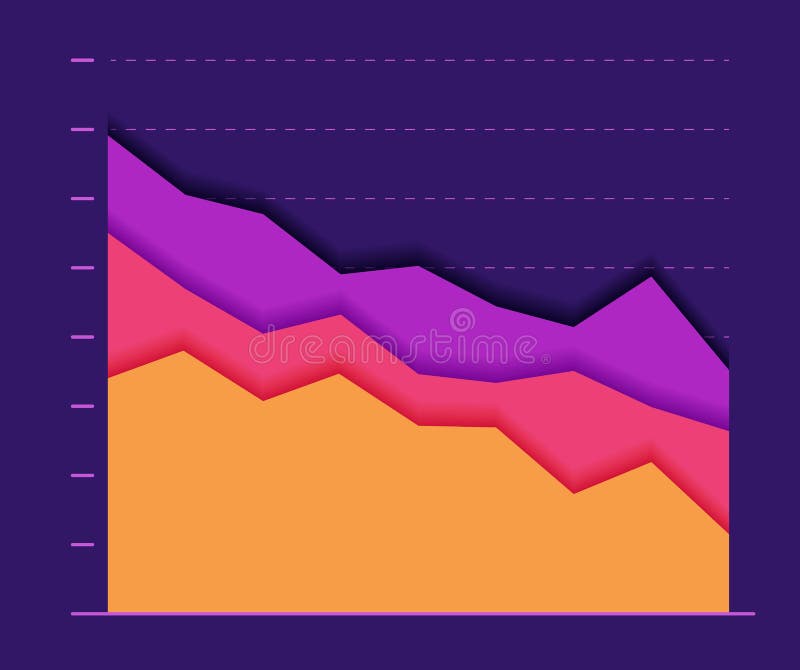
Free with trial Vector colored infographic declining production of corn - info graph in flat design with icon of flour, bowl with grains and yellow maize ear on green background. Trend decrease vectors Vector infographic declining production of corn - info graph in flat design with icon of flour, bowl with grains and yello. Vector colored infographic declining production of corn - info graph in flat design with icon of flour, bowl with grains and yellow maize ear on green background
Free with trial Missing data on analytics line graphic vector icon on white background. Flat vector missing data on analytics line graphic icon symbol sign from modern business collection for mobile concept and web. Trend decrease vectors Missing data on analytics line graphic vector icon on white background. Flat vector missing data on analytics line graphic icon
Free with trial Chart, data, graph, reports, valuation Flat Color Icon Vector. Trend decrease vectors Chart, data, graph, reports, valuation Flat Color Icon Vector
Free with trial Bar chart or bar graph decreasing vector icon with drop down arrow. Statistical data of stock, financial in business to loss, negative, decline or crisis. Graphic for report, presentation. 48x48 px. n. Trend decrease vectors Bar chart or bar graph decreasing vector icon with drop down arrow. 48x48 pixel perfect and editable stroke. Bar chart or bar graph decreasing vector icon with drop down arrow. Statistical data of stock, financial in business to loss, negative, decline or crisis. Graphic for report, presentation. 48x48 px.n
Free with trial Graph chart with exponential decay bars and arrow down on black shiny reflective background. 3d illustration. Trend decrease illustrations Exponential decay decline statistical graph on black background. Graph chart with exponential decay bars and arrow down on black shiny reflective background. 3d illustration
Free with trial Money Graphic Down icon. Monochrome design style from money collection. For UX and UI usage. Trend decrease vectors Money Graphic Down icon. Monochrome design style from money collection. For UX and UI usage
Free with trial Analytics half glyph vector icon which can easily modify or edit. Trend decrease vectors Analytics half glyph vector icon which can easily modify or edit
Free with trial Risky choice of strategy or development path,achieve high results through hard work despite obstacles,achieve your goals in a highly competitive environment,people hold letters risk in your hands. Trend decrease vectors People hold letters risk in your hands
Free with trial Missing data on analytics line graphic icon in filled, thin line, outline and stroke style. Vector illustration of two colored and black missing data on analytics line graphic vector icons designs. Trend decrease vectors Missing data on analytics line graphic icon in filled, thin line, outline and stroke style. Vector illustration of two colored and
Free with trial Charts and Diagrams icons. Report, 3D Chart, Block diagram and Dot Plot graph icons. Trend, Pyramid and Pie chart report symbols. Presentation infochart, process flow diagram. Quality set. Vector. Trend decrease vectors Charts and Diagrams icons. Set of 3D Chart, Block diagram and Dot Plot graph icons. Vector. Charts and Diagrams icons. Report, 3D Chart, Block diagram and Dot Plot graph icons. Trend, Pyramid and Pie chart report symbols. Presentation infochart, process flow diagram. Quality set. Vector
Free with trial Vector concept illustration of impact of coronavirus on the stock exchange and global economy. Covid-19 virus causes market fall down. Background with candlestick stock charts and viruses. Trend decrease vectors Vector concept illustration of impact of coronavirus on the stock exchange and global economy. Covid-19 virus causes market fall
Free with trial Graph going up and down sign with arrow vector illustration on white background. Trend decrease vectors Graph going up and down sign with arrow vector illustration
Free with trial Bar chart or bar graph decreasing vector icon with drop down arrow. Statistical data of stock, financial in business to loss, negative, decline or crisis. Graphic for report, presentation. 48x48 px. n. Trend decrease illustrations Bar chart or bar graph decreasing vector icon with drop down arrow. 48x48 pixel perfect and editable stroke. Bar chart or bar graph decreasing vector icon with drop down arrow. Statistical data of stock, financial in business to loss, negative, decline or crisis. Graphic for report, presentation. 48x48 px.n
Free with trial Bitcoin, Income money and Presentation board icons simple set. Remote work banner. Home education class. Stock analysis sign. Cryptocurrency coin, Savings, Growth chart. Business trade. Vector. Trend decrease vectors Bitcoin, Income money and Presentation board icons set. Stock analysis sign. Vector. Bitcoin, Income money and Presentation board icons simple set. Remote work banner. Home education class. Stock analysis sign. Cryptocurrency coin, Savings, Growth chart. Business trade. Vector
Free with trial Chart, data, graph, reports, valuation Icon. Line vector gray symbol for UI and UX, website or mobile application. Vector EPS10 Abstract Template background. Trend decrease vectors Chart, data, graph, reports, valuation Icon. Line vector gray symbol for UI and UX, website or mobile application
Free with trial Concept Stock Market, Investment Strategy, Market Trends, Financial News, Economic Indicators Downtrend Alert Market Plunge Indicated by Red Arrow. Trend decrease illustrations Downtrend Alert: Market Plunge Indicated by Red Arrow. Concept Stock Market, Investment Strategy. Concept Stock Market, Investment Strategy, Market Trends, Financial News, Economic Indicators Downtrend Alert Market Plunge Indicated by Red Arrow
Free with trial Volatile uncertain Bitcoin cryptocurrency up and down arrow. 3D Rendering. Trend decrease illustrations Volatile uncertain Bitcoin cryptocurrency up and down arrow. 3D Rendering
Free with trial Growth and loss arrow in white background. Trend decrease illustrations Growth and loss arrow
Free with trial Line graph, Target and Report timer icons simple set. Blog, Pie chart and Efficacy signs. Market diagram, Targeting. Education set. Line line graph icon. Editable stroke. Vector. Trend decrease vectors Line graph, Target and Report timer icons set. Blog, Pie chart and Efficacy signs. Market diagram, Targeting. Vector. Line graph, Target and Report timer icons simple set. Blog, Pie chart and Efficacy signs. Market diagram, Targeting. Education set. Line line graph icon. Editable stroke. Vector
Free with trial Business failure, company bankruptcy, stock market crash and loss trading vector graph. The concept of economic recession and crisis. Fall of world trade. Negative investment indicator down turn infographics. Trend decrease vectors Business failure, company bankruptcy, stock market crash and loss trading graph. The concept of economic recession and. Business failure, company bankruptcy, stock market crash and loss trading vector graph. The concept of economic recession and crisis. Fall of world trade. Negative investment indicator down turn infographics
Free with trial Stock market bear icon illustration graphic design. Trend decrease illustrations Stock market bear
Free with trial All of the situation in office, unique life of worker. Trend decrease illustrations Standing survive. Businessman withstand the fall of the company`s financial burden. Concept business illustration. All of the situation in office, unique life of worker
Free with trial Graph going Up and Down sign with green and red arrows vector. Flat design vector illustration concept of sales bar chart symbol icon with arrow moving down and sales bar chart with arrow moving up. Trend decrease illustrations Graph going Up and Down sign with green and red arrows vector.
Free with trial Volatile uncertain Bitcoin cryptocurrency up and down arrow. 3D Rendering. Trend decrease illustrations Volatile uncertain Bitcoin cryptocurrency up and down arrow. 3D Rendering
Free with trial Dequalizer logo design template. Down arrow blend with equalizer design concept. Explain performance degradation, losses, recession and other related. Isolated on white background. Trend decrease vectors Dequalizer logo design template. Down arrow blend with equalizer design concept. Explain performance degradation, losses
Free with trial The business concept of both crisis and recovery. Trend decrease illustrations The business concept of both crisis and recovery
Free with trial Stock market icons. Set of 10 stock market trendy minimal icons. Bear, Bull, market analysis, Stock Exchange icon. Design signs for web page, mobile app, packaging design. Vector illustration. Trend decrease vectors Stock market icons set. Stock market icons. Set of 10 stock market trendy minimal icons. Bear, Bull, market analysis, Stock Exchange icon. Design signs for web page, mobile app, packaging design. Vector illustration.
Free with trial Histogram, Artificial intelligence and Keywords signs. Chat bubbles. Online survey, Timer and Report document line icons set. Quiz test, Deadline management, Growth chart. Economic trend. Vector. Trend decrease vectors Online survey, Timer and Report document icons set. Histogram, Artificial intelligence and Keywords signs. Vector. Histogram, Artificial intelligence and Keywords signs. Chat bubbles. Online survey, Timer and Report document line icons set. Quiz test, Deadline management, Growth chart. Economic trend. Vector
Free with trial Rise icon in filled, thin line, outline and stroke style. Vector illustration of two colored and black rise vector icons designs can be used for mobile, ui, web. Trend decrease vectors Rise icon in filled, thin line, outline and stroke style. Vector illustration of two colored and black rise vector icons designs
Free with trial Straight and Down Arrow neon icon. Elements of web set. Simple icon for websites, web design, mobile app, info graphics on dark gradient background. Trend decrease illustrations Straight and Down Arrow neon icon. Elements of web set. Simple icon for websites, web design, mobile app, info graphics
Free with trial Bar chart or bar graph decreasing vector icon with drop down arrow. Statistical data of stock, financial in business to loss, negative, decline or crisis. Graphic for report, presentation. 48x48 px. n. Trend decrease vectors Bar chart or bar graph decreasing vector icon with drop down arrow. 48x48 pixel perfect and editable stroke. Bar chart or bar graph decreasing vector icon with drop down arrow. Statistical data of stock, financial in business to loss, negative, decline or crisis. Graphic for report, presentation. 48x48 px.n
Free with trial Volatile uncertain Bitcoin cryptocurrency up and down arrow. 3D Rendering. Trend decrease illustrations Volatile uncertain Bitcoin cryptocurrency up and down arrow. 3D Rendering
Free with trial Security shield with USD, growth and downtrend arrow symbols set. Low poly, wireframe digital 3d vector illustration. Abstract polygonal Money protection concept, image on blue neon background. Trend decrease vectors Security shield with USD, growth and downtrend arrow symbols set. Low poly, wireframe, digital 3d vector illustration. Abstract. Security shield with USD, growth and downtrend arrow symbols set. Low poly, wireframe digital 3d vector illustration. Abstract polygonal Money protection concept, image on blue neon background
Free with trial Arrow icons pointing left, right, up and down icon. Vector illustration. EPS 10. Stock image. Trend decrease vectors Arrow icons pointing left, right, up and down icon. Vector illustration. EPS 10.
Free with trial Vector 3d red arrow going down stock icon. Bankruptcy, financial market crash icon. Graph chart downtrend symbol. chart going down sign. Realistic 3d Vector illustration isolated on white background. Trend decrease vectors Vector 3d red arrow going down stock icon. Bankruptcy, financial market crash icon. Graph chart downtrend symbol. chart
Free with trial Reduce vector icon isolated on white background. Outline, thin line reduce icon for website design and mobile, app development. Thin line reduce outline icon vector illustration. Trend decrease vectors Reduce vector icon isolated on white background. Outline, thin line reduce icon for website design and mobile, app development.
Free with trial Abstract Paper graph color line moving down. concept of collapse and fall. Modern design graphics on dark background. Vector illustration. Trend decrease vectors Abstract Paper graph color line moving down. concept of collapse and fall.
Free with trial Set of Russian Ruble Coins. Russian money growth and downtrend. Blank and broken coins. Low poly, wireframe digital 3d vector illustration. Abstract polygonal image on blue neon background. Trend decrease vectors Set of Ruble Coins. Russian money growth and downtrend. Blank and broken coins. Low poly, wireframe digital 3d vector illustration. Set of Russian Ruble Coins. Russian money growth and downtrend. Blank and broken coins. Low poly, wireframe digital 3d vector illustration. Abstract polygonal image on blue neon background
Free with trial Chart with down arrow icon collection in glyph style, solid color vector, version 1. Trend decrease vectors Chart with down arrow icon collection in glyph style
Free with trial Abstract background of red arrow down economy crisis stock market. Trend decrease vectors Background of red arrow down economy crisis stock market
Free with trial The businessman sliding down on chair in economic crisis concept. Trend decrease illustrations The businessman sliding down on chair in economic crisis concept
Free with trial Illustration Vector Graphic of Red and Black Color Cartoon down trending icon. Trend decrease illustrations Red and Black Color Cartoon down trending icon
Free with trial Set of Russian Ruble symbols. Money tendency, capital protection with arrows of growth and downtrend. Low poly, wireframe 3d vector illustration. Abstract polygonal image on white origami background. Trend decrease vectors Set of Russian Ruble symbols. Money tendency, capital protection with arrows of growth and downtrend. Low poly, wireframe 3d
Free with trial Interest rates fluctuation symbols. Vector finance arrows. Economic indicators concept. EPS 10. Trend decrease vectors Interest rates fluctuation symbols. Vector finance arrows. Economic indicators concept.
Free with trial Trade chart, Web report and Truck delivery icons simple set. Comparison table. Pencil sign. Market data, Graph chart, Express service. Edit data. Business set. Pricing plan. Compare products. Vector. Trend decrease vectors Trade chart, Web report and Truck delivery icons set. Pencil sign. Market data, Graph chart, Express service. Vector. Trade chart, Web report and Truck delivery icons simple set. Comparison table. Pencil sign. Market data, Graph chart, Express service. Edit data. Business set. Pricing plan. Compare products. Vector
Free with trial Bear Market Concept, Investment Strategies for Economic Downturns, Stock Market, Crypto. Trend decrease illustrations Bear Market Concept, Investment Strategies for Economic Downturns, Stock Market, Crypto
Free with trial Business failure, company bankruptcy, stock market crash and loss trading vector graph. The concept of economic recession and crisis. Fall of world trade. Negative investment indicator down turn infographics. Trend decrease vectors Business failure, company bankruptcy, stock market crash and loss trading graph. The concept of economic recession and crisis. Business failure, company bankruptcy, stock market crash and loss trading vector graph. The concept of economic recession and crisis. Fall of world trade. Negative investment indicator down turn infographics
Free with trial Stock market investment trading technical analysis candlestick, bar, line and area chart set on white background. Business candle stick graph exchange trends. Trader financial investment index. Vector. Trend decrease vectors Stock market investment trading technical analysis candlestick, bar, line and area chart set on white background
Free with trial 3D Rendering of Crypto currencies market goes down concept. Glowing Bitcoin BTC on red candle stick charts with extreme price drop background. Trend decrease illustrations Crypto currencies market goes down concept. Glowing Bitcoin BTC on red candle stick charts
Free with trial Stock Market Crash icon. Outline sign from economic crisis collection. Line Stock Market Crash icon for infographics, wed design and more. Trend decrease vectors Stock Market Crash icon. Line element from economic crisis collection. Linear Stock Market Crash icon sign for web. Stock Market Crash icon. Outline sign from economic crisis collection. Line Stock Market Crash icon for infographics, wed design and more.