Free with trial 3d render illustration of United States real-estate development. Trend decrease illustrations Illustration of United States real-estate development
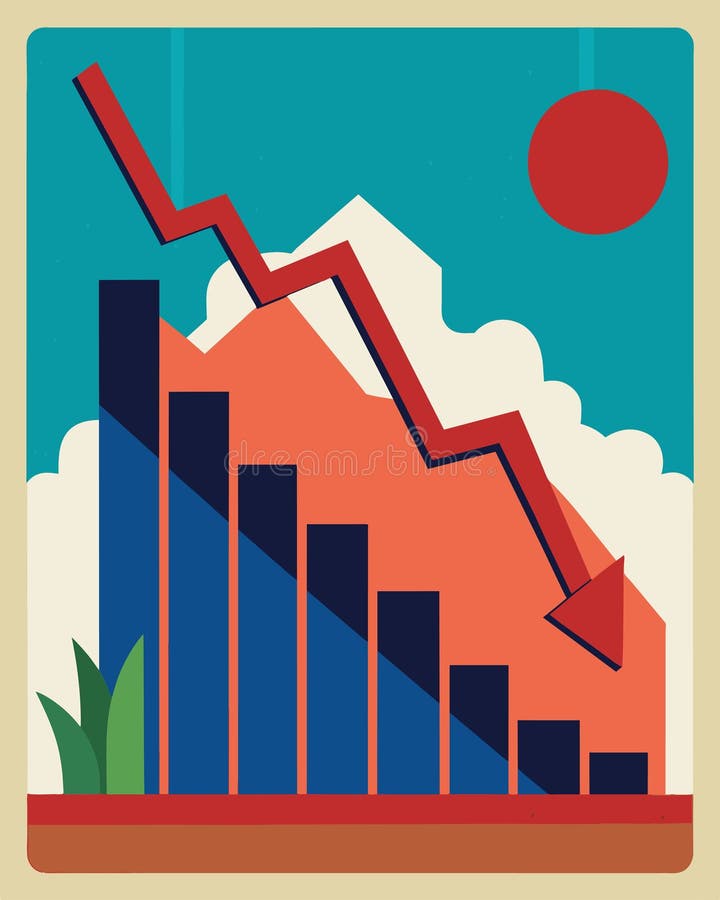
Free with trial United States economy collapse vector concept. Symbol of crisis, recession, downfall and stock market crash. Eps10 illustration. Trend decrease vectors United States economy collapse vector concept. Symbol of crisis, recession, downfall and stock market crash.
Free with trial Long term investment, budget plan icon, financial independence strategy, future profit, pension saving, retirement accumulation, vector illustration. Trend decrease vectors Distant future financial target, budget plan icon, yield money profit. Long term investment, budget plan icon, financial independence strategy, future profit, pension saving, retirement accumulation, vector illustration
Free with trial Graph going Up and Down sign with green and red arrows vector. Flat design vector illustration concept of sales bar chart symbol icon with arrow moving down and sales bar chart with arrow moving up. Trend decrease vectors Graph going Up and Down sign with green and red arrows vector. Flat design vector illustration concept of sales. Graph going Up and Down sign with green and red arrows vector. Flat design vector illustration concept of sales bar chart symbol icon with arrow moving down and sales bar chart with arrow moving up.
Free with trial Graph going up and down arrow green and red icon. The rise and fall of business, shares, prices vector desing. Trend decrease vectors Graph going up and down arrow green and red icon. The rise and fall of business, shares, prices vector
Free with trial This image depicts wheat price analysis, showcasing agricultural economics and market trends. It emphasizes crop valuation, finance, and investment strategies in detail. Trend decrease vectors Vector art of wheat price analysis a visual representation of agricultural economics and market trends with a focus on crop. This image depicts wheat price analysis, showcasing agricultural economics and market trends. It emphasizes crop valuation, finance, and investment strategies in detail
Free with trial Graph going Up and Down sign with green and red arrows vector. Flat design vector illustration concept of sales bar chart symbol icon with arrow moving down and sales bar chart with arrow moving up. Trend decrease vectors Graph going Up and Down sign with green and red arrows vector. Flat design vector illustration concept of sales bar chart symbol. Graph going Up and Down sign with green and red arrows vector. Flat design vector illustration concept of sales bar chart symbol icon with arrow moving down and sales bar chart with arrow moving up.
Free with trial The impact of Covid-19 on the stock exchange and world economy. Coronavirus hits market. Shares fall down. Economic fallout. Markets plunging. Economy vector background with covid-19. Trend decrease vectors The impact of Covid-19 on the stock exchange
Free with trial The coming crisis due to Covid-19 and the collapse of the markets, Shares fall down, Economy fallout. The impact of coronavirus on the stock exchange and the global economy. World economy. Vector. Trend decrease vectors The collapse of the markets, Shares fall down due to Covid-19. The coming crisis due to Covid-19 and the collapse of the markets, Shares fall down, Economy fallout. The impact of coronavirus on the stock exchange and the global economy. World economy. Vector
Free with trial Coronavirus crisis 2020. Coronacrisis. Conceptual visualization of a recession due to a virus. Covid-19 pandemic is affecting the global economy. Corona virus weakens economy. Vector illustration. Trend decrease vectors Coronavirus crisis 2020. Coronacrisis. Conceptual visualization of a recession due to a virus. Covid-19 pandemic is affecting the
Free with trial Coronavirus hits the market. Economy fallout. Covid-19 crisis or Coronavirus impact on the economy. Space for text. Vector background Coronavirus and market. Trend decrease vectors Coronavirus hits the market. Economy fallout. Covid-19 crisis or Coronavirus impact on the economy. Space for text.
Free with trial Down arrow icon set. Decline decrease symbol. Downward trend sign vector. Trend decrease vectors Down arrow icon set. Decline decrease symbol. Downward trend sign
Free with trial Decrease and increase chart icon with arrow. Negative and positive trend symbol illustration. Trend decrease vectors Decrease and increase chart icon with arrow. Negative and positive trend symbol
Free with trial Decline bar chart with downward trend arrow outline icon vector. Decrease, loss, and financial drop symbol in black circle. Trend decrease vectors Decline bar chart with downward trend arrow outline icon. Decrease, loss, and financial drop symbol in black circle
Free with trial A simple line graph icon showing a downward trend with two arrows and the words "DECREASE DECLINE. Trend decrease illustrations Downward Trend Graph Icon with Decrease Decline Text chart. A simple line graph icon showing a downward trend with two arrows and the words "DECREASE DECLINE
Free with trial Negative Trend Line Icon, Outline Symbol for Market Loss, Financial Decrease, Warning Indicator, Performance Decline, and Risk. Assessment. Vector Sign Icon. Trend decrease vectors Negative Trend Line Icon, Outline Symbol for Market Loss, Financial Decrease, Warning Indicator, Performance Decline, and Risk. Assessment. Vector Sign Icon
Free with trial Business growth and decline icon in black circle. Up and down trend chart symbol illustration. Increase and decrease bar graph concept. Trend decrease vectors Business growth and decline icon in black circle. Up and down trend chart symbol. Increase and decrease bar graph concept
Free with trial Down graph chart arrow drop icon. Decrease downward vector market decrease down trend. Trend decrease vectors Down graph chart arrow drop icon. Decrease downward vector market decrease down trend.
Free with trial Downward Trend Chart Illustration with Bars and Arrow Signifying Decrease Business and Finance Data. Trend decrease vectors Downward Trend Chart Illustration with Bars and Arrow Signifying Decrease Business and Finance Data
Free with trial Stock market graph loss icon graphic vector line stroke outline art, negative decrease down trend chart arrow sign symbol pictogram, economy crash indicator image clipart. Trend decrease vectors Stock market graph loss icon graphic vector line stroke outline art, negative decrease down trend chart arrow sign symbol
Free with trial A vivid red arrow signifies a downward trend or negative movement. This impactful graphic represents decline loss decrease and is ideal for illustrating financial reports or data trends. Trend decrease illustrations Bold red arrow points downward showing decline loss decrease trend direction. A vivid red arrow signifies a downward trend or negative movement. This impactful graphic represents decline loss decrease and is ideal for illustrating financial reports or data trends
Free with trial Hand drawn style bar graph displaying a continuous downward trend and data decrease arrow. Trend decrease vectors Hand drawn style bar graph displaying a continuous downward trend and data decrease arrow
Free with trial A stark bar graph illustrates a clear downward trend, symbolized by a descending arrow. This image represents decline, decrease, or negative progression in data. Trend decrease vectors Vector art of bar graph with a downward trend line indicating decline or decrease in data. A stark bar graph illustrates a clear downward trend, symbolized by a descending arrow. This image represents decline, decrease, or negative progression in data
Free with trial A shiny red arrow angled downwards signifies a decrease, decline, or negative trend. This visual cue is perfect for representing data trends, falling prices, or downward movement. Trend decrease illustrations Bright red arrow pointing downward diagonal direction symbol showing trend decrease or decline. A shiny red arrow angled downwards signifies a decrease, decline, or negative trend. This visual cue is perfect for representing data trends, falling prices, or downward movement
Free with trial Decline bar chart with downward trend arrow icon vector. Decrease, loss, and financial drop symbol. Editable stroke. Trend decrease vectors Decline bar chart with downward trend arrow icon. Decrease, loss, and financial drop symbol. Editable stroke
Free with trial Decrease and increase chart icon illustration with arrow. Negative and positive trend symbol in black circle. Trend decrease vectors Decrease and increase chart icon with arrow. Negative and positive trend symbol in black circle
Free with trial Decline bar chart with downward trend arrow icon. Decrease, loss, and financial crisis sign symbol vector. Trend decrease vectors Decline bar chart with downward trend arrow icon. Decrease, loss, and financial crisis sign symbol
Free with trial A clear vector illustration of a downward arrow icon, commonly used to symbolize download, decrease, or a negative trend. This graphic is ideal for user interfaces, data dashboards, financial reports, or instructional guides. It effectively communicates direction and change, suitable for various digital and analytical applications, vector design Generative AI. Trend decrease vectors Downward arrow icon, download, decrease, trend indicator, vector design Generative AI. A clear vector illustration of a downward arrow icon, commonly used to symbolize download, decrease, or a negative trend. This graphic is ideal for user interfaces, data dashboards, financial reports, or instructional guides. It effectively communicates direction and change, suitable for various digital and analytical applications, vector design Generative AI
Free with trial Decline bar chart with downward trend arrow outline icon vector. Decrease, loss, and financial drop symbol in circular line. Trend decrease vectors Decline bar chart with downward trend arrow outline icon. Decrease, loss, and financial drop symbol in circular line
Free with trial Decline bar chart with downward trend arrow icon vector. Decrease, loss, and financial drop symbol on black circle. Trend decrease vectors Decline bar chart with downward trend arrow icon. Decrease, loss, and financial drop symbol on black circle
Free with trial Decline bar chart with downward trend arrow icon vector. Decrease, loss, and financial crisis sign symbol inside circular outline. Trend decrease vectors Decline bar chart with downward trend arrow icon. Decrease, loss, and financial crisis sign symbol inside circular outline
Free with trial This image depicts a bold red downward zigzag arrow, which is commonly used to represent a decline, decrease, or downward trend in various contexts such as finance, data analysis, or general presentations. The arrow has a jagged path, emphasizing the irregular or fluctuating nature of the decline before reaching its final downward point. Trend decrease illustrations Red downward zigzag arrow indicating a decline or decrease trend. This image depicts a bold red downward zigzag arrow, which is commonly used to represent a decline, decrease, or downward trend in various contexts such as finance, data analysis, or general presentations. The arrow has a jagged path, emphasizing the irregular or fluctuating nature of the decline before reaching its final downward point
Free with trial A declining bar graph with a downward arrow symbolizes a negative trend, indicating a decrease in business performance, economic downturn, and potential market challenges. Trend decrease vectors Vector art of declining bar graph with downward arrow, illustrating negative trend, decrease, and economic downturn in business. A declining bar graph with a downward arrow symbolizes a negative trend, indicating a decrease in business performance, economic downturn, and potential market challenges
Free with trial A graph showing a downward trend with a red arrow pointing downwards, indicating a decline or decrease in value or quantity over time. Trend decrease illustrations Declining trend indicated by red arrow on graph showing decrease over time. A graph showing a downward trend with a red arrow pointing downwards, indicating a decline or decrease in value or quantity over time
Free with trial The image shows a bar graph with a red line indicating a downward trend. The bars decrease in height from left to right, suggesting a significant decline in the measured data over time. Trend decrease illustrations A downward trend graph illustrating a significant decrease in data over time. The image shows a bar graph with a red line indicating a downward trend. The bars decrease in height from left to right, suggesting a significant decline in the measured data over time
Free with trial The image shows a striking red zigzag arrow pointing downward, symbolizing a sharp decline or downward trend. The arrow is bold and visually emphasizes the concept of a decrease, often used in financial, economic, or performance contexts to represent falling values, losses, or negative growth. Trend decrease illustrations A bold downward zigzag arrow indicating a significant decline or decrease trend. The image shows a striking red zigzag arrow pointing downward, symbolizing a sharp decline or downward trend. The arrow is bold and visually emphasizes the concept of a decrease, often used in financial, economic, or performance contexts to represent falling values, losses, or negative growth
Free with trial Yellow business trend line graph shows financial decline, revenue decrease with white arrow pointing downward, market fall concept. Trend decrease illustrations Yellow business trend line graph shows financial decline, revenue decrease with white arrow pointing downward
Free with trial A close-up shot shows a businessman in a suit using a marker to draw a sharp downward trend line over a bar graph, symbolizing significant cost reduction and a decrease in percentage. Trend decrease illustrations Businessman drawing a downward trend graph indicating cost reduction and percentage decrease with a marker background image. A close-up shot shows a businessman in a suit using a marker to draw a sharp downward trend line over a bar graph, symbolizing significant cost reduction and a decrease in percentage
Free with trial Golden coin stacks decrease in height. Red arrow shows downward trend. Financial loss and economic downturn illustration. Minimalist design depicts, budget cut. Trend decrease illustrations Golden coin stacks decrease in height. Red arrow shows downward trend. Financial loss and economic downturn illustration.
Free with trial Bear or bearish market trend in crypto currency or stocks. Trade exchange background, down arrow graph for decrease in rates. Cryptocurrency price chart, blockchain technology. Global economy crash. , AI. Trend decrease illustrations Bear or bearish market trend in crypto currency or stocks. Trade exchange background, down arrow graph for decrease in rates.
Free with trial Bear or bearish market trend in crypto currency or stocks. Trade exchange background, down arrow graph for decrease in rates. Cryptocurrency price chart, blockchain technology. Global economy crash. , AI. Trend decrease illustrations Bear or bearish market trend in crypto currency or stocks. Trade exchange background, down arrow graph for decrease in rates.
Free with trial Bear or bearish market trend in crypto currency or stocks. Trade exchange background, down arrow graph for decrease in rates. Cryptocurrency price chart, blockchain technology. Global economy crash. , AI. Trend decrease illustrations Bear or bearish market trend in crypto currency or stocks. Trade exchange background, down arrow graph for decrease in rates.
Free with trial Bear or bearish market trend in crypto currency or stocks. Trade exchange background, down arrow graph for decrease in rates. Cryptocurrency price chart, blockchain technology. Global economy crash. , AI. Trend decrease illustrations Bear or bearish market trend in crypto currency or stocks. Trade exchange background, down arrow graph for decrease in rates.
Free with trial Bear or bearish market trend in crypto currency or stocks. Trade exchange background, down arrow graph for decrease in rates. Cryptocurrency price chart, blockchain technology. Global economy crash. , AI. Trend decrease illustrations Bear or bearish market trend in crypto currency or stocks. Trade exchange background, down arrow graph for decrease in rates.
Free with trial Bear or bearish market trend in crypto currency or stocks. Trade exchange background, down arrow graph for decrease in rates. Cryptocurrency price chart, blockchain technology. Global economy crash. , AI. Trend decrease illustrations Bear or bearish market trend in crypto currency or stocks. Trade exchange background, down arrow graph for decrease in rates.
Free with trial Bear or bearish market trend in crypto currency or stocks. Trade exchange background, down arrow graph for decrease in rates. Cryptocurrency price chart, blockchain technology. Global economy crash. , AI. Trend decrease illustrations Bear or bearish market trend in crypto currency or stocks. Trade exchange background, down arrow graph for decrease in rates.
Free with trial Bear or bearish market trend in crypto currency or stocks. Trade exchange background, down arrow graph for decrease in rates. Cryptocurrency price chart, blockchain technology. Global economy crash. , AI. Trend decrease illustrations Bear or bearish market trend in crypto currency or stocks. Trade exchange background, down arrow graph for decrease in rates.
Free with trial Bear or bearish market trend in crypto currency or stocks. Trade exchange background, down arrow graph for decrease in rates. Cryptocurrency price chart, blockchain technology. Global economy crash. , AI. Trend decrease illustrations Bear or bearish market trend in crypto currency or stocks. Trade exchange background, down arrow graph for decrease in rates.
Free with trial Generated with the use of AI. 3D graphic bar graph showing a declining trend, where the bars gradually decrease in height. The graph's surface is metallic, reflecting a somber environment. DEFLATION emphasizing economic downturn. Trend decrease illustrations 3D graphic bar graph showing a declining trend where the bars gradually decrease in height. The graphs surface is metallic. Generated with the use of AI. 3D graphic bar graph showing a declining trend, where the bars gradually decrease in height. The graph's surface is metallic, reflecting a somber environment. DEFLATION emphasizing economic downturn
Free with trial This icon represents a decrease trend with multiple arrows pointing down. Trend decrease vectors Arrows pointing down representing decrease trend icon. This icon represents a decrease trend with multiple arrows pointing down
Free with trial Down Trend Line Outline Arrow Pointing Downward Decrease Profits Sales Market Business Finance Black White Icon Sign Symbol Vector Illustration Artwork. Trend decrease vectors Down Trend Line Outline Arrow Pointing Downward Decrease Profits Sales Market Business Finance Black White Icon
Free with trial A bold red down arrow vector icon, signifying decline, decrease, or a negative trend indicator. Ideal for financial reports, data visualization, warning signs, or content highlighting reductions and downward movement. Immediately conveys negative change or direction in various contexts, vector design Generative AI. Trend decrease vectors Red Down Arrow: Decline, Decrease Negative Trend Indicator, vector design Generative AI. A bold red down arrow vector icon, signifying decline, decrease, or a negative trend indicator. Ideal for financial reports, data visualization, warning signs, or content highlighting reductions and downward movement. Immediately conveys negative change or direction in various contexts, vector design Generative AI
Free with trial Decline bar chart with downward trend arrow outline icon. Decrease, loss, and financial drop symbol vector. Trend decrease vectors Decline bar chart with downward trend arrow outline icon. Decrease, loss, and financial drop symbol
Free with trial Decline bar chart with downward trend arrow icon vector. Decrease, loss, and financial drop symbol on circle line. Trend decrease vectors Decline bar chart with downward trend arrow icon. Decrease, loss, and financial drop symbol on circle line
Free with trial Declining bar chart with downward trend line, showing decrease and financial loss. Trend decrease vectors Declining bar chart with downward trend line, showing decrease and financial loss
Free with trial Decline bar chart with downward trend arrow icon vector. Decrease, loss, and financial crisis symbol in black circle. Trend decrease vectors Decline bar chart with downward trend arrow icon. Decrease, loss, and financial crisis symbol in black circle
Free with trial Downward trend bar chart with arrow showing financial economic decline loss decrease. Trend decrease vectors Downward trend bar chart with arrow showing financial economic decline loss decrease
Free with trial Business growth and decline icon set. Up and down trend chart symbol illustration. Increase and decrease bar graph concept. Trend decrease vectors Business growth and decline icon set. Up and down trend chart symbol. Increase and decrease bar graph concept
Free with trial A visual depiction of an economic slump with a downward trend in the graph representing a decrease in consumer confidence.. Vector illustration. Trend decrease vectors A visual depiction of an economic slump with a downward trend in the graph representing a decrease in consumer
Free with trial Colorful Bar Graph Showing Decrease with a Yellow Arrow Signifying a Downward Trend in Financial Performance. Trend decrease vectors Colorful Bar Graph Showing Decrease with a Yellow Arrow Signifying a Downward Trend in Financial Performance
Free with trial Business growth and decline icon in circular outline. Up and down trend chart symbol illustration. Increase and decrease bar graph concept. Trend decrease vectors Business growth and decline icon in circular outline. Up and down trend chart symbol. Increase and decrease bar graph concept
Free with trial The image features two glossy, metallic red arrows pointing downwards against a stark black background. The arrows appear to be three dimensional with a reflective surface. They suggest a decline, decrease, or a negative trend. Trend decrease vectors Two Glossy Red Arrows Pointing Downwards on a Black Background Representing a Sharp Decrease or a Sharp Negative Trend. The image features two glossy, metallic red arrows pointing downwards against a stark black background. The arrows appear to be three dimensional with a reflective surface. They suggest a decline, decrease, or a negative trend
Free with trial Market trend icon in comic style. Decline arrow with magnifier cartoon vector illustration on isolated background. Decrease splash effect business concept. Trend decrease vectors Market trend icon in comic style. Decline arrow with magnifier cartoon vector illustration on isolated background. Decrease splash
Free with trial Headset with microphone audio decrease chart concept for support service and call center decrease, falling data information trend. Trend decrease vectors Headset with microphone audio decrease chart concept for support service and call center decrease, falling data information trend
Free with trial Downward trend, schematic chart. Declining red line graph depicting a downward trend with fluctuations, indicating decrease over time. Greatly simplified symbol of downturn, falling, and loss. Vector. Trend decrease vectors Downward trend, schematic chart, symbol of loss. Downward trend, schematic chart. Declining red line graph depicting a downward trend with fluctuations, indicating decrease over time. Greatly simplified symbol of downturn, falling, and loss. Vector
Free with trial A minimalist black and white icon featuring a lightning bolt symbol within a circle. A jagged arrow, representing a downward trend or decline, originates from the top of the circle and points towards the bottom right. The lightning bolt is positioned to the left of the arrow's path. This graphic symbolizes concepts like energy loss, power decrease, economic downturn, or a negative trend in performance. Its clean design makes it suitable for various digital and print applications. Trend decrease vectors Lightning Bolt Downward Trend Icon. A minimalist black and white icon featuring a lightning bolt symbol within a circle. A jagged arrow, representing a downward trend or decline, originates from the top of the circle and points towards the bottom right. The lightning bolt is positioned to the left of the arrow's path. This graphic symbolizes concepts like energy loss, power decrease, economic downturn, or a negative trend in performance. Its clean design makes it suitable for various digital and print applications.
Free with trial A simple black icon featuring a house symbol over a bar graph showing a downward trend, indicating a decrease in. Trend decrease illustrations Downward trend graph with house icon. A simple black icon featuring a house symbol over a bar graph showing a downward trend, indicating a decrease in.
Free with trial A minimalist, black and white graphic representing a downward trend. A thick, bold arrow points diagonally down and to the right, symbolizing a decline. Below it, a jagged, irregular line graph mirrors this downward trajectory, depicting volatility and a general decrease. This imagery is ideal for illustrating financial losses, market downturns, negative performance, or any concept of falling or decreasing values. Trend decrease vectors Down Trend Arrow and Jagged Line Graph. A minimalist, black and white graphic representing a downward trend. A thick, bold arrow points diagonally down and to the right, symbolizing a decline. Below it, a jagged, irregular line graph mirrors this downward trajectory, depicting volatility and a general decrease. This imagery is ideal for illustrating financial losses, market downturns, negative performance, or any concept of falling or decreasing values.
Free with trial Bar chart with descending bars and dashed arrow illustrating decline in value or trend analysis. Ideal for business, finance, economy, performance, forecasting, data, and growth planning. Simple flat. Trend decrease illustrations Declining Bar Chart with Dashed Arrow Representing Decrease and Trend Analysis. Bar chart with descending bars and dashed arrow illustrating decline in value or trend analysis. Ideal for business, finance, economy, performance, forecasting, data, and growth planning. Simple flat
Free with trial A financial chart illustrating a significant downward trend. The chart features two lines, one black and one bold red, both indicating a decline over time. The red line emphasizes the sharp decrease, culminating in a prominent arrow pointing downwards. The background is a simple grid, providing a clear visual representation of the data's movement. This image is suitable for illustrating concepts like market crash, economic recession, or business failure. Trend decrease vectors Downward Trend Chart. A financial chart illustrating a significant downward trend. The chart features two lines, one black and one bold red, both indicating a decline over time. The red line emphasizes the sharp decrease, culminating in a prominent arrow pointing downwards. The background is a simple grid, providing a clear visual representation of the data's movement. This image is suitable for illustrating concepts like market crash, economic recession, or business failure.
Free with trial A dark blue bar chart with four bars and a large blue downward arrow crossing through it, indicating a downward trend or decrease in value. Scalable format print and digital media. Trend decrease vectors Bar chart with downward trend line blue arrow graph statistics. A dark blue bar chart with four bars and a large blue downward arrow crossing through it, indicating a downward trend or decrease in value. Scalable format print and digital media
Free with trial The image depicts a bar graph with a downward trend. The bars, colored in various shades of blue, green, yellow, orange, and red, show a clear decrease in height from left to right. A large red arrow at the top of the graph further emphasizes the downward direction, indicating a significant decline in the data being represented. Trend decrease illustrations Decreasing trend in data. The image depicts a bar graph with a downward trend. The bars, colored in various shades of blue, green, yellow, orange, and red, show a clear decrease in height from left to right. A large red arrow at the top of the graph further emphasizes the downward direction, indicating a significant decline in the data being represented
Free with trial A bar graph with a downward trend highlighted in neon colors, illustrating a decrease in values over time. Trend decrease illustrations Graph showing a downward trend over time. A bar graph with a downward trend highlighted in neon colors, illustrating a decrease in values over time
Free with trial A bold, three-dimensional red arrow illustrates a sharp downward trend, resembling a stock market graph or financial chart. The arrow's segmented, zigzagging path signifies decline, loss, or negative performance. Isolated on a transparent background, this graphic is versatile for representing economic downturns, business failures, or any concept of decrease and regression. Trend decrease illustrations Red Arrow Graph Showing Downward Trend. A bold, three-dimensional red arrow illustrates a sharp downward trend, resembling a stock market graph or financial chart. The arrow's segmented, zigzagging path signifies decline, loss, or negative performance. Isolated on a transparent background, this graphic is versatile for representing economic downturns, business failures, or any concept of decrease and regression.
Free with trial The image depicts a downward trending arrow over a triangular base, symbolizing a decline or decrease. The arrow starts at a higher point and descends, indicating a negative trend or downward movement. This could represent various concepts such as a drop in stock prices, a decline in sales, or a reduction in any measurable metric. Trend decrease vectors Downward trend indicating decline. The image depicts a downward trending arrow over a triangular base, symbolizing a decline or decrease. The arrow starts at a higher point and descends, indicating a negative trend or downward movement. This could represent various concepts such as a drop in stock prices, a decline in sales, or a reduction in any measurable metric
Free with trial A vibrant pink 3D bar chart illustrates financial data with a prominent downward-trending arrow superimposed. The bars decrease in height from left to right, signifying a decline. An upward-pointing arrow is positioned at the top left, indicating a contrasting upward trend. The graphic is isolated on a white background, making it suitable for presentations on financial performance, market trends,. Trend decrease illustrations 3D Pink Bar Chart with Downward Trend Arrow and Upward Trend Arrow graph statistics. A vibrant pink 3D bar chart illustrates financial data with a prominent downward-trending arrow superimposed. The bars decrease in height from left to right, signifying a decline. An upward-pointing arrow is positioned at the top left, indicating a contrasting upward trend. The graphic is isolated on a white background, making it suitable for presentations on financial performance, market trends,
Free with trial A 3D rendered bar chart illustrating a significant downward trend. Three blue, rounded bars are displayed on a clean white background with subtle grid lines. A prominent, bold red arrow sharply descends across the bars, clearly indicating a decline, decrease, or negative progression. This graphic is ideal for representing financial losses, market downturns, business challenges, economic recession, or any statistical data showing a negative trend. It conveys concepts of risk, failure, and reduction in a clear, impactful visual manner for presentations, reports, and analytical content. Trend decrease vectors Downward Trend Bar Chart with Red Arrow. A 3D rendered bar chart illustrating a significant downward trend. Three blue, rounded bars are displayed on a clean white background with subtle grid lines. A prominent, bold red arrow sharply descends across the bars, clearly indicating a decline, decrease, or negative progression. This graphic is ideal for representing financial losses, market downturns, business challenges, economic recession, or any statistical data showing a negative trend. It conveys concepts of risk, failure, and reduction in a clear, impactful visual manner for presentations, reports, and analytical content.
Free with trial An illustrative bar graph on a dark purple background depicts a clear downward trend using yellow bars and a prominent descending arrow. The text "Debt Reduction" is displayed below the chart. This visual metaphor effectively represents the successful management and decrease of financial obligations, highlighting progress in financial health. It is ideal for use in financial planning, economic reports, personal finance articles, business presentations, or any content related to improving financial stability and reducing liabilities. The clean, flat design makes it versatile for various digital and print media. Trend decrease vectors Debt Reduction Bar Graph with Downward Trend. An illustrative bar graph on a dark purple background depicts a clear downward trend using yellow bars and a prominent descending arrow. The text "Debt Reduction" is displayed below the chart. This visual metaphor effectively represents the successful management and decrease of financial obligations, highlighting progress in financial health. It is ideal for use in financial planning, economic reports, personal finance articles, business presentations, or any content related to improving financial stability and reducing liabilities. The clean, flat design makes it versatile for various digital and print media.
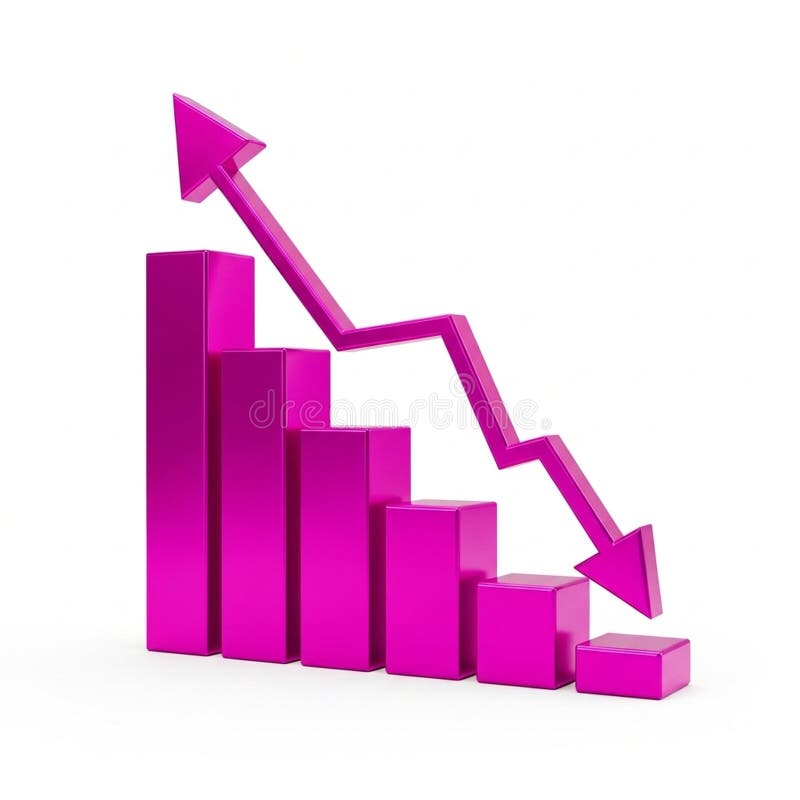
Free with trial A 3D bar chart rendered in a vibrant pink color illustrates a significant downward trend. The bars decrease in height from left to right, culminating in a very short bar. A bold pink arrow, also in 3D, starts high on the left and sharply descends to the right, mirroring the decline shown by the bars. The entire graphic is isolated on a clean white background. Trend decrease illustrations Pink 3D Bar Chart Showing a Downward Trend with an Arrow graph decline. A 3D bar chart rendered in a vibrant pink color illustrates a significant downward trend. The bars decrease in height from left to right, culminating in a very short bar. A bold pink arrow, also in 3D, starts high on the left and sharply descends to the right, mirroring the decline shown by the bars. The entire graphic is isolated on a clean white background