Free with trial Nasdaq index falling showing a stock market crash with rain drops on a reflective surface. Trend decrease illustrations Stock market crashing with nasdaq index falling displayed on a screen. Nasdaq index falling showing a stock market crash with rain drops on a reflective surface
Free with trial Illustration of a distressed cartoon businessman in a suit holding his head, surrounded by financial symbols, a red graph showing a decline, and currency. Represents financial stress, crisis, and business problems. Trend decrease illustrations Stressed cartoon businessman holding head with financial downturn concept. Illustration of a distressed cartoon businessman in a suit holding his head, surrounded by financial symbols, a red graph showing a decline, and currency. Represents financial stress, crisis, and business problems.
Free with trial Uptrend and downtrend arrow icon in generic style. Zigzag arrows illustration concept. Trend decrease vectors Uptrend and downtrend arrow icon in generic style. Zigzag arrows concept. Uptrend and downtrend arrow icon in generic style. Zigzag arrows illustration concept
Free with trial Abstract digital red arrows with sharp edges falling downward, representing negative trend, collapse, market risk, recession, and downturn in global finance and economy. Trend decrease illustrations Glowing square edge red arrows pointing down on dark background, symbolizing stock crash, business loss, economic decline, and. Abstract digital red arrows with sharp edges falling downward, representing negative trend, collapse, market risk, recession, and downturn in global finance and economy
Free with trial Line art style icon of a smartphone displaying a decreasing graph, representing negative market trends. Trend decrease vectors Smartphone showing decreasing graph icon outline vector. Line art style icon of a smartphone displaying a decreasing graph, representing negative market trends
Free with trial High Dollar Symbol, Dollar price high, Price increase icon, rising commodity prices, interest rate increase, high inflation, financial growth web design. Trend decrease vectors High Dollar Symbol, Dollar price high, Price increase icon, rising commodity prices
Free with trial An illustration of an aerial view of a descending graph. Trend decrease illustrations AI generated illustration of an aerial view of a descending graph. An illustration of an aerial view of a descending graph
Free with trial A wooden block with a dollar sign on top of a stack of coins with a red down arrow. This image symbolizes a decline in value and can be used to illustrate financial trends, economic recession, or other concepts related to money and investment. Trend decrease illustrations Dollar Sign on Wooden Block on Stack of Coins with Down Arrow. A wooden block with a dollar sign on top of a stack of coins with a red down arrow. This image symbolizes a decline in value and can be used to illustrate financial trends, economic recession, or other concepts related to money and investment
Free with trial Male avatar in a circle next to a declining bar chart. Ideal for progress, profile data, analytics, user stats, report analysis, business performance, visualization. Simple flat metaphor. Trend decrease illustrations Profile Avatar with Bar Chart Representing Performance and Analytics Data. Male avatar in a circle next to a declining bar chart. Ideal for progress, profile data, analytics, user stats, report analysis, business performance, visualization. Simple flat metaphor
Free with trial Business Metrics Concept: Churn Rate with Cube Beads and Blurred Graph. Trend decrease illustrations Business Metrics Concept: Churn Rate with Cube Beads and Blurred Graph
Free with trial A magnifying glass focuses on a digital graph featuring red and orange declining bars and lines, indicating stock market trends. The surrounding environment is filled with digital screens displaying similar financial data, creating an intense, analytical atmosphere. The image highlights the detailed examination of market fluctuations, with vibrant colors contrasting against a computerized background to emphasize the importance of precision in financial analysis. Trend decrease illustrations Stock Market Analysis: Magnifying Glass On Declining Graph. A magnifying glass focuses on a digital graph featuring red and orange declining bars and lines, indicating stock market trends. The surrounding environment is filled with digital screens displaying similar financial data, creating an intense, analytical atmosphere. The image highlights the detailed examination of market fluctuations, with vibrant colors contrasting against a computerized background to emphasize the importance of precision in financial analysis.
Free with trial Red downward arrow symbolizing decline on a black background. High Quality. Trend decrease illustrations Red downward arrow symbolizing decline on a black background
Free with trial Closeup of male hand analyzing financial graph with stylus. Trend decrease illustrations Closeup of male hand analyzing financial graph with stylus
Free with trial Download progress, time running out, sand flowing downward. Simple, clean vector icon. Trend decrease vectors Hourglass Icon Downloading Process, Time Management Symbol. Download progress, time running out, sand flowing downward. Simple, clean vector icon.
Free with trial An illustration depicts a downturn in business. Decreasing bar chart represented in blue, yellow and red. A black arrow points downwards showing negative growth, placed over a bright white background. Trend decrease illustrations Falling Chart with a Decreasing Arrow on a White Background. An illustration depicts a downturn in business. Decreasing bar chart represented in blue, yellow and red. A black arrow points downwards showing negative growth, placed over a bright white background.
Free with trial Infographic, chart icon with arrow. Vector illustration. EPS 10. Stock image. Trend decrease vectors Infographic, chart icon with arrow. Vector illustration. EPS 10.
Free with trial Red to green arrow represents both positive and negative trends within one visual element Perfect for illustrating financial or economic concepts. Trend decrease illustrations Directional Arrow Showing Up and Down Growth in Red and Green. Red to green arrow represents both positive and negative trends within one visual element Perfect for illustrating financial or economic concepts
Free with trial Falling interest rates concept, with stacked coins and a percentage sign alongside a red downward arrow. Trend decrease illustrations Declining interest rates with coins and percentage symbol. Falling interest rates concept, with stacked coins and a percentage sign alongside a red downward arrow.
Free with trial A businessman in a suit points to a red, downward-trending graph, symbolizing financial decline or economic downturn. The image conveys concepts of loss, risk, and market instability. The composition uses a shallow depth of field. Trend decrease illustrations Businessman\'s Hand Pointing Downward on Red Declining Financial Graph. A businessman in a suit points to a red, downward-trending graph, symbolizing financial decline or economic downturn. The image conveys concepts of loss, risk, and market instability. The composition uses a shallow depth of field
Free with trial A businessman's hand gestures towards a red, downward-trending financial graph, symbolizing economic decline. The image conveys concepts of loss, failure, and financial instability. The lighting is soft, with a shallow depth of field. Trend decrease illustrations Businessman\'s Hand Pointing Downward at Red Declining Financial Graph. A businessman's hand gestures towards a red, downward-trending financial graph, symbolizing economic decline. The image conveys concepts of loss, failure, and financial instability. The lighting is soft, with a shallow depth of field
Free with trial A glossy red 3D arrow charts a jagged downward path, symbolizing economic crisis, stock market crash, or business failure against a dark, minimalist background. Trend decrease illustrations Glossy Red Jagged Arrow Charting a Steep Financial Decline. A glossy red 3D arrow charts a jagged downward path, symbolizing economic crisis, stock market crash, or business failure against a dark, minimalist background.
Free with trial A simple graphic showing various data representation methods including bar, line, and pie charts in a monochrome style. Trend decrease vectors Black and White Data Visualization Charts Bar Graph, Line Graph, and Pie Charts. A simple graphic showing various data representation methods including bar, line, and pie charts in a monochrome style
Free with trial A close-up, angled perspective of several printed business reports displaying a variety of financial data. The documents feature colorful pie charts, blue bar graphs, and line graphs tracking performance and statistics. This image is perfect for illustrating concepts such as data analysis, market research, financial planning, investment strategy, and corporate performance review. The detailed charts and figures represent the core of business analytics, accounting, and economic forecasting, making it a versatile background for financial presentations and articles. Trend decrease illustrations Business Analytics Report with Financial Charts and Graphs. A close-up, angled perspective of several printed business reports displaying a variety of financial data. The documents feature colorful pie charts, blue bar graphs, and line graphs tracking performance and statistics. This image is perfect for illustrating concepts such as data analysis, market research, financial planning, investment strategy, and corporate performance review. The detailed charts and figures represent the core of business analytics, accounting, and economic forecasting, making it a versatile background for financial presentations and articles.
Free with trial Abstract digital falling arrows in red light, representing decline, failure, stock crash, inflation, or recession concept for finance, investment, and economic risk analysis. Trend decrease illustrations Red glowing arrows pointing downward with zigzag lines on dark background, symbolizing financial crisis, market crash, negative. Abstract digital falling arrows in red light, representing decline, failure, stock crash, inflation, or recession concept for finance, investment, and economic risk analysis
Free with trial Snowflake connected to decreasing bar chart indicating winter themes, seasonal decline, or data trends. Ideal for weather, climate change, business analytics, forecasting, cold storage, performance. Trend decrease illustrations Snowflake and Bar Chart Representing Seasonal Trends and Data Analysis Concepts. Snowflake connected to decreasing bar chart indicating winter themes, seasonal decline, or data trends. Ideal for weather, climate change, business analytics, forecasting, cold storage, performance
Free with trial A vibrant 3D rendered image featuring a large, stylized arrow pointing downwards, outlined with bright blue and pink neon lights. The arrow stands on a dark, textured floor, from which glowing parallel lines of similar neon hues extend into the distance, creating a sense of depth and direction. This modern and futuristic graphic is ideal for concepts related to download, direction, data flow, decline, or digital navigation. Generated by AI. Trend decrease illustrations Neon Down Arrow and Glowing Lines on Dark Textured Surface. A vibrant 3D rendered image featuring a large, stylized arrow pointing downwards, outlined with bright blue and pink neon lights. The arrow stands on a dark, textured floor, from which glowing parallel lines of similar neon hues extend into the distance, creating a sense of depth and direction. This modern and futuristic graphic is ideal for concepts related to download, direction, data flow, decline, or digital navigation. Generated by AI
Free with trial The character is hanging on a falling red arrow. Space for text. Trend decrease illustrations The character is hanging on a falling red arrow. Space for text.
Free with trial Declining fuel prices are visually represented by a downward red arrow intersecting a falling bar graph and a red dispenser suggesting financial relief and market trends Use for economic reports. Trend decrease illustrations Fuel Price Decreasing Concept with Red Arrow and Dispenser. Declining fuel prices are visually represented by a downward red arrow intersecting a falling bar graph and a red dispenser suggesting financial relief and market trends Use for economic reports
Free with trial A minimal, simple line style illustration of a decreasing bar chart with an arrow pointing downwards, indicating a decline or loss. Perfect for business, finance, and economic themes. Trend decrease vectors Simple Line Style Decreasing Bar Chart with Arrow Sign Icon. A minimal, simple line style illustration of a decreasing bar chart with an arrow pointing downwards, indicating a decline or loss. Perfect for business, finance, and economic themes.
Free with trial Market Analysis: Churn Rate Depicted with Beads and Graph Representation. Trend decrease illustrations Market Analysis: Churn Rate Depicted with Beads and Graph Representation
Free with trial A vibrant red 3D bar chart on a white background shows a steady, dramatic decline, symbolizing financial loss, recession, or negative business results. Trend decrease illustrations Stark Red 3D Bar Graph Descending Sharply, Isolated on White. A vibrant red 3D bar chart on a white background shows a steady, dramatic decline, symbolizing financial loss, recession, or negative business results.
Free with trial Illustration showing stacks of coins decreasing in height with a downward trending yellow arrow on a teal background. Image. Trend decrease illustrations Declining Stacks of Coins Below Downward Arrow Illustration. Illustration showing stacks of coins decreasing in height with a downward trending yellow arrow on a teal background. Image
Free with trial Gold coin with arrows pointing up and down, symbolizing the fluctuating nature of money and investments. Trend decrease vectors Gold coin with arrows pointing up and down indicating price fluctuation. Gold coin with arrows pointing up and down, symbolizing the fluctuating nature of money and investments
Free with trial A downward trending graph chart isolated on a white background, perfect for financial analysis. Trend decrease illustrations Downward graph chart. A downward trending graph chart isolated on a white background, perfect for financial analysis
Free with trial Conceptual graphic of a productivity decline. A blue bar chart shows decreasing values with a downward arrow indicating failure, crisis, and poor business performance. Trend decrease illustrations Decreasing Productivity Bar Chart with Downward Trend Arrow. Conceptual graphic of a productivity decline. A blue bar chart shows decreasing values with a downward arrow indicating failure, crisis, and poor business performance
Free with trial Up and Down Arrows Contrasting Trends Symbolizing Fluctuations. Trend decrease vectors Up and Down Arrows Contrasting Trends Symbolizing Fluctuations
Free with trial A blue arrow points down over shiny coins, indicating a financial drop. Trend decrease illustrations Blue arrow shows decline over golden coins in modern setting. A blue arrow points down over shiny coins, indicating a financial drop
Free with trial A finger points at stock market data displayed on a bright screen, offering a close-up view, suitable for investment or technology concepts. Trend decrease illustrations Analyzing Stock Market Data on a Screen with Fingertip Touch. A finger points at stock market data displayed on a bright screen, offering a close-up view, suitable for investment or technology concepts
Free with trial Uptrend and downtrend arrow line icon on square line. Statistic sign symbol illustration. Trend decrease vectors Uptrend and downtrend arrow line icon on square line. Statistic sign symbol
Free with trial Downward arrow with SALE, analytics dashboard, and a cloud icon. Ideal for ecommerce, marketing, analysis, cloud services, business strategy, financial review simple landing page. Trend decrease vectors Sales Decline with Data Analytics and Cloud Connectivity for Business Insights. Downward arrow with SALE, analytics dashboard, and a cloud icon. Ideal for ecommerce, marketing, analysis, cloud services, business strategy, financial review simple landing page
Free with trial A grid of black icons representing various types of graphs and charts, including bar graphs and line graphs with upward arrows, on a white background. Trend decrease vectors Collection of Ai-Generated black and white graph and chart icons. A grid of black icons representing various types of graphs and charts, including bar graphs and line graphs with upward arrows, on a white background
Free with trial Declining financial data graph with decreasing bars and arrow. Trend decrease vectors Declining financial data graph with decreasing bars and arrow
Free with trial This 3D rendering shows a red pie chart broken into numerous pieces, one segment clearly separated. Illustrates concepts of division, fragmentation, or a disrupted system. Ideal for presentations. Trend decrease illustrations Broken Red Pie Chart: 3D Render of a Cracked Circular Diagram. This 3D rendering shows a red pie chart broken into numerous pieces, one segment clearly separated. Illustrates concepts of division, fragmentation, or a disrupted system. Ideal for presentations.
Free with trial A collection of hand-drawn bar chart icons with upward and downward arrows, representing financial growth and decline. Trend decrease vectors Hand-drawn bar chart with up and down arrows .Vector illustration. A collection of hand-drawn bar chart icons with upward and downward arrows, representing financial growth and decline
Free with trial Red stock market chart showing decreasing values, concept of financial crisis and economic recession. Trend decrease illustrations Stock market crash showing decreasing values with red numbers. Red stock market chart showing decreasing values, concept of financial crisis and economic recession
Free with trial Bear and Bull Stare Down in Digital Light, Market Competition , dynamic flow. Trend decrease illustrations Bear and Bull Stare Down in Digital Light, Market Competition
Free with trial Red bar graph decreasing with blue arrow representing a loss in business, sales, jobs, or other financial loss. Trend decrease vectors Red bar graph decreasing with blue arrow representing a loss in business
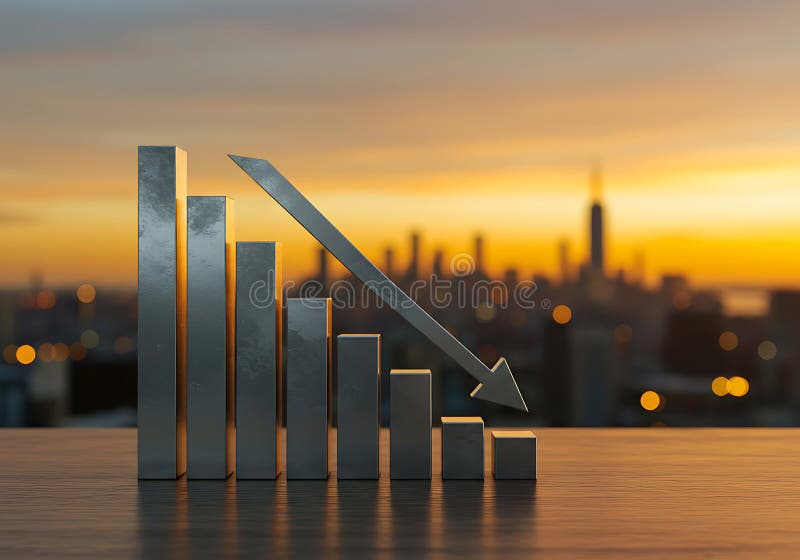
Free with trial 3D Bar Chart Visualizing Business Performance Decline Trends - Business performance decline shown with a 3D bar chart to analyze negative trends. Trend decrease illustrations 3D Bar Chart Visualizing Business Performance Decline Trends
Free with trial An abstract and futuristic digital visualization of financial data, featuring glowing blue bar charts and candlestick patterns reflecting on a sleek, dark surface. The dynamic composition, set against a deep blue background with subtle grid lines, evokes concepts of technology, business growth, and market analysis. Ideal for illustrating topics related to stock market trends, investment strategies, economic reports, big data analytics, and the future of finance in a modern, high-tech context. Trend decrease illustrations Futuristic Digital Finance Chart with Glowing Blue Data Bars. An abstract and futuristic digital visualization of financial data, featuring glowing blue bar charts and candlestick patterns reflecting on a sleek, dark surface. The dynamic composition, set against a deep blue background with subtle grid lines, evokes concepts of technology, business growth, and market analysis. Ideal for illustrating topics related to stock market trends, investment strategies, economic reports, big data analytics, and the future of finance in a modern, high-tech context.
Free with trial Falling stock prices on the nasdaq exchange during trading session, indicating a potential market crash. Trend decrease illustrations Nasdaq stock market crashing showing falling values during trading session. Falling stock prices on the nasdaq exchange during trading session, indicating a potential market crash
Free with trial A 3D isometric bar chart displaying colorful bars of varying heights on a blue grid base, representing data analysis and business growth, isolated on white. Trend decrease illustrations 3d bar chart with colorful bars isolated on white background. A 3D isometric bar chart displaying colorful bars of varying heights on a blue grid base, representing data analysis and business growth, isolated on white
Free with trial A vibrant red, three-dimensional arrow dramatically points downwards against a dark gray background, symbolizing decline or loss. The glossy surface and sharp angles create a striking visual. Trend decrease illustrations Glossy Red 3D Arrow Pointing Downward: Dramatic Decline Visual. A vibrant red, three-dimensional arrow dramatically points downwards against a dark gray background, symbolizing decline or loss. The glossy surface and sharp angles create a striking visual.
Free with trial A 3D composition featuring a red triangular warning sign with an exclamation mark, a golden dollar coin, and a purple downward-pointing arrow, symbolizing financial risk or economic downturn. Trend decrease illustrations 3d warning sign, dollar coin, and down arrow isolated on white. A 3D composition featuring a red triangular warning sign with an exclamation mark, a golden dollar coin, and a purple downward-pointing arrow, symbolizing financial risk or economic downturn
Free with trial This image displays a dynamic business analytics dashboard featuring both bar and line graphs. The bar chart illustrates varying percentages (15%, 50%, 75%, 85%), suggesting performance metrics or growth stages. The line chart, with its intersecting blue lines and data points, represents trends, fluctuations, and comparisons over time or across different categories. The clean, modern design makes it ideal for financial reports, business presentations, and data visualization concepts. Trend decrease illustrations Business Growth and Performance Analysis with Bar and Line Charts. This image displays a dynamic business analytics dashboard featuring both bar and line graphs. The bar chart illustrates varying percentages (15%, 50%, 75%, 85%), suggesting performance metrics or growth stages. The line chart, with its intersecting blue lines and data points, represents trends, fluctuations, and comparisons over time or across different categories. The clean, modern design makes it ideal for financial reports, business presentations, and data visualization concepts.
Free with trial Financial business concept going bankrupt flat vector design. design vector illustration. Trend decrease vectors Finance flat concept going bankrupt vector design illustration. financial business concept going bankrupt flat vector design.design vector illustration
Free with trial Growth and declining graph bar icon with flat rounded cartoon style. Charts with bar growth and declining. Graph trending upwards arrow and downwards arrow. Eps 10 vector illustration. Trend decrease vectors Growth and declining graph bar icon with flat rounded cartoon style
Free with trial Two burning candles on dark surface with red stock market graph, high-resolution background Generative AI. Trend decrease illustrations Two burning candles on dark surface with red stock market graph
Free with trial This is an illustration of an arrow pointing down to the right (down mark). Trend decrease vectors Illustration of a downward arrow (down mark) on the right shoulder. This is an illustration of an arrow pointing down to the right (down mark).
Free with trial Generative ai, The image shows a red graph with a large red arrow pointing down, indicating a decline in value. Trend decrease illustrations A red arrow pointing downwards over a red grid chart with red bars on the. generative ai, The image shows a red graph with a large red arrow pointing down, indicating a decline in value
Free with trial Digital representation of a stock market crash with red graph lines descending and the word 'crash' highlighted, symbolizing financial decline and economic crisis - generated AI. Trend decrease illustrations Stock market crash concept with red declining graph. Digital representation of a stock market crash with red graph lines descending and the word 'crash' highlighted, symbolizing financial decline and economic crisis - generated AI
Free with trial A simple line style icon of a bar chart representing growth, data, or statistics. This graphic element is perfect for use in presentations, infographics, web design, and user interfaces. Trend decrease vectors Simple Line Style Bar Chart Graphic Outline Display Graph Icon. A simple line style icon of a bar chart representing growth, data, or statistics. This graphic element is perfect for use in presentations, infographics, web design, and user interfaces.
Free with trial A bright yellow 3D arrow points directly downwards against a clean white background. The arrow has a smooth, rounded appearance and is a simple, clear symbol of direction. Clear details and vibrant colors enhance visual appeal. Trend decrease illustrations 3D Yellow Downward Arrow on White Background direction symbol. A bright yellow 3D arrow points directly downwards against a clean white background. The arrow has a smooth, rounded appearance and is a simple, clear symbol of direction. Clear details and vibrant colors enhance visual appeal
Free with trial A graph with a line that is slanted and has a lot of peaks and valleys. The graph is on a white background. Trend decrease illustrations A graph with a line that is slanted and has a lot of peaks and valleys
Free with trial Colorful bar graph showing market analysis, financial report and accounting on a digital tablet. Generative AI. Trend decrease illustrations Colorful bar graph showing market analysis and financial report. Colorful bar graph showing market analysis, financial report and accounting on a digital tablet. Generative AI
Free with trial This image depicts a close-up of a hand using a pen to review detailed financial data, generated by AI. The image emphasizes precision and attention to detail in financial analysis. The cool blue tones enhance the professional and analytical nature of the task. Trend decrease illustrations Analyzing Financial Data. This image depicts a close-up of a hand using a pen to review detailed financial data, generated by AI. The image emphasizes precision and attention to detail in financial analysis. The cool blue tones enhance the professional and analytical nature of the task.
Free with trial The image depicts two stacks of coins, one silver and one copper, each with downward pointing arrows illustrating a decline in value. Trend decrease illustrations Decreasing Currency Values Shown With Stacked Coins and Arrows. The image depicts two stacks of coins, one silver and one copper, each with downward pointing arrows illustrating a decline in value
Free with trial Red Line Graph Showing Growth and Fluctuation on White Grid Paper, generative Ai. Trend decrease illustrations Red Line Graph Showing Growth and Fluctuation on White Grid Paper
Free with trial The "Vector Dollar Up Icon Symbol" is a graphical representation designed to indicate an increase or upward trend related to financial aspects, specifically involving currency or value. Trend decrease vectors Vector Dollar Up Icon Symbol
Free with trial A simple outline icon illustration of a bar chart diagram, used to display data analysis and performance metrics. Ideal for presentations, infographics, and dashboards. Trend decrease vectors Outline Simple Bar Chart Diagram Icon Graphic for Data Analysis. A simple outline icon illustration of a bar chart diagram, used to display data analysis and performance metrics. Ideal for presentations, infographics, and dashboards.
Free with trial The business concept of both crisis and recovery. Trend decrease illustrations Business concept of both crisis and recovery
Free with trial Nine simple black line illustrations of various charts and graphs. Trend decrease vectors Collection of Hand Drawn Charts and Graphs for Data Visualization. Nine simple black line illustrations of various charts and graphs
Free with trial A set of twelve minimalist data visualization icons, featuring charts, graphs, and other data-related symbols. Perfect for presentations, reports, and dashboards, showcasing data analysis and growth trends. The clean design ensures readability and professional appeal. Trend decrease illustrations Data Visualization Icons
Free with trial A wooden gavel rests on a sound block atop a graph with a downward trending red line and blue bars. Image. Trend decrease illustrations Gavel on Financial Graph. A wooden gavel rests on a sound block atop a graph with a downward trending red line and blue bars. Image
Free with trial A cartoon bear in a suit represents a bear market, with a downward trending graph and coins, symbolizing financial loss and economic recession. Trend decrease illustrations Bear Market Illustration - Financial Downturn and Economic Recession. A cartoon bear in a suit represents a bear market, with a downward trending graph and coins, symbolizing financial loss and economic recession
Free with trial Set of twelve colorful line icons representing various types of data visualization methods, including bar charts, line graphs, pie charts, and more. Perfect for presentations, reports, or websites. Trend decrease illustrations Data Visualization Icons. Set of twelve colorful line icons representing various types of data visualization methods, including bar charts, line graphs, pie charts, and more. Perfect for presentations, reports, or websites.
Free with trial Abstract financial graph fluctuating over dark textured surface Images are created using AI. Trend decrease illustrations Abstract financial graph fluctuating over dark textured surface
Free with trial A clean and modern set of financial icons, perfect for illustrating business concepts. The image features icons representing profit growth, expense management, tax documents, and investment summaries. The illustrations use a simple, flat design with a limited color palette, making them versatile for various applications. Ideal for presentations, websites, infographics, and financial reports. The set highlights key financial aspects in an easily understandable visual format. Trend decrease illustrations Financial Icons Set: Profit, Expenses, Tax, and Investment Analysis. A clean and modern set of financial icons, perfect for illustrating business concepts. The. A clean and modern set of financial icons, perfect for illustrating business concepts. The image features icons representing profit growth, expense management, tax documents, and investment summaries. The illustrations use a simple, flat design with a limited color palette, making them versatile for various applications. Ideal for presentations, websites, infographics, and financial reports. The set highlights key financial aspects in an easily understandable visual format.
Free with trial Line graph icons set simple clean and smooth line and fill vector icons in black on a white background. Trend decrease vectors Line graph icons set simple clean and smooth line and fill vector icons in black
Free with trial The image showcases solar panels installed on the roof of a residential building in a city, illustrating the integration of renewable energy solutions in urban living. These photovoltaic panels capture sunlight and convert it into electricity, providing a sustainable and eco-friendly power source for the building's residents. By reducing reliance on traditional energy sources, these solar panels help lower electricity bills and decrease carbon footprints, contributing to environmental sustainability. This rooftop installation reflects a growing trend towards adopting green energy in urban areas, promoting energy independence and demonstrating a commitment to combating climate change through innovative technology. Trend decrease illustrations Solar panels installed on the roof of a residential building in the city. The image showcases solar panels installed on the roof of a residential building in a city, illustrating the integration of renewable energy solutions in urban living. These photovoltaic panels capture sunlight and convert it into electricity, providing a sustainable and eco-friendly power source for the building's residents. By reducing reliance on traditional energy sources, these solar panels help lower electricity bills and decrease carbon footprints, contributing to environmental sustainability. This rooftop installation reflects a growing trend towards adopting green energy in urban areas, promoting energy independence and demonstrating a commitment to combating climate change through innovative technology.