Free with trial Stacked gold bars with fluctuating market graph in background. Generative AI. Trend decrease illustrations Stacked gold bars with fluctuating market graph in background
Free with trial Abstract cloud on red forex chart background. Market crisis and data server concept. 3D Rendering. Trend decrease illustrations Abstract cloud on forex chart background. Market crisis and data server concept. 3D Rendering
Free with trial Reduction chart icon Isolated flat vector in outline logo symbol. Trend decrease vectors Reduction chart icon Isolated flat vector in outline
Free with trial Global stock market crash concept with red downward arrows and world map. Clean, light background illustrating financial recession and crisis. 3D Rendering. Trend decrease illustrations Global stock market crash concept with red downward arrows and world map. 3D Rendering. Global stock market crash concept with red downward arrows and world map. Clean, light background illustrating financial recession and crisis. 3D Rendering
Free with trial Simple vector icon representing a bar graph with a big arrow pointing down. Trend decrease illustrations Big arrow pointing down on a decreasing bar graph icon. Simple vector icon representing a bar graph with a big arrow pointing down
Free with trial Red decreasing bar graph on light gray background. Investment statistics. Economic data. Financial report. Interest rate. Business concept. Top view. 3d render. Trend decrease illustrations Red decreasing bar graph on light gray background
Free with trial Laptop displaying a graph with a red arrow pointing down, illustrating a financial crisis. Trend decrease vectors Laptop showing graph going down representing financial crisis. Laptop displaying a graph with a red arrow pointing down, illustrating a financial crisis
Free with trial Line art icon of a flip chart showing a graph with decreasing statistics, concept for business failure. Trend decrease vectors Flip chart showing decreasing statistics on whiteboard. Line art icon of a flip chart showing a graph with decreasing statistics, concept for business failure
Free with trial Red downward arrow and a percentage symbol on a white background, indicating a financial crisis, market recession, or stock market crash. 3D Rendering. Trend decrease illustrations Red downward arrow and percentage symbol on white background. 3D Rendering. Red downward arrow and a percentage symbol on a white background, indicating a financial crisis, market recession, or stock market crash. 3D Rendering
Free with trial A pair of hands gently cradles four small, wooden house models against a backdrop of financial charts and graphs. The image evokes concepts of real estate investment, market analysis, and the security of owning property. The wooden houses symbolize homes and the charts represent market trends, making it suitable for illustrating financial articles, investment advice, or real estate services. Trend decrease illustrations Real Estate Market Analysis and Investment. A pair of hands gently cradles four small, wooden house models against a backdrop of financial charts and graphs. The image evokes concepts of real estate investment, market analysis, and the security of owning property. The wooden houses symbolize homes and the charts represent market trends, making it suitable for illustrating financial articles, investment advice, or real estate services.
Free with trial Broken circle arrow chart is representing negative growth and failure to meet targets. Trend decrease illustrations Broken circle arrow chart showing negative growth data. Broken circle arrow chart is representing negative growth and failure to meet targets
Free with trial Red stock market graph plummets on a laptop keyboard, indicating financial loss and market decline, great for business and finance themes. Trend decrease illustrations Stock market crash data on laptop keyboard. Red stock market graph plummets on a laptop keyboard, indicating financial loss and market decline, great for business and finance themes
Free with trial A 3D icon of a red downward arrow, often used to represent a recession, economic decline, or negative financial performance. Trend decrease vectors 3D Red Downward Arrow Indicating Recession Icon. A 3D icon of a red downward arrow, often used to represent a recession, economic decline, or negative financial performance
Free with trial Abstract digital illustration of a financial chart. A glowing white line graph rises and falls against a blue background with a grid pattern made of dots. The image conveys concepts of market trends, stock analysis, investment, and economic fluctuations. Suitable for illustrating financial reports, business presentations, and technology-related articles. Trend decrease illustrations Abstract Financial Chart with Glowing Line. Abstract digital illustration of a financial chart. A glowing white line graph rises and falls against a blue background with a grid pattern made of dots. The image conveys concepts of market trends, stock analysis, investment, and economic fluctuations. Suitable for illustrating financial reports, business presentations, and technology-related articles.
Free with trial A vibrant, 3D bar graph with colorful blocks rises against a white background. This modern infographic uses geometric shapes to represent data trends, making it a perfect visual for presentations, rep. Trend decrease illustrations Colorful Bar Graph. A vibrant, 3D bar graph with colorful blocks rises against a white background. This modern infographic uses geometric shapes to represent data trends, making it a perfect visual for presentations, rep
Free with trial A conceptual 3D illustration depicting a white growth arrow on a collapsing bar chart. The crumbling blocks and debris symbolize a dramatic failure or downturn. This powerful metaphor represents concepts such as financial crisis, economic recession, stock market crash, business bankruptcy, or unsustainable growth built on a fragile foundation. The minimalist gray background focuses attention on the central theme of collapse and risk, making it ideal for financial reports, business presentations, and articles about economic instability. Trend decrease illustrations Economic Crisis and Crumbling Growth Chart. A conceptual 3D illustration depicting a white growth arrow on a collapsing bar chart. The crumbling blocks and debris symbolize a dramatic failure or downturn. This powerful metaphor represents concepts such as financial crisis, economic recession, stock market crash, business bankruptcy, or unsustainable growth built on a fragile foundation. The minimalist gray background focuses attention on the central theme of collapse and risk, making it ideal for financial reports, business presentations, and articles about economic instability.
Free with trial A conceptual business image showing a torn paper design with a red downward arrow cutting through the center, symbolizing financial decline. The top portion displays a black and white line graph trending downward, while the bottom reveals bold 'PROFIT LOSS' text and placeholder text below. Ideal for illustrating economic downturn, company loss, financial crisis, negative growth, or poor performance in business reports and presentations. Trend decrease illustrations Red Arrow Piercing Paper Over Profit Loss Report with Declining Graph. A conceptual business image showing a torn paper design with a red downward arrow cutting through the center, symbolizing financial decline. The top portion displays a black and white line graph trending downward, while the bottom reveals bold 'PROFIT LOSS' text and placeholder text below. Ideal for illustrating economic downturn, company loss, financial crisis, negative growth, or poor performance in business reports and presentations.
Free with trial Silver bars with red downward arrow. 3D rendering isolated on white background. Trend decrease illustrations Silver bars with red downward arrow. 3D rendering
Free with trial Abstract Glowing Orange and Blue Data Graph. Trend decrease illustrations Abstract Glowing Orange and Blue Data Graph
Free with trial A fall chart with a red down arrow. Space for text. Trend decrease illustrations A fall chart with a red down arrow. Space for text.
Free with trial An isometric illustration depicting a blue bar chart showing growth, with a red arrow forming a slide that goes downwards, symbolizing a business decline or setback. Trend decrease illustrations Business growth chart with a downward slide. An isometric illustration depicting a blue bar chart showing growth, with a red arrow forming a slide that goes downwards, symbolizing a business decline or setback
Free with trial A bright blue, glossy, three-dimensional arrow curves downwards, pointing towards the bottom right of the frame. The arrow has a smooth, reflective surface and is presented against a stark white background, casting a subtle shadow. The image focuses on the directional and dynamic nature of the arrow. Trend decrease illustrations Bright Blue Glossy Arrow Pointing Downwards on White Background shiny. A bright blue, glossy, three-dimensional arrow curves downwards, pointing towards the bottom right of the frame. The arrow has a smooth, reflective surface and is presented against a stark white background, casting a subtle shadow. The image focuses on the directional and dynamic nature of the arrow
Free with trial Reduction chart icon Black line art vector in black and white outline set collection sign. Trend decrease vectors Reduction chart icon Thin line flat illustration. Reduction chart icon Black line art vector in black and white outline set collection sign
Free with trial A clean, minimalist bar chart illustration set against a solid green background. The chart features three white vertical bars of different heights, representing data points or progress over time. A simple white grid and axes are visible, indicating a clear visual representation of statistics. This versatile graphic is ideal for conveying concepts of business growth, financial analysis, market trends, statistical reporting, or educational content in a modern, easy-to-understand format. Perfect for presentations, infographics, websites, and applications. Trend decrease vectors Minimalist Bar Chart Icon on Green Background. A clean, minimalist bar chart illustration set against a solid green background. The chart features three white vertical bars of different heights, representing data points or progress over time. A simple white grid and axes are visible, indicating a clear visual representation of statistics. This versatile graphic is ideal for conveying concepts of business growth, financial analysis, market trends, statistical reporting, or educational content in a modern, easy-to-understand format. Perfect for presentations, infographics, websites, and applications.
Free with trial A minimalist line drawing of a bar chart, representing data, statistics and growth. Simple, bold and clean graphic icon. Trend decrease vectors Simple Line Chart Bar Statistic Graphic Icon. A minimalist line drawing of a bar chart, representing data, statistics and growth. Simple, bold and clean graphic icon.
Free with trial Laptop Displays Business Analytics Graph Data. Trend decrease illustrations Laptop Displays Business Analytics Graph Data
Free with trial A silhouetted businessman stands amidst a backdrop of descending red arrows, symbolizing financial decline and economic downturn. The image evokes feelings of concern, loss, and the challenges of business. The dark, moody atmosphere and the downward-pointing arrows create a powerful visual metaphor for market crashes, recessions, and financial instability. This image is suitable for illustrating articles, presentations, and marketing materials related to finance, economics, and business strategy. Trend decrease illustrations Financial Crisis and Economic Downturn Concept. A silhouetted businessman stands amidst a backdrop of descending red arrows, symbolizing financial decline and economic downturn. The image evokes feelings of concern, loss, and the challenges of business. The dark, moody atmosphere and the downward-pointing arrows create a powerful visual metaphor for market crashes, recessions, and financial instability. This image is suitable for illustrating articles, presentations, and marketing materials related to finance, economics, and business strategy.
Free with trial Image depicting a downward trend in currency value, symbolized by stacks of gold coins and a falling arrow. Trend decrease illustrations Declining Dollar: Economic Downturn Visualized. Image depicting a downward trend in currency value, symbolized by stacks of gold coins and a falling arrow
Free with trial Black outline icon of a stack of papers with a downward arrow, representing data loss or reduction. Trend decrease illustrations Arrow pointing down at decreasing stack of documents icon. Black outline icon of a stack of papers with a downward arrow, representing data loss or reduction
Free with trial A comprehensive collection of black and white icons representing various financial and business charts, including bar, line, and pie graphs, for data visualization. Trend decrease vectors Assortment of financial and business chart icons. A comprehensive collection of black and white icons representing various financial and business charts, including bar, line, and pie graphs, for data visualization
Free with trial A vibrant abstract image depicting a neon pink graph rising and falling over a textured pink and blue landscape. Trend decrease illustrations Glowing Neon Graph Over Abstract Pink Terrain. A vibrant abstract image depicting a neon pink graph rising and falling over a textured pink and blue landscape
Free with trial Red bar chart with a gray arrow pointing down representing financial loss. Trend decrease vectors Red chart arrow pointing down representing financial loss. Red bar chart with a gray arrow pointing down representing financial loss
Free with trial Business data visualization with various charts white background. Trend decrease illustrations Business data visualization with various charts
Free with trial White Bar Chart Decreasing on Blue Background. Trend decrease illustrations White Bar Chart Decreasing on Blue Background
Free with trial Business graph chart report pen on wood table. Trend decrease illustrations Business graph chart report pen on wood table
Free with trial A turquoise moon hovers above a stock market graph with rising and falling arrows indicating market trends, useful for illustrating financial concepts. Trend decrease illustrations Stock Market Graph with Moon and Arrow Trends. A turquoise moon hovers above a stock market graph with rising and falling arrows indicating market trends, useful for illustrating financial concepts
Free with trial A miniature wooden house model is depicted alongside a prominent white percentage symbol and a large red arrow pointing downwards, all resting on a light wooden surface. This visual metaphor effectively illustrates concepts related to falling housing prices, decreasing mortgage interest rates, or a general decline in the real estate market. It's ideal for financial news, economic reports, articles on property investment trends, or advertisements highlighting lower rates and market adjustments. The clean, minimalist composition emphasizes the critical financial message. Trend decrease illustrations Falling Home Prices and Mortgage Rates Concept. A miniature wooden house model is depicted alongside a prominent white percentage symbol and a large red arrow pointing downwards, all resting on a light wooden surface. This visual metaphor effectively illustrates concepts related to falling housing prices, decreasing mortgage interest rates, or a general decline in the real estate market. It's ideal for financial news, economic reports, articles on property investment trends, or advertisements highlighting lower rates and market adjustments. The clean, minimalist composition emphasizes the critical financial message.
Free with trial A hand-drawn illustration of a business chart showing a significant decline. Trend decrease vectors HandDrawn Business Decline Chart Illustration. A hand-drawn illustration of a business chart showing a significant decline
Free with trial BALANCE BETWEEN THE DOLLAR AND THE EURO CURRENCY - Dollar against euro concept - Futuristic stock market background with charts, numbers, and financial trends. Trend decrease illustrations BALANCE BETWEEN THE DOLLAR AND THE EURO CURRENCY - Dollar against euro concept - Futuristic stock market background
Free with trial A clear and prominent red arrow indicating a downward and rightward direction. Its stark contrast against a clean white backdrop makes it suitable for various data visualization and directional communication needs. Trend decrease illustrations Bold red arrow points downward and to the right with a white background. A clear and prominent red arrow indicating a downward and rightward direction. Its stark contrast against a clean white backdrop makes it suitable for various data visualization and directional communication needs
Free with trial A 3D render illustrating the concept of financial decline and economic crisis. The image features a bar chart with progressively smaller bars and a prominent red arrow pointing downwards, signifying a sharp downturn. This visual metaphor represents a stock market crash, business failure, investment loss, or recession. The minimalist design on a yellow background is perfect for financial reports, business presentations, economic news articles, and web graphics discussing negative growth, losses, or bankruptcy. A small stack of coins reinforces the monetary theme. Trend decrease illustrations 3D Financial Decline Graph with Downward Arrow. A 3D render illustrating the concept of financial decline and economic crisis. The image features a bar chart with progressively smaller bars and a prominent red arrow pointing downwards, signifying a sharp downturn. This visual metaphor represents a stock market crash, business failure, investment loss, or recession. The minimalist design on a yellow background is perfect for financial reports, business presentations, economic news articles, and web graphics discussing negative growth, losses, or bankruptcy. A small stack of coins reinforces the monetary theme.
Free with trial Illustration of an ascending red arrow and a descending blue arrow. Simple curved arrow icon. Trend decrease vectors Illustration of an ascending red arrow and a descending blue arrow.
Free with trial Simple vector showing a decreasing bar graph with an earth icon, representing the concept of global recession. Trend decrease illustrations Global economy showing decreasing bar graph and earth icon. Simple vector showing a decreasing bar graph with an earth icon, representing the concept of global recession
Free with trial Concept of currency devaluation with a dollar coin and three downward arrows, illustrating financial loss. Trend decrease vectors Dollar coin decreasing in value with three downward arrows. Concept of currency devaluation with a dollar coin and three downward arrows, illustrating financial loss
Free with trial A visual representation of declining interest rates, depicted by stacks of coins with percentage dice and a downward trending red arrow, symbolizing economic downturn. Trend decrease illustrations Falling interest rates shown by dice and coins. A visual representation of declining interest rates, depicted by stacks of coins with percentage dice and a downward trending red arrow, symbolizing economic downturn
Free with trial A red arrow points downward towards the words "Interest Rates" in dark lettering, symbolizing a decline. Image. Trend decrease illustrations Red Arrow Pointing Down at Interest Rates Text. A red arrow points downward towards the words "Interest Rates" in dark lettering, symbolizing a decline. Image
Free with trial Risk Management Analysis Graph with Warning Signs, generative Ai. Trend decrease illustrations Risk Management Analysis Graph with Warning Signs
Free with trial Isometric illustration of a marketing team analyzing a falling financial chart on a tablet. Trend decrease illustrations Marketing team analyzing falling financial chart on tablet. Isometric illustration of a marketing team analyzing a falling financial chart on a tablet
Free with trial A modern 3D rendered abstract illustration featuring a prominent light blue downward-pointing arrow as its base. On top, a geometric structure is composed of a rectangular block, two stylized bar chart-like elements, and a central dark grey multifaceted polyhedron. Set against a clean white background, this graphic symbolizes concepts like data analysis, business trends, financial decline, foundational structures, or urban development. Its minimalist and digital aesthetic makes it suitable for technology, finance, and corporate presentations, infographics, and web design. Trend decrease vectors Abstract 3D Data Structure with Downward Arrow. A modern 3D rendered abstract illustration featuring a prominent light blue downward-pointing arrow as its base. On top, a geometric structure is composed of a rectangular block, two stylized bar chart-like elements, and a central dark grey multifaceted polyhedron. Set against a clean white background, this graphic symbolizes concepts like data analysis, business trends, financial decline, foundational structures, or urban development. Its minimalist and digital aesthetic makes it suitable for technology, finance, and corporate presentations, infographics, and web design.
Free with trial A close-up view of a laptop screen showing a stock market crash with candlestick charts and financial data, highlighting market volatility and investment risks - generated AI. Trend decrease illustrations Stock market decline displayed on laptop with financial charts. A close-up view of a laptop screen showing a stock market crash with candlestick charts and financial data, highlighting market volatility and investment risks - generated AI
Free with trial A 3D rendered icon depicts a black house with a golden window frame. A thick red arrow points downwards, originating from the house and extending towards the base. The icon is placed on a light-colored, rectangular platform against a stark white background. Trend decrease illustrations Black house icon with downward red arrow image. A 3D rendered icon depicts a black house with a golden window frame. A thick red arrow points downwards, originating from the house and extending towards the base. The icon is placed on a light-colored, rectangular platform against a stark white background
Free with trial A bright yellow arrow pointing downwards, presented clearly against a pure white background, signifying direction or a downward trend in a simple, clean graphic. Trend decrease illustrations Yellow down arrow isolated on white background. A bright yellow arrow pointing downwards, presented clearly against a pure white background, signifying direction or a downward trend in a simple, clean graphic
Free with trial A businessman in white shirt with hands on head watches falling stock chart. Trend decrease illustrations Worried Businessman Facing Stock Market Decline. A businessman in white shirt with hands on head watches falling stock chart
Free with trial Stacks of gold coins, financial growth, investment generative ai image. Trend decrease illustrations Stacks of gold coins, financial growth, investment
Free with trial Blue bitcoin symbol with up and down arrows, representing the cryptocurrency's fluctuating value and market volatility. 3D render. Trend decrease illustrations Bitcoin volatility: cryptocurrency fluctuating between increasing and decreasing value. Blue bitcoin symbol with up and down arrows, representing the cryptocurrency's fluctuating value and market volatility. 3D render
Free with trial A vibrant and modern illustration showcasing various data visualization elements. The image features a collection of charts, graphs, and diagrams, including line graphs, bar graphs, pie charts, and circular diagrams, all rendered in a colorful and abstract style. The design incorporates gradients and geometric shapes, suggesting growth, analysis, and business concepts. Ideal for presentations, reports, websites, and marketing materials related to finance, economics, and data analysis. Trend decrease illustrations Abstract Data Visualization and Business Charts. A vibrant and modern illustration showcasing various data visualization elements. The image features a collection of charts, graphs, and diagrams, including line graphs, bar graphs, pie charts, and circular diagrams, all rendered in a colorful and abstract style. The design incorporates gradients and geometric shapes, suggesting growth, analysis, and business concepts. Ideal for presentations, reports, websites, and marketing materials related to finance, economics, and data analysis.
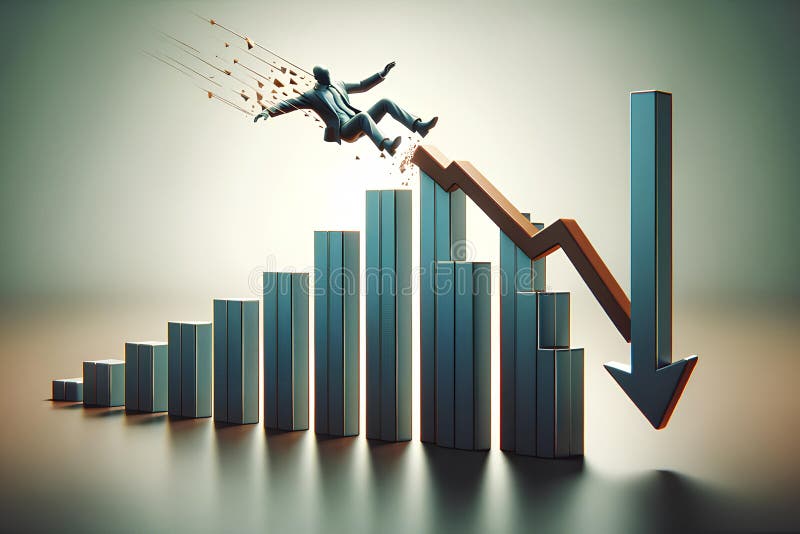
Free with trial A 3D figure of a person in a business suit falling from a declining chart. Trend decrease illustrations A 3D figure of a person in a business suit falling from a declining chart
Free with trial Red arrow pointing down and coins showing stock market crash, investment loss, and financial crisis. Trend decrease illustrations Stock market crash showing a red downward arrow and gold coins. Red arrow pointing down and coins showing stock market crash, investment loss, and financial crisis
Free with trial Downward red crisis chart grid on dark backdrop. Recession and economic fall concept. 3D Rendering. Trend decrease illustrations Downward red crisis chart grid on backdrop. Recession and economic fall concept. 3D Rendering
Free with trial An infographic illustrating the dynamics of growth and decline, represented by two distinct groups of people forming a pyramid. Trend decrease vectors Business Growth and Decline Infographic Concept. An infographic illustrating the dynamics of growth and decline, represented by two distinct groups of people forming a pyramid
Free with trial A hand removes coins from stacks, mirroring a downward trending graph generated by AI. The image visually represents economic decline, financial loss, or decreasing market value. The stacks of coins symbolize assets, dwindling in line with the graph's trajectory. Trend decrease illustrations Declining Investments: AI-Generated Visualization. A hand removes coins from stacks, mirroring a downward trending graph generated by AI. The image visually represents economic decline, financial loss, or decreasing market value. The stacks of coins symbolize assets, dwindling in line with the graph's trajectory.
Free with trial A vibrant collection of hand-drawn business charts and graphs, rendered in shades of blue with a sketch-like aesthetic. The set includes various types of visualizations like bar charts, line graphs, pie charts, and donut charts, representing data, growth, and analysis. This versatile illustration is perfect for presentations, reports, infographics, and any project requiring a visual representation of financial or statistical information with a creative, hand-crafted feel. Trend decrease illustrations Hand-Drawn Business Charts and Graphs Collection. A vibrant collection of hand-drawn business charts and graphs, rendered in shades of blue with a sketch-like aesthetic. The set includes various types of visualizations like bar charts, line graphs, pie charts, and donut charts, representing data, growth, and analysis. This versatile illustration is perfect for presentations, reports, infographics, and any project requiring a visual representation of financial or statistical information with a creative, hand-crafted feel.
Free with trial Hand holding coin with arrows symbolizing increasing and decreasing value. Suitable for financial growth concepts in presentations, articles, and ads. Trend decrease vectors Hand holding coin with arrows symbolizing increasing and decreasing value
Free with trial A 3D-rendered image depicts a sharply declining red arrow on a bar graph, symbolizing a significant market downturn. The graph is set against a solid blue background. Trend decrease illustrations 3D Render of a Dramatic Stock Market Crash Graph. A 3D-rendered image depicts a sharply declining red arrow on a bar graph, symbolizing a significant market downturn. The graph is set against a solid blue background.
Free with trial Interactive touchscreen is showing a graph declining, which can be used for business or financial presentations. Trend decrease vectors Interactive touchscreen showing graph declining icon cartoon vector. Interactive touchscreen is showing a graph declining, which can be used for business or financial presentations
Free with trial Business growth presentation with charts and graphs showing progress, statistics, and performance. The image showcases key financial indicators in a clear, concise format. Trend decrease vectors Financial Data Analysis Report on Screen Display. Business growth presentation with charts and graphs showing progress, statistics, and performance. The image showcases key financial indicators in a clear, concise format.
Free with trial Generated with the use of AI. Business Analyst Touching a Glowing Cost Reduction Graph on a Virtual Interface Above Laptop Indicating Financial Strategy. Trend decrease illustrations Business Analyst Touching a Glowing Cost Reduction Graph on a Virtual Interface Above Laptop Indicating Financial Strategy
Free with trial A striking minimalist geometric design featuring two bold black arrow-like or chevron shapes on a clean white background. The top shape points upwards, while the bottom shape points downwards, separated by a crisp white horizontal band. This abstract symbol creates a sense of direction, movement, and balance. Ideal for use as an icon, logo element, infographic component, or to represent concepts like progress, opposition, flow, or data trends in various design projects, presentations, and digital interfaces. Trend decrease vectors Abstract Black Up and Down Chevron Arrows Symbol. A striking minimalist geometric design featuring two bold black arrow-like or chevron shapes on a clean white background. The top shape points upwards, while the bottom shape points downwards, separated by a crisp white horizontal band. This abstract symbol creates a sense of direction, movement, and balance. Ideal for use as an icon, logo element, infographic component, or to represent concepts like progress, opposition, flow, or data trends in various design projects, presentations, and digital interfaces.
Free with trial Futuristic digital illustration of glowing blue arrow pointing downwards. Geometric wireframe design with polygonal facets on dark gradient background representing business trends and data loss. Trend decrease vectors Abstract low poly blue arrow pointing down on dark background. Futuristic digital illustration of glowing blue arrow pointing downwards. Geometric wireframe. Futuristic digital illustration of glowing blue arrow pointing downwards. Geometric wireframe design with polygonal facets on dark gradient background representing business trends and data loss
Free with trial Businessman facing downturn graph on grunge wall. Trend decrease illustrations Businessman facing downturn graph on grunge wall
Free with trial Set of red arrow going down stock icon. Symbol of downward arrow graph. Symbol of down arrow market graph. Trend decrease vectors Set of red arrow going down stock icon. Symbol of downward arrow graph. Symbol of down arrow market graph
Free with trial Financial icon depicting money loss with a downward arrow and bar graph isolated on a white background. Trend decrease illustrations Loss money arrow bar graph icon isolated on white. Financial icon depicting money loss with a downward arrow and bar graph isolated on a white background
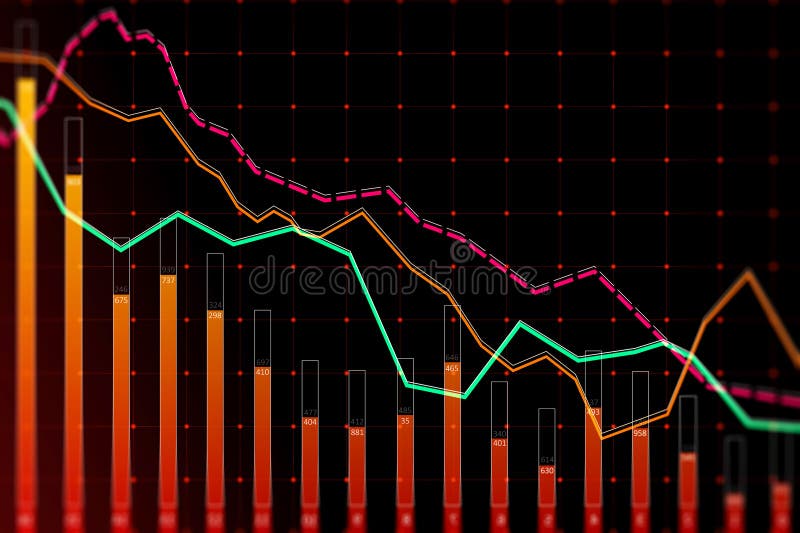
Free with trial The image shows a vibrant orange graph plotted against a dark, abstract background. the graph displays a curve that initially decreases, reaches a minimum, and then increases again. the background features a grid-like structure with vertical and diagonal blue glowing lines, creating a futuristic or technological feel. the overall impression is one of data visualization in a modern, stylized setting. Trend decrease illustrations Glowing orange graph on dark abstract background. the image shows a vibrant orange graph plotted against a dark, abstract background. the graph displays a curve that initially decreases, reaches a minimum, and then increases again. the background features a grid-like structure with vertical and diagonal blue glowing lines, creating a futuristic or technological feel. the overall impression is one of data visualization in a modern, stylized setting.
Free with trial The image shows a downward trending line graph on a digital grid, representing a decline in the stock market. Trend decrease illustrations Abstract Blue Digital Stock Market Graph Decline. The image shows a downward trending line graph on a digital grid, representing a decline in the stock market
Free with trial A solid black, downward-pointing arrow symbol is depicted on a stark white background. The arrow is a simple, geometric shape with a clear shaft and arrowhead, indicating direction or a negative trend. It is isolated and presented cleanly, making it suitable for a variety of digital and print applications. Trend decrease illustrations Black Downward Arrow Symbol On White Background Isolated direction pointer. A solid black, downward-pointing arrow symbol is depicted on a stark white background. The arrow is a simple, geometric shape with a clear shaft and arrowhead, indicating direction or a negative trend. It is isolated and presented cleanly, making it suitable for a variety of digital and print applications
Free with trial Diagram icons set in outline stroke design for web. Pack line pictograms with growth bar chart, pie data, datum, marketing, analyzing finance, flow, infographic, statistic, other. Vector illustration. Trend decrease vectors Diagram icons set in outline stroke design for web. Pack line pictograms with growth bar chart, pie data, datum
Free with trial Futuristic 3D Data Visualization on Glass Screen. Trend decrease illustrations Futuristic 3D Data Visualization on Glass Screen
Free with trial A collection of financial chart icons, showcasing data analysis and business growth concepts. The image features multiple variations of a line graph and bar chart combination, presented in both grayscale and beige color schemes. These icons are ideal for illustrating financial reports, business presentations, market trends, and data visualization projects. The clean, modern design makes them suitable for a wide range of applications. Trend decrease vectors Financial Chart Icons: Business and Data Analysis. A collection of financial chart icons, showcasing data analysis and business growth concepts. The image features multiple variations of a line graph and bar chart combination, presented in both grayscale and beige color schemes. These icons are ideal for illustrating financial reports, business presentations, market trends, and data visualization projects. The clean, modern design makes them suitable for a wide range of applications.
Free with trial A 3D rendered image of a bar graph disintegrating into dust, symbolizing economic decline or market crash. This powerful visual metaphor, generated by AI, highlights the fragility of growth and the potential for sudden collapse. Trend decrease illustrations Collapsing Growth Chart. A 3D rendered image of a bar graph disintegrating into dust, symbolizing economic decline or market crash. This powerful visual metaphor, generated by AI, highlights the fragility of growth and the potential for sudden collapse.
Free with trial 3D icon representing business decline, downturn, and financial loss. Trend decrease illustrations 3D business growth down concept icon. 3D icon representing business decline, downturn, and financial loss