Free with trial Illustration of a red arrow pointing downwards across a series of red vertical bars of varying height, set against a beige background. Image. Trend decrease illustrations Illustration of Red Downward Arrow Over Red Bar Graph. Illustration of a red arrow pointing downwards across a series of red vertical bars of varying height, set against a beige background. Image
Free with trial This simple bar graph is depicting market analysis with colorful bars. Trend decrease vectors Colorful bar graph showing market growth and success. This simple bar graph is depicting market analysis with colorful bars
Free with trial A vibrant 3D representation of a business graph and chart, showcasing data analysis and financial trends with colorful bars and a dynamic line, isolated on a clean white background. Trend decrease illustrations 3d graph and chart icons isolated on white background. A vibrant 3D representation of a business graph and chart, showcasing data analysis and financial trends with colorful bars and a dynamic line, isolated on a clean white background
Free with trial Colorful graph chart is showing and comparing different data results with lines and dots. Trend decrease vectors Colorful graph chart showing different data comparing results. Colorful graph chart is showing and comparing different data results with lines and dots
Free with trial A small plant is growing in the dirt next to a graph. Generative AI. Trend decrease illustrations A small plant is growing in the dirt next to a graph
Free with trial Thick arrow is pointing down next to a dollar coin, representing devaluation or inflation. Trend decrease vectors Dollar coin with arrow pointing down representing devaluation. Thick arrow is pointing down next to a dollar coin, representing devaluation or inflation
Free with trial This image portrays the concept of analyzing stock market trends through the use of candlestick charts. The red candlestick represents a bearish trend, indicating a decrease in stock prices. The various lines and shapes on the chart represent patterns and indicators used by traders to predict future market movements. This image conveys the importance of careful analysis and strategic decision-making in the stock market. The flickering flame of the candlestick adds a sense of urgency and volatility to the overall message. Overall, this image is perfect for presentations or articles related to finance, trading, and investment. Trend decrease illustrations Red Candlestick Analysis: Stock Market Trading Charts. This image portrays the concept of analyzing stock market trends through the use of candlestick charts. The red candlestick represents a bearish trend, indicating a decrease in stock prices. The various lines and shapes on the chart represent patterns and indicators used by traders to predict future market movements. This image conveys the importance of careful analysis and strategic decision-making in the stock market. The flickering flame of the candlestick adds a sense of urgency and volatility to the overall message. Overall, this image is perfect for presentations or articles related to finance, trading, and investment.
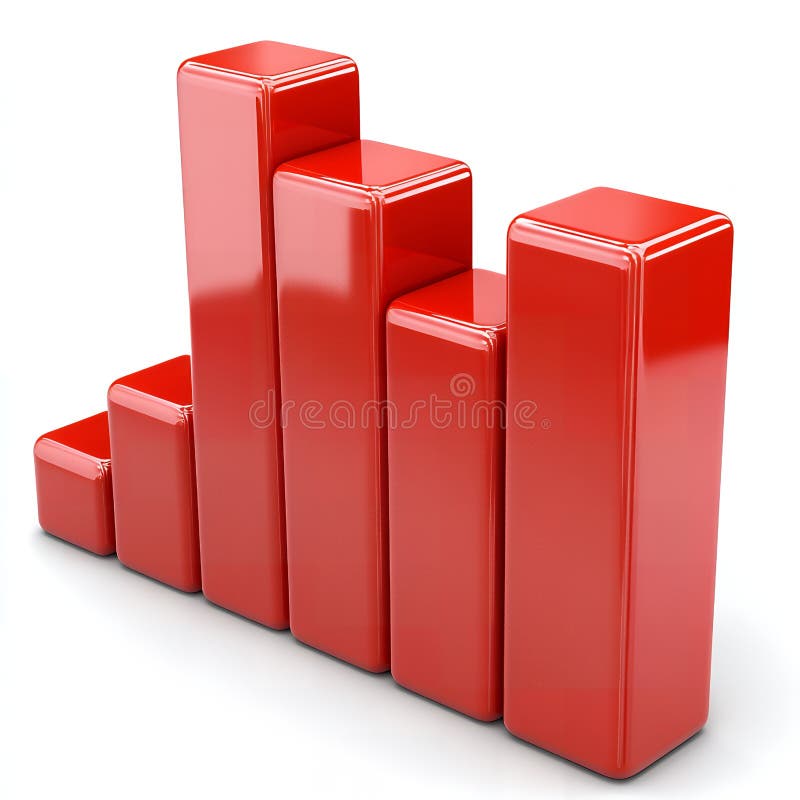
Free with trial Red bar graph with decreasing values. Generative AI. Trend decrease illustrations Red bar graph with decreasing values
Free with trial Strategic Decisions: Integrating Business Analytics with Strategic Thinking. This visual portrays the dynamic interaction between business analytics and strategic thinking, showcasing how analytical insights drive strategic planning and decision-making. It emphasizes the synergy between data analysis and strategic foresight in achieving business goals. --chaos 10 --ar 16:9 --style raw --stylize, aesthetic wallpaper background. Trend decrease illustrations Colorful Pie Charts and Bar Graphs on a White Paper. Strategic Decisions: Integrating Business Analytics with Strategic Thinking. This visual portrays the dynamic interaction between business analytics and strategic thinking, showcasing how analytical insights drive strategic planning and decision-making. It emphasizes the synergy between data analysis and strategic foresight in achieving business goals. --chaos 10 --ar 16:9 --style raw --stylize, aesthetic wallpaper background
Free with trial A clean, flat design illustration featuring a collection of icons related to social media engagement and data analysis. The set includes a pie chart, bar graphs showing upward trends, a line graph with a heart icon and an upward arrow, another line graph with data points, a speech bubble with the word 'LIKE' and abstract shapes, and a thumbs-up icon with a notification count. These graphics are ideal for representing concepts like growth, popularity, analytics, and user feedback in digital marketing, business reports, and web design. Trend decrease illustrations Social Media Metrics and Data Visualization Icons. A clean, flat design illustration featuring a collection of icons related to social media engagement and data analysis. The set includes a pie chart, bar graphs showing upward trends, a line graph with a heart icon and an upward arrow, another line graph with data points, a speech bubble with the word 'LIKE' and abstract shapes, and a thumbs-up icon with a notification count. These graphics are ideal for representing concepts like growth, popularity, analytics, and user feedback in digital marketing, business reports, and web design.
Free with trial Bar chart in blue circle alongside minimal cloud shapes and dark horizontal lines. Ideal for analytics, data trends, business insight, environment, forecast, comparison, technology, simple flat. Trend decrease illustrations Minimalist Data Visualization with Bar Chart and Cloudy Sky Elements. Bar chart in blue circle alongside minimal cloud shapes and dark horizontal lines. Ideal for analytics, data trends, business insight, environment, forecast, comparison, technology, simple flat
Free with trial Line graph is depicting the fluctuation of the dollar currency over a period of time. Trend decrease illustrations Line graph showing dollar sign currency fluctuation over time. Line graph is depicting the fluctuation of the dollar currency over a period of time
Free with trial A collection of small, black, spherical magnetic balls are arranged on a white surface to form a large arrow pointing downwards. The arrow is composed of multiple rows of balls, with a wider top and tapering to a point. A few individual balls are scattered near the tip of the arrow. The arrangement creates a clear directional symbol. Trend decrease illustrations Arrow Shape Formed by Black Magnetic Balls Pointing Downward down arrow direction. A collection of small, black, spherical magnetic balls are arranged on a white surface to form a large arrow pointing downwards. The arrow is composed of multiple rows of balls, with a wider top and tapering to a point. A few individual balls are scattered near the tip of the arrow. The arrangement creates a clear directional symbol
Free with trial Abstract 3D rendering of a golden bar graph, depicting data fluctuations Represents growth and market trends. Trend decrease illustrations Golden Data Visualization. AI Generated. Abstract 3D rendering of a golden bar graph, depicting data fluctuations Represents growth and market trends
Free with trial Red graph overlayed on cityscape background showing market downturn. Trend decrease illustrations Red graph overlayed on cityscape background showing market downturn.
Free with trial Three line graphs, data visualization, chart comparison. Trend decrease vectors Three line graphs, data visualization, chart comparison
Free with trial Line art vector icon of stacks of coins with some arrows pointing up and some pointing down, representing market volatility. Trend decrease vectors Money increasing and decreasing showing market volatility icon. Line art vector icon of stacks of coins with some arrows pointing up and some pointing down, representing market volatility
Free with trial Businessman in suit jumps between cliffs with red downward and green upward arrows, symbolizing market recovery and financial success. Trend decrease illustrations Businessman jumping from financial crisis to success with red downward and green upward arrows. Businessman in suit jumps between cliffs with red downward and green upward arrows, symbolizing market recovery and financial success
Free with trial Contrast exploded view of property value chart high contrast illustration real estate, analysis graph, data visualization contrast exploded view of property value chart high contrast. Trend decrease illustrations Contrast exploded view of property value chart high contrast
Free with trial Wooden house model on green grass with a red downward trending arrow suggesting a decline in housing market or property values. Warm outdoor lighting, shallow depth of field. Trend decrease illustrations Wooden House Model and Red Downward Arrow on Grass. Wooden house model on green grass with a red downward trending arrow suggesting a decline in housing market or property values. Warm outdoor lighting, shallow depth of field
Free with trial Businessman stick figure character slip and falling down from coins pile. Business failure, economic crisis, bankruptcy concept, down chart negative arrow. hand drawn style vector doodle illustration. Trend decrease vectors Businessman stick figure character slip and falling down from coins pile. Business failure, economic crisis, bankruptcy concept
Free with trial A row of wooden figures, each with a spherical top and a rectangular or cylindrical base, are arranged in descending order of height from left to right. The figures vary in color, starting with a deep red, followed by orange, yellow, green, and then several shades of brown and natural wood. The background is a muted, textured beige. Trend decrease illustrations Wooden figures arranged in descending height order. A row of wooden figures, each with a spherical top and a rectangular or cylindrical base, are arranged in descending order of height from left to right. The figures vary in color, starting with a deep red, followed by orange, yellow, green, and then several shades of brown and natural wood. The background is a muted, textured beige
Free with trial Downward red crisis chart grid on dark background. Recession and economic fall concept. 3D Rendering. Trend decrease illustrations Downward crisis chart grid on dark background. Recession and economic fall concept. 3D Rendering
Free with trial Wooden block with the time to fix the system symbol. The process of solving complex problems. Resolving the company's declining financial issues. Marketing Trends concept. Set Trend Modern vector flat illustration. Trend decrease vectors The process of solving complex problems.
Free with trial A close-up of a laptop displaying a stock market crash, highlighted by declining red graph lines and a glowing keyboard, symbolizing financial crisis and economic volatility - generated AI. Trend decrease illustrations Stock market crash displayed on laptop screen with red graph lines. A close-up of a laptop displaying a stock market crash, highlighted by declining red graph lines and a glowing keyboard, symbolizing financial crisis and economic volatility - generated AI
Free with trial Simple black and white icon showing the exchange rate of bitcoin cryptocurrency increasing while the value of the dollar is decreasing. Trend decrease vectors Bitcoin cryptocurrency increasing while dollar decreasing icon. Simple black and white icon showing the exchange rate of bitcoin cryptocurrency increasing while the value of the dollar is decreasing
Free with trial A glossy, transparent blue arrow curves downwards, pointing towards the bottom right of the frame. The arrow is rendered in 3D and casts a subtle shadow on the white surface it rests upon. Clear details and vibrant colors enhance visual appeal. Trend decrease illustrations Glossy Blue Arrow Pointing Downwards on a White Background direction decline. A glossy, transparent blue arrow curves downwards, pointing towards the bottom right of the frame. The arrow is rendered in 3D and casts a subtle shadow on the white surface it rests upon. Clear details and vibrant colors enhance visual appeal
Free with trial 3D illustration of stacked gold coins with a red downward arrow, symbolizing financial loss, market decline, or economic downturn. Perfect for finance presentations, investment reports, economic analysis, and business-related visuals showing negative trends. Trend decrease illustrations . 3D illustration of stacked gold coins with a red downward arrow, symbolizing financial loss, market decline, or economic downturn. Perfect for finance presentations, investment reports, economic analysis, and business-related visuals showing negative trends.
Free with trial Nine black and white icons of abacuses on a white background, each with varying curves on the frame. The beads are arranged differently among the icons, suggesting diverse numerical configurations. The abacus curves either upward or downward, providing distinct shapes across each representation. These simple illustrations emphasize the classic design of the abacus as a counting tool. Trend decrease vectors Nine simple line graphs displayed in a grid pattern. Nine black and white icons of abacuses on a white background, each with varying curves on the frame. The beads are arranged differently among the icons, suggesting diverse numerical configurations. The abacus curves either upward or downward, providing distinct shapes across each representation. These simple illustrations emphasize the classic design of the abacus as a counting tool.
Free with trial This simple vector icon shows a round chart with a bar graph that is decreasing. Trend decrease illustrations Round chart icon showing decreasing bar graph for data analysis. This simple vector icon shows a round chart with a bar graph that is decreasing
Free with trial Silver bullion broken showing economic recession and market crash. Silver bullion broken with a red down arrow symbolizing financial crisis and falling markets. Trend decrease illustrations Silver bullion broken showing economic recession and market crash. Silver bullion broken with a red down arrow symbolizing financial crisis and falling markets
Free with trial Colorful graph showing decreasing lines representing a financial loss. Trend decrease vectors Isometric graph showing financial loss with arrow pointing down. Colorful graph showing decreasing lines representing a financial loss
Free with trial Stock market chart plunging into red under stormy clouds, symbolizing recession, financial crisis, investment losses and global economic uncertainty in a dramatic digital illustration. Trend decrease illustrations Stock market decreasing chart line among dark clouds. Stock market chart plunging into red under stormy clouds, symbolizing recession, financial crisis, investment losses and global economic uncertainty in a dramatic digital illustration
Free with trial Falling Performance Shown in 3D Business Data Chart - 3D chart displays a decline in business performance, highlighting negative growth. Trend decrease illustrations Falling Performance Shown in 3D Business Data Chart
Free with trial This vector icon set features graph diagrams with arrows indicating growth and decline. The icons represent business metrics and financial performance, with arrows pointing upward for growth and downward for decline. These symbols are ideal for visualizing trends, success, and changes in finance reports or business charts. The clean, simple design ensures clarity, making these icons suitable for use in presentations, reports, or dashboards to effectively communicate financial or business performance. Trend decrease vectors Growing up and down vector icon set. Graph diagram with arrow. Business growth success chart. Finance report symbol. This vector icon set features graph diagrams with arrows indicating growth and decline. The icons represent business metrics and financial performance, with arrows pointing upward for growth and downward for decline. These symbols are ideal for visualizing trends, success, and changes in finance reports or business charts. The clean, simple design ensures clarity, making these icons suitable for use in presentations, reports, or dashboards to effectively communicate financial or business performance.
Free with trial This image showcases a striking 3D rendering featuring two sets of colorful bar graphs, one in shades of pink and the other in orange. These graphs are artfully embedded within wave-like, layered forms, creating a visually interesting contrast between the rigid geometry of the bars and the fluidity of the surrounding shapes. The graphs are positioned on separate, circular platforms, and a small, idyllic island with several evergreen trees sits between them, adding a touch of nature to the otherwise abstract composition. The overall aesthetic is minimalist and modern, suggesting a conceptual representation of financial growth within a natural context. Trend decrease illustrations Abstract 3D Render of Financial Growth Represented by Colorful Bar Graphs Nestled in Stylized Landscapes. This image showcases a striking 3D rendering featuring two sets of colorful bar graphs, one in shades of pink and the other in orange. These graphs are artfully embedded within wave-like, layered forms, creating a visually interesting contrast between the rigid geometry of the bars and the fluidity of the surrounding shapes. The graphs are positioned on separate, circular platforms, and a small, idyllic island with several evergreen trees sits between them, adding a touch of nature to the otherwise abstract composition. The overall aesthetic is minimalist and modern, suggesting a conceptual representation of financial growth within a natural context.
Free with trial Vibrant bar graph illustrates business growth and decline with upward and downward trending lines. Perfect for presentations or reports. Trend decrease illustrations Colorful Bar Graph Chart Showing Growth and Decline. Vibrant bar graph illustrates business growth and decline with upward and downward trending lines. Perfect for presentations or reports
Free with trial Man with bankruptcy concept. Young guy with banknotes and golden coins at background of fall graph. Recession and inflation. Cartoon flat vector illustration isolated on white background. Trend decrease vectors Man with bankruptcy vector concept. Man with bankruptcy concept. Young guy with banknotes and golden coins at background of fall graph. Recession and inflation. Cartoon flat vector illustration isolated on white background
Free with trial Man with bankruptcy concept. Young guy with banknotes and golden coins at background of fall graph. Economical crisis. Poster or banner. Cartoon flat vector illustration isolated on white background. Trend decrease vectors Man with bankruptcy vector concept. Man with bankruptcy concept. Young guy with banknotes and golden coins at background of fall graph. Economical crisis. Poster or banner. Cartoon flat vector illustration isolated on white background
Free with trial This abstract 3D rendered image showcases three prominent white candlestick-like objects, symbolizing financial growth and market trends. Positioned against a dark, gridded background, a subtle financial chart with smaller red and white candlesticks and wicks extends into the distance, reinforcing the theme of data analysis and investment. The clean, modern aesthetic makes it ideal for illustrating concepts related to stock market performance, cryptocurrency trading, economic growth, financial planning, and digital business strategies. It effectively conveys ideas of progress, success, and the dynamic nature of global markets. Trend decrease illustrations 3D Financial Candlestick Chart Representing Market Growth. This abstract 3D rendered image showcases three prominent white candlestick-like objects, symbolizing financial growth and market trends. Positioned against a dark, gridded background, a subtle financial chart with smaller red and white candlesticks and wicks extends into the distance, reinforcing the theme of data analysis and investment. The clean, modern aesthetic makes it ideal for illustrating concepts related to stock market performance, cryptocurrency trading, economic growth, financial planning, and digital business strategies. It effectively conveys ideas of progress, success, and the dynamic nature of global markets.
Free with trial Blue Stacked Arrow Up Down on White, Direction ,Growth , This photo was created using generative AI. Trend decrease illustrations Blue Stacked Arrow Up Down on White, Direction ,Growth
Free with trial Stock market icons. Set of 20 stock market trendy minimal icons. Bear, Bull, market analysis, Stock Exchange icon. Design signs for web page, mobile app, packaging design. Vector illustration. Trend decrease vectors Stock market icons set. Stock market icons. Set of 20 stock market trendy minimal icons. Bear, Bull, market analysis, Stock Exchange icon. Design signs for web page, mobile app, packaging design. Vector illustration.
Free with trial Laptop is displaying a red graph decreasing on its screen, representing a business analytics concept. Trend decrease illustrations Laptop showing decreasing graph on screen for business analytics. Laptop is displaying a red graph decreasing on its screen, representing a business analytics concept
Free with trial This striking image depicts a 3D rendering of a sharply declining graph, generated by AI, symbolizing a market crash or economic downturn. The red arrow dramatically plunges downwards against a blurred background of white building silhouettes, visually representing the severity of the economic decl. Trend decrease illustrations AI-Generated Market Crash Visualization. This striking image depicts a 3D rendering of a sharply declining graph, generated by AI, symbolizing a market crash or economic downturn. The red arrow dramatically plunges downwards against a blurred background of white building silhouettes, visually representing the severity of the economic decl
Free with trial This striking image depicts a 3D rendering of a dramatic market downturn, generated by AI. The red, origami-style arrow plunges downwards, contrasting sharply with the clean, minimalist background. The visual emphasizes the severity of the economic decline. Trend decrease illustrations AI-Generated Market Crash Visualization. This striking image depicts a 3D rendering of a dramatic market downturn, generated by AI. The red, origami-style arrow plunges downwards, contrasting sharply with the clean, minimalist background. The visual emphasizes the severity of the economic decline.
Free with trial Abstract graphic showing currency symbols and arrows to visually represent financial market changes and exchange rate fluctuations Ideal for illustrating finance topics. Trend decrease illustrations Currency Exchange Rate Fluctuations Abstract Graphic. Abstract graphic showing currency symbols and arrows to visually represent financial market changes and exchange rate fluctuations Ideal for illustrating finance topics
Free with trial A futuristic concept of financial trading and data analysis. A glowing holographic stock market chart, with candlesticks and graphs, is projected onto a modern office desk. The scene includes a laptop and coffee, set against a large window with a blurry night city skyline. This image represents concepts like fintech, investment, big data, economic growth, and innovative business technology. Ideal for illustrating topics on digital finance, stock exchange, forex trading, and corporate strategy in a high-tech world. Trend decrease illustrations Futuristic Financial Trading Hologram on Office Desk. A futuristic concept of financial trading and data analysis. A glowing holographic stock market chart, with candlesticks and graphs, is projected onto a modern office desk. The scene includes a laptop and coffee, set against a large window with a blurry night city skyline. This image represents concepts like fintech, investment, big data, economic growth, and innovative business technology. Ideal for illustrating topics on digital finance, stock exchange, forex trading, and corporate strategy in a high-tech world.
Free with trial A hand holds a piece of paper with a hand-drawn graph showing a sharp decline, symbolizing a market downturn. The image, generated by AI, highlights the concept of economic recession and financial instability. Coins and banknotes are blurred in the background, emphasizing the tangible impact of fa. Trend decrease illustrations Falling Market. A hand holds a piece of paper with a hand-drawn graph showing a sharp decline, symbolizing a market downturn. The image, generated by AI, highlights the concept of economic recession and financial instability. Coins and banknotes are blurred in the background, emphasizing the tangible impact of fa
Free with trial Red downward arrow with stock market data and candlestick chart on white background, showcasing financial decline, business concept. 3D Rendering. Trend decrease illustrations Red downward arrow with stock market data and candlestick chart on white background. 3D Rendering. Red downward arrow with stock market data and candlestick chart on white background, showcasing financial decline, business concept. 3D Rendering
Free with trial A cheerful cartoon businessman in a suit stands proudly beside a rising bar graph, illustrating positive financial growth and business success. Trend decrease illustrations Smiling Businessman Presenting Financial Growth Chart. A cheerful cartoon businessman in a suit stands proudly beside a rising bar graph, illustrating positive financial growth and business success.
Free with trial This image features a simple, bold black down arrow icon, perfect for indicating downloads, progress, or direction. The clean design is versatile for website design, mobile apps, and user interfaces. Trend decrease vectors Bold Black Down Arrow Icon Simple, Clean Download Sign. This image features a simple, bold black down arrow icon, perfect for indicating downloads, progress, or direction. The clean design is versatile for website design, mobile apps, and user interfaces.
Free with trial Data graph with warning sign indicating a significant stock market decline. The image visually represents a sudden drop in market value. Trend decrease vectors Urgent Important Data Graph Showing Stock Market Drop. Data graph with warning sign indicating a significant stock market decline. The image visually represents a sudden drop in market value.
Free with trial Red downward chart. Financial market crash with red arrow. Flat vector illustration isolated on white background. Trend decrease vectors Red downward chart. Flat vector illustration isolated on white. Red downward chart. Financial market crash with red arrow. Flat vector illustration isolated on white background.
Free with trial A stressed businessman in a suit stands on steps against a wall, holding a downward-trending red arrow graph, symbolizing economic recession, market decline, and financial crisis. The image represents business failure, loss, and negative trends, but also offers potential for problem-solving and finding solutions, generated by AI. Trend decrease illustrations Businessman holding downward trending red arrow graph. A stressed businessman in a suit stands on steps against a wall, holding a downward-trending red arrow graph, symbolizing economic recession, market decline, and financial crisis. The image represents business failure, loss, and negative trends, but also offers potential for problem-solving and finding solutions, generated by AI.
Free with trial Isometric 3d red arrow pointing down over decreasing graph bars, concept of business loss. Trend decrease illustrations Red arrow pointing down over decreasing graph bars showing losses. Isometric 3d red arrow pointing down over decreasing graph bars, concept of business loss
Free with trial Presentation graph projection outline flat white icons on round color backgrounds. 6 bonus icons included. Trend decrease vectors Presentation graph projection outline flat round icons. Presentation graph projection outline flat white icons on round color backgrounds. 6 bonus icons included
Free with trial Dreamstime for your design Red arrow down chart on wall. Stock market crash concept. Trend decrease illustrations Red arrow down chart on wall. Stock market crash concept.
Free with trial A white line graph with black circular points ascends diagonally across a solid orange background. The line is illuminated, casting a subtle shadow. Trend decrease illustrations White line graph with black dots on orange background. A white line graph with black circular points ascends diagonally across a solid orange background. The line is illuminated, casting a subtle shadow
Free with trial Statics arrow down Flat outline Collection in Black and white background. Trend decrease vectors Statics arrow down flat and simple set design. Statics arrow down Flat outline Collection in Black and white background
Free with trial The fall chart goes down from the cliff on a light background. Trend decrease illustrations The fall chart goes down from the cliff on a light background.
Free with trial A collection of red and green arrows, some pointing up and others down, symbolizing market fluctuations and financial performance. Trend decrease illustrations Upward and downward arrows representing market trends. A collection of red and green arrows, some pointing up and others down, symbolizing market fluctuations and financial performance
Free with trial A vibrant, modern icon depicting a financial growth chart, representing investment and market analysis. The design features ascending lines and bars, suggesting positive trends. This graphic was generated by AI for illustrative purposes. A representation of financial success. Trend decrease illustrations Financial Growth Chart Icon - Business Investment Concept. A vibrant, modern icon depicting a financial growth chart, representing investment and market analysis. The design features ascending lines and bars, suggesting positive trends. This graphic was generated by AI for illustrative purposes. A representation of financial success.
Free with trial A 3D rendering shows a red, downward-trending graph on a tablet screen, illustrating a market decline. The image, generated by AI, vividly represents financial loss and market instability. This visualization is ideal for illustrating economic trends and analysis. Trend decrease illustrations AI-Generated Market Decline Visualization. A 3D rendering shows a red, downward-trending graph on a tablet screen, illustrating a market decline. The image, generated by AI, vividly represents financial loss and market instability. This visualization is ideal for illustrating economic trends and analysis.
Free with trial This 3D graphic depicts a sharp market downturn, visualized with a red arrow plummeting downwards along a gridded bar chart. The image is generated by AI, offering a compelling visual representation of economic decline and financial loss. It showcases the potential for significant drops in various. Trend decrease illustrations AI-Generated Market Decline Visualization. This 3D graphic depicts a sharp market downturn, visualized with a red arrow plummeting downwards along a gridded bar chart. The image is generated by AI, offering a compelling visual representation of economic decline and financial loss. It showcases the potential for significant drops in various
Free with trial This image showcases a vibrant 3D rendering of various financial charts, including bar graphs, pie charts, and a rising arrow, symbolizing growth and profitability. Ideal for presentations, reports, and financial articles. Trend decrease illustrations Colorful 3D Financial Charts Showing Growth and Profit. This image showcases a vibrant 3D rendering of various financial charts, including bar graphs, pie charts, and a rising arrow, symbolizing growth and profitability. Ideal for presentations, reports, and financial articles.
Free with trial A stylized digital graph depicts fluctuating market trends using bar columns and a connected line with bright orange data points. Trend decrease illustrations Abstract digital graph showing financial market trends. A stylized digital graph depicts fluctuating market trends using bar columns and a connected line with bright orange data points
Free with trial Vector illustration of a falling stock market graph. Red candlestick and line charts show a bearish trend, representing financial crisis and economic recession. Trend decrease vectors Red Financial Chart Downtrend Stock Market Crash Concept. Vector illustration of a falling stock market graph. Red candlestick and line charts show a bearish trend, representing financial crisis and economic recession.
Free with trial Concept Abstract Art, Blue Watercolor, Financial Growth, Chart, Abstract Design Abstract Blue Watercolor Financial Growth Chart. Trend decrease illustrations Abstract Blue Watercolor Financial Growth Chart. Concept Abstract Art, Blue Watercolor, Financial. Concept Abstract Art, Blue Watercolor, Financial Growth, Chart, Abstract Design Abstract Blue Watercolor Financial Growth Chart
Free with trial Icon of an arrow pointing down on a shopping cart, representing decreasing sales. Trend decrease vectors Arrow pointing down on shopping cart icon showing decreasing sales. Icon of an arrow pointing down on a shopping cart, representing decreasing sales
Free with trial A stylized chart with bars and a line graph is displayed in a soft speech bubble against a simple background great for business or infographic presentations. Trend decrease illustrations Analyzing Data Chart in Speech Bubble for Presentation. A stylized chart with bars and a line graph is displayed in a soft speech bubble against a simple background great for business or infographic presentations
Free with trial A conceptual vector illustration representing a downturn in the real estate market. Trend decrease illustrations Real Estate Market Decline Vector Icon (1. A conceptual vector illustration representing a downturn in the real estate market
Free with trial Abstract fast falling arrows in red glow, representing stock collapse, bearish trend, investment risk, and negative business performance in modern financial industry. Trend decrease illustrations Glowing white arrows pointing downward with fast motion effect on dark background, symbolizing rapid market crash, economic. Abstract fast falling arrows in red glow, representing stock collapse, bearish trend, investment risk, and negative business performance in modern financial industry
Free with trial A 3D rendering depicts a sharp downturn in a stock market graph, visually representing a significant financial crash. The red arrow emphasizes the dramatic fall in value. Trend decrease illustrations 3D Stock Market Crash Graph Showing Significant Decline. A 3D rendering depicts a sharp downturn in a stock market graph, visually representing a significant financial crash. The red arrow emphasizes the dramatic fall in value.
Free with trial The image shows a red line graph sharply decreasing against a backdrop of a city skyline. A light blue line graph also shows a downward trend. Several stylized coronavirus illustrations are superimposed on the image. The overall color palette is cool toned, with the red graph line providing a stark contrast. The style is graphic and illustrative, suggesting a visual representation of economic, generated by AI. Trend decrease illustrations Red Decreasing Stock Market Graph Cityscape Coronavirus. The image shows a red line graph sharply decreasing against a backdrop of a city skyline. A light blue line graph also shows a downward trend. Several stylized coronavirus illustrations are superimposed on the image. The overall color palette is cool toned, with the red graph line providing a stark contrast. The style is graphic and illustrative, suggesting a visual representation of economic, generated by AI.
Free with trial A collection of twelve black and white vector icons representing various financial concepts. The set includes bar charts and line graphs illustrating growth and trends, a piggy bank for savings, bank buildings symbolizing financial institutions, a safe for security, currency symbols (dollar, euro, yen), and credit debit cards for payments. These icons are ideal for websites, presentations, and applications related to finance, economics, business, and personal money management. Trend decrease vectors Financial Icons Set: Growth, Savings, Banking, and Payments. A collection of twelve black and white vector icons representing various financial concepts. The set includes bar charts and line graphs illustrating growth and trends, a piggy bank for savings, bank buildings symbolizing financial institutions, a safe for security, currency symbols (dollar, euro, yen), and credit debit cards for payments. These icons are ideal for websites, presentations, and applications related to finance, economics, business, and personal money management.
Free with trial A 3D rendered bar chart composed of four colored blocks of varying heights. The blocks are blue, yellow, red, and white, arranged from shortest to tallest from left to right. The chart is presented on a clean white background, with subtle shadows beneath the blocks. Trend decrease illustrations Colorful 3D Bar Chart with Varying Heights on a White Background graph statistics. A 3D rendered bar chart composed of four colored blocks of varying heights. The blocks are blue, yellow, red, and white, arranged from shortest to tallest from left to right. The chart is presented on a clean white background, with subtle shadows beneath the blocks
Free with trial A collection of eight black and white, hand-drawn or doodle style icons. Each square icon features a different line graph, representing data, analytics, statistics, or financial trends. Trend decrease illustrations Set of hand drawn financial chart line graph icons isolated on white. A collection of eight black and white, hand-drawn or doodle style icons. Each square icon features a different line graph, representing data, analytics, statistics, or financial trends
Free with trial A collection of eight black and white, hand-drawn or doodle style icons. Each square icon features a different line graph, representing data, analytics, statistics, or financial trends. Trend decrease illustrations Set of hand drawn financial chart line graph icons isolated on white. A collection of eight black and white, hand-drawn or doodle style icons. Each square icon features a different line graph, representing data, analytics, statistics, or financial trends
Free with trial Collection of thirty charts and graphs icons in line style. Trend decrease vectors Collection of thirty charts and graphs icons in line style
Free with trial Online sales analysis laptop, charts, shopping cart, office, detailed background Generative AI. Trend decrease illustrations Online sales analysis laptop, charts, shopping cart, office