Free with trial Mauritius flag with a declining bar chart and down arrows, symbolizing decline in data, performance, or various national indicators in the country. Bar chart decrease illustrations Flag with a declining bar chart and down arrows
Free with trial Two distinct bar charts are depicted against a white background. The left chart a downward trend with bars in blue, yellow, and purple, accompanied by a yellow coin with a dollar sign and an arrow pointing down towards it from a small graph indicating a rising trend. The right chart an upward trend with bars in red, green, and blue, and a green coin with a dollar sign connected to a circle with a. Bar chart decrease illustrations Bar charts showing financial growth and decline with dollar symbols. Two distinct bar charts are depicted against a white background. The left chart a downward trend with bars in blue, yellow, and purple, accompanied by a yellow coin with a dollar sign and an arrow pointing down towards it from a small graph indicating a rising trend. The right chart an upward trend with bars in red, green, and blue, and a green coin with a dollar sign connected to a circle with a
Free with trial The image depicts a bar graph with a downward trend. The bars start high on the left and progressively decrease in height towards the right. A large red downward arrow further emphasizes the declining trend. Bar chart decrease vectors Decreasing trend in bar graph. The image depicts a bar graph with a downward trend. The bars start high on the left and progressively decrease in height towards the right. A large red downward arrow further emphasizes the declining trend
Free with trial 3d economic crisis bar graph chart with red arrow going down bankruptcy financial stock market crash downtrend symbol chart going down sign on green blue mint pastel color background 3D rendering. Bar chart decrease illustrations 3d economic crisis bar graph chart with red arrow going down bankruptcy financial stock market crash downtrend symbol chart going
Free with trial Financial bar chart with downward arrow indicating crisis and market collapse. Bar chart decrease vectors Financial bar chart with downward arrow indicating crisis
Free with trial A minimalist solid black icon of a bar chart with a downward arrow, representing financial loss, decline, decrease, or negative trend. Perfect for business, finance, analytics, and reporting projects. Clean and versatile for web, print, and digital use. Bar chart decrease vectors . A minimalist solid black icon of a bar chart with a downward arrow, representing financial loss, decline, decrease, or negative trend. Perfect for business, finance, analytics, and reporting projects. Clean and versatile for web, print, and digital use
Free with trial A 3D human character in a business suit and tie leans on a red bar chart with a descending, cracked arrow, representing a financial crisis or failure. Bar chart decrease illustrations 3D Businessman Character with a Crashing Red Financial Bar Chart. A 3D human character in a business suit and tie leans on a red bar chart with a descending, cracked arrow, representing a financial crisis or failure
Free with trial A business conception of a 3D human character descending a bar chart with a red arrow pointing down, illustrating a financial crisis or market crash. Bar chart decrease illustrations 3D Human Character Jumping Down a Falling Red Arrow Business Chart. A business conception of a 3D human character descending a bar chart with a red arrow pointing down, illustrating a financial crisis or market crash
Free with trial Chart arrows up and down. Green and red arrows. Decrease and increase graph vector illustration. Bar chart decrease vectors Chart arrows set. Chart arrows up and down. Green and red arrows. Decrease and increase graph vector illustration
Free with trial Dual financial chart with green upward and red downward bars and coin accents, ideal for finance articles, market reports, stock visuals, and economic presentations. Bar chart decrease vectors Stock market bar chart showing rising green bars and falling red bars with coins. Dual financial chart with green upward and red downward bars and coin accents, ideal for finance articles, market reports, stock visuals, and economic presentations
Free with trial A 3D illustration of a financial bar chart showing a drastic decline with a red arrow, symbolizing a stock market crash, recession, and economic loss. Bar chart decrease illustrations Market Crash 3D Bar Chart with Downward Arrow. A 3D illustration of a financial bar chart showing a drastic decline with a red arrow, symbolizing a stock market crash, recession, and economic loss
Free with trial A simple illustration of a bar chart with a downward arrow showing decline, loss, negative growth, or decreasing business and financial performance. Bar chart decrease vectors Business Decline Chart Illustration. A simple illustration of a bar chart with a downward arrow showing decline, loss, negative growth, or decreasing business and financial performance
Free with trial A cartoon woman with brown hair in a ponytail, wearing a blue shirt and red pants, stands confidently between two bar graphs. The green graph on the left shows an increase, while the purple graph on the right shows a decrease. The image is a simple, illustrative representation of data analysis or business concepts. Bar chart decrease vectors Woman Standing Between Two Bar Graphs. A cartoon woman with brown hair in a ponytail, wearing a blue shirt and red pants, stands confidently between two bar graphs. The green graph on the left shows an increase, while the purple graph on the right shows a decrease. The image is a simple, illustrative representation of data analysis or business concepts.
Free with trial A clean, flat design set of icons showing upward and downward arrows and a bar graph, perfect for illustrating financial trends, data, or concepts. Bar chart decrease vectors Green up arrow, red down arrow, and bar chart. A clean, flat design set of icons showing upward and downward arrows and a bar graph, perfect for illustrating financial trends, data, or concepts
Free with trial A businessman in a suit holds a glowing digital interface showing a growth bar chart and the words COST Focusing, representing financial strategy and cost management analysis. Bar chart decrease illustrations A businessman in a suit holds a glowing digital interface showing a growth bar chart and the words COST Focusing, representing
Free with trial A flat design vector illustration showing a graph with rising and falling bars, marked by green and red arrows indicating increase and decrease. Ideal for financial concepts. Bar chart decrease vectors Bar chart showing positive and negative data trends. A flat design vector illustration showing a graph with rising and falling bars, marked by green and red arrows indicating increase and decrease. Ideal for financial concepts
Free with trial Illustration of a descending bar graph with an arrow signifying decline. Percentage symbol indicates decrease. Minimalist flat style, on black background. Bar chart decrease vectors Declining bar graph with percentage drop indicator icon. Illustration of a descending bar graph with an arrow signifying decline. Percentage symbol indicates decrease. Minimalist flat style, on black background.
Free with trial Downward arrow, bar chart in browser window, abstract leaf shape. Ideal for business, analytics, environment, economy, growth planning strategy concepts. Simple flat metaphor. Bar chart decrease vectors Data Chart with Downward Arrow and Leaf Element for Trend Analysis and Growth Concept. Downward arrow, bar chart in browser window, abstract leaf shape. Ideal for business, analytics, environment, economy, growth planning strategy concepts. Simple flat metaphor
Free with trial Dollar sign falling down with a descending bar chart, representing financial decline, currency depreciation, or economic downturn. Bar chart decrease vectors Falling Dollar Symbol on Decreasing Bar Graph. Dollar sign falling down with a descending bar chart, representing financial decline, currency depreciation, or economic downturn
Free with trial Cost reduction concept with red downward arrow, bar chart, and coins on financial market background. Business finance idea for expense control, budgeting, and profit management. Bar chart decrease illustrations Cost Reduction Strategy with Financial Chart and Arrow 3d render. Cost reduction concept with red downward arrow, bar chart, and coins on financial market background. Business finance idea for expense control, budgeting, and profit management
Free with trial Cost reduction concept with red downward arrow, bar chart, and coins on financial market background. Business finance idea for expense control, budgeting, and profit management. Bar chart decrease illustrations Cost Reduction Strategy with Financial Chart and Arrow 3d render. Cost reduction concept with red downward arrow, bar chart, and coins on financial market background. Business finance idea for expense control, budgeting, and profit management
Free with trial Cost reduction concept with red downward arrow, bar chart, and coins on financial market background. Business finance idea for expense control, budgeting, and profit management. Bar chart decrease illustrations Cost Reduction Strategy with Financial Chart and Arrow 3d render. Cost reduction concept with red downward arrow, bar chart, and coins on financial market background. Business finance idea for expense control, budgeting, and profit management
Free with trial Cost reduction concept with red downward arrow, bar chart, and coins on financial market background. Business finance idea for expense control, budgeting, and profit management. Bar chart decrease illustrations Cost Reduction Strategy with Financial Chart and Arrow 3d render. Cost reduction concept with red downward arrow, bar chart, and coins on financial market background. Business finance idea for expense control, budgeting, and profit management
Free with trial Cost reduction concept with red downward arrow, bar chart, and coins on financial market background. Business finance idea for expense control, budgeting, and profit management. Bar chart decrease illustrations Cost Reduction Strategy with Financial Chart and Arrow 3d render. Cost reduction concept with red downward arrow, bar chart, and coins on financial market background. Business finance idea for expense control, budgeting, and profit management
Free with trial Cost reduction concept with red downward arrow, bar chart, and coins on financial market background. Business finance idea for expense control, budgeting, and profit management. Bar chart decrease illustrations Cost Reduction Strategy with Financial Chart and Arrow 3d render. Cost reduction concept with red downward arrow, bar chart, and coins on financial market background. Business finance idea for expense control, budgeting, and profit management
Free with trial Cost reduction concept with red downward arrow, bar chart, and coins on financial market background. Business finance idea for expense control, budgeting, and profit management. Bar chart decrease illustrations Cost Reduction Strategy with Financial Chart and Arrow 3d render. Cost reduction concept with red downward arrow, bar chart, and coins on financial market background. Business finance idea for expense control, budgeting, and profit management
Free with trial Cost reduction concept with red downward arrow, bar chart, and coins on financial market background. Business finance idea for expense control, budgeting, and profit management. Bar chart decrease illustrations Cost Reduction Strategy with Financial Chart and Arrow 3d render. Cost reduction concept with red downward arrow, bar chart, and coins on financial market background. Business finance idea for expense control, budgeting, and profit management
Free with trial Cost reduction concept with red downward arrow, bar chart, and coins on financial market background. Business finance idea for expense control, budgeting, and profit management. Bar chart decrease illustrations Cost Reduction Strategy with Financial Chart and Arrow 3d render. Cost reduction concept with red downward arrow, bar chart, and coins on financial market background. Business finance idea for expense control, budgeting, and profit management
Free with trial Up and down sign with green and red arrows vector illustration, sales bar chart symbol icon with arrow moving down and bar chart with arrow moving up, EPS 10. Bar chart decrease vectors Up and down sign with green and red arrows vector illustration, sales bar chart symbol icon. Up and down sign with green and red arrows vector illustration, sales bar chart symbol icon with arrow moving down and bar chart with arrow moving up, EPS 10
Free with trial An abstract visual representation of data, featuring a vibrant red bar chart resembling a cityscape or sound wave, overlaid with a line graph and connecting dots. This dynamic graphic is ideal for concepts related to financial analysis, business intelligence, or data visualization. Bar chart decrease illustrations Red Abstract Bar Chart Waveform with Connecting Dots and Lines - Data Analysis. An abstract visual representation of data, featuring a vibrant red bar chart resembling a cityscape or sound wave, overlaid with a line graph and connecting dots. This dynamic graphic is ideal for concepts related to financial analysis, business intelligence, or data visualization.
Free with trial Futuristic Declining Bar Chart with Downward Arrow on Dark Background, Financial Loss and Negative Trend Concept. Bar chart decrease vectors Futuristic Declining Bar Chart with Downward Arrow on Dark Background
Free with trial A simple illustration of a declining blue bar graph against a black background. Represents loss or decrease. Bar chart decrease vectors Declining bar graph demonstrating financial loss and recession illustration. A simple illustration of a declining blue bar graph against a black background. Represents loss or decrease.
Free with trial This image displays a 3D bar graph with five vertical bars of decreasing height, rendered in a vibrant pink color. A pink line graph with a sharp downward trajectory originates from the top of the tallest bar and descends across the bars, ending at the base of the shortest bar. The entire composition is isolated on a clean white background, clearly illustrating a negative trend or decline. Bar chart decrease illustrations A pink 3D bar graph with a descending line graph on a white background chart. This image displays a 3D bar graph with five vertical bars of decreasing height, rendered in a vibrant pink color. A pink line graph with a sharp downward trajectory originates from the top of the tallest bar and descends across the bars, ending at the base of the shortest bar. The entire composition is isolated on a clean white background, clearly illustrating a negative trend or decline
Free with trial Up and Down sign with green and red arrows vector illustration. Concept of sales bar chart symbol icon with arrow moving down and sales bar chart with arrow moving up. Bar chart decrease vectors Up and Down sign with green and red arrows vector illustration. Concept of sales bar chart symbol icon
Free with trial A 3D financial chart depicting a stock market downturn. The chart features blue and pink bar graphs with numerical values like 45,971 and 37,020. A red downward-curving line with arrows illustrates the declining trend. The background is dark, emphasizing the vibrant colors of the bars and line. Small numbers indicate data points along the bottom, highlighting the decrease in value over time. The visual representation effectively conveys a negative financial trend. Bar chart decrease illustrations Declining Stock Market Performance Financial Charts Showing Downturn Trend. A 3D financial chart depicting a stock market downturn. The chart features blue and pink bar graphs with numerical values like 45,971 and 37,020. A red downward-curving line with arrows illustrates the declining trend. The background is dark, emphasizing the vibrant colors of the bars and line. Small numbers indicate data points along the bottom, highlighting the decrease in value over time. The visual representation effectively conveys a negative financial trend.
Free with trial Circular chart icon presenting a bar graph visualizing statistical data, analytics, and business reports, symbolizing financial decline, data analysis, and market trends. Bar chart decrease vectors Circular chart icon showing declining bar graph. Circular chart icon presenting a bar graph visualizing statistical data, analytics, and business reports, symbolizing financial decline, data analysis, and market trends
Free with trial A clean, minimalist 3D bar chart made of translucent blue blocks illustrates a steady decline. This powerful visual represents concepts like economic downturn, financial recession, reduced sales, or negative performance data, making it ideal for business reports and presentations. Bar chart decrease illustrations Economic Downturn Concept with Blue Bar Graph. A clean, minimalist 3D bar chart made of translucent blue blocks illustrates a steady decline. This powerful visual represents concepts like economic downturn, financial recession, reduced sales, or negative performance data, making it ideal for business reports and presentations
Free with trial A stack of gold coins and bars sit on top of a chart with a downward trend. The chart shows a decrease in value, while the gold coins and bars remain valuable. Bar chart decrease illustrations A stack of gold coins and bars sit on top of a chart with a downward trend
Free with trial A black icon depicts a bar graph with four ascending bars. An upward-trending curved arrow originates from the left and sweeps over the bars, indicating growth. A downward-pointing arrow is positioned below the bars on the right. The text "APERTURE F 1. 4 ISO 1600" is visible below the graphic. Bar chart decrease illustrations Black Bar Graph with Upward Trending Arrow and Downward Arrow Icon chart statistics. A black icon depicts a bar graph with four ascending bars. An upward-trending curved arrow originates from the left and sweeps over the bars, indicating growth. A downward-pointing arrow is positioned below the bars on the right. The text "APERTURE F 1.4 ISO 1600" is visible below the graphic
Free with trial A stylized candlestick chart, commonly used in financial trading, is presented on a white background. The chart consists of several vertical bars, alternating in color between green (indicating an increase in price) and red (indicating a decrease in price). Each bar has a thin gold line extending from its top and bottom, representing wicks. Bar chart decrease illustrations Candlestick Chart with Green and Red Bars on White Background stock market finance. A stylized candlestick chart, commonly used in financial trading, is presented on a white background. The chart consists of several vertical bars, alternating in color between green (indicating an increase in price) and red (indicating a decrease in price). Each bar has a thin gold line extending from its top and bottom, representing wicks
Free with trial A financial report document lies flat on a white surface, displaying the text "FINANCIAL REPORT". Rising from the document are several translucent 3D bars in shades of purple, blue, and green, arranged in ascending order. To the right of the bars is a colorful 3D pie chart with segments in yellow, red, orange, and blue. Bar chart decrease illustrations Financial Report with 3D Bar Graph and Pie Chart on White Background document paper. A financial report document lies flat on a white surface, displaying the text "FINANCIAL REPORT". Rising from the document are several translucent 3D bars in shades of purple, blue, and green, arranged in ascending order. To the right of the bars is a colorful 3D pie chart with segments in yellow, red, orange, and blue
Free with trial A 3D icon depicts a financial graph. The icon features a rounded purple square with a lighter purple top edge. Inside, a yellow line chart with circular data points shows an upward trend, overlaid on a series of yellow vertical bars representing a bar chart. The overall design is clean and modern, symbolizing data analysis, business growth, and financial performance. Bar chart decrease illustrations 3D icon representing a financial graph with bars and a line chart on a purple background. A 3D icon depicts a financial graph. The icon features a rounded purple square with a lighter purple top edge. Inside, a yellow line chart with circular data points shows an upward trend, overlaid on a series of yellow vertical bars representing a bar chart. The overall design is clean and modern, symbolizing data analysis, business growth, and financial performance
Free with trial 3D chart illustration showing a red arrow and decreasing blue bars on a light background, representing loss, decline or negative trend. Bar chart decrease illustrations . 3D chart illustration showing a red arrow and decreasing blue bars on a light background, representing loss, decline or negative trend
Free with trial A hand-drawn bar chart shows a downward trend with a line graph indicating a significant decrease in value over time. Bar chart decrease vectors Downturn graph illustrating declining trends and financial loss. A hand-drawn bar chart shows a downward trend with a line graph indicating a significant decrease in value over time
Free with trial A 3D rendered cartoon hand with a black cuff and white shirt sleeve points its index finger downwards towards a red bar chart. The chart displays a clear downward trend with bars of decreasing height in green, yellow, orange, and red, set on a dark gray base against a white background. Bar chart decrease illustrations 3D Cartoon Hand Pointing Down at Declining Bar Chart on White Background graph decline. A 3D rendered cartoon hand with a black cuff and white shirt sleeve points its index finger downwards towards a red bar chart. The chart displays a clear downward trend with bars of decreasing height in green, yellow, orange, and red, set on a dark gray base against a white background
Free with trial Orange bar chart with downward arrow vector illustration. Financial loss, economic recession, market crash, business failure, negative growth, data analysis. Declining graph with falling trend. Bar chart decrease vectors Decreasing bar chart with downward arrow showing financial loss and economic recession vector illustration. Orange bar chart with downward arrow vector. Orange bar chart with downward arrow vector illustration. Financial loss, economic recession, market crash, business failure, negative growth, data analysis. Declining graph with falling trend
Free with trial A circular icon containing a stylized representation of financial data. The icon features a series of black vertical bars of varying heights, suggesting a bar chart. Overlaid on the bars are two thin lines, one black and one grey, depicting line graphs with peaks and troughs, indicating fluctuating trends. The overall design is minimalist and symbolic, suitable for representing business analytics. Bar chart decrease illustrations Circular Graph Icon with Bar and Line Charts Representing Financial Data and Trends business. A circular icon containing a stylized representation of financial data. The icon features a series of black vertical bars of varying heights, suggesting a bar chart. Overlaid on the bars are two thin lines, one black and one grey, depicting line graphs with peaks and troughs, indicating fluctuating trends. The overall design is minimalist and symbolic, suitable for representing business analytics
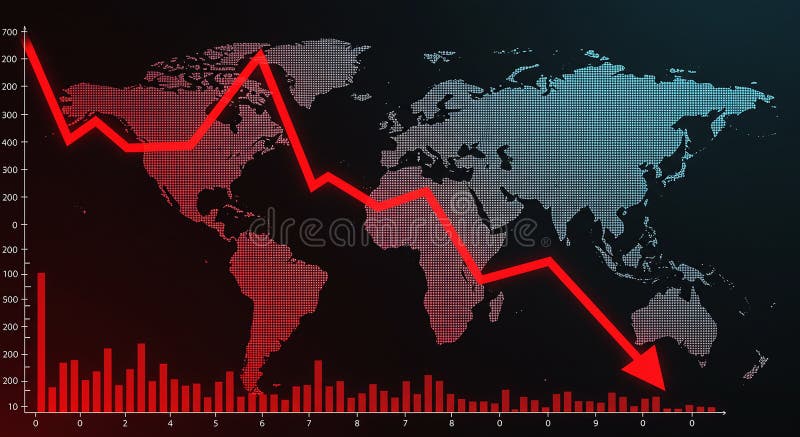
Free with trial World map with a red declining line graph overlay, illustrating a decrease or economic downturn. The graph features sharp declines across various data points, reflecting a downward trend. Red bar chart at the bottom represents additional numerical data against a black background. The map uses a dotted pattern for continents, highlighting regions globally. The image conveys financial analysis, market trends, or economic statistics. Bar chart decrease illustrations World map with a red declining line graph overlay
Free with trial A 3D render illustrating a concept of financial decline and economic recession. The image features a red bar chart with progressively shorter bars, indicating a downward trend. A bold, red arrow follows this negative trajectory, pointing sharply downwards. Set against a clean, neutral gray background, this graphic powerfully symbolizes concepts like business failure, stock market crash, investment loss, sales decrease, and economic crisis. It's a perfect visual for presentations, reports, and articles discussing financial downturns, poor performance, and negative growth. Bar chart decrease illustrations Financial Decline Graph with Red Arrow Down. A 3D render illustrating a concept of financial decline and economic recession. The image features a red bar chart with progressively shorter bars, indicating a downward trend. A bold, red arrow follows this negative trajectory, pointing sharply downwards. Set against a clean, neutral gray background, this graphic powerfully symbolizes concepts like business failure, stock market crash, investment loss, sales decrease, and economic crisis. It's a perfect visual for presentations, reports, and articles discussing financial downturns, poor performance, and negative growth.
Free with trial Black and white icon of a bar graph with a diagonal arrow indicating a sharp decline. Bar chart decrease illustrations Falling bar graph with diagonal arrow showing sharp decline bar chart. Black and white icon of a bar graph with a diagonal arrow indicating a sharp decline
Free with trial This image depicts a bar graph with a clear downward trend. Blue bars decrease in height from left to right, representing a decline in value. A bold red arrow overlays the bars, visually emphasizing the negative trend. A blue line also shows a downward trend. The image conveys a sense of loss, recession, or negative performance and is suitable for illustrating financial or economic concepts. Bar chart decrease illustrations Declining Bar Graph with Downward Trend Lines. This image depicts a bar graph with a clear downward trend. Blue bars decrease in height from left to right, representing a decline in value. A bold red arrow overlays the bars, visually emphasizing the negative trend. A blue line also shows a downward trend. The image conveys a sense of loss, recession, or negative performance and is suitable for illustrating financial or economic concepts.
Free with trial This image depicts a visual representation of financial or business growth and decline using a series of ascending and descending three-dimensional bar charts, where the left side shows smaller bars gradually increasing in height, transitioning through a central flat bar, and shifting to taller bars on the right side that progressively decrease, all set against a plain white background to. Bar chart decrease illustrations Growth and progress concept with ascending and descending bar charts illustrating business success and financial improvement over. This image depicts a visual representation of financial or business growth and decline using a series of ascending and descending three-dimensional bar charts, where the left side shows smaller bars gradually increasing in height, transitioning through a central flat bar, and shifting to taller bars on the right side that progressively decrease, all set against a plain white background to
Free with trial An isometric 3D bar graph with three descending steps, made of a glossy, reflective material with a blue and purple gradient. This illustrates a decrease or decline. Concept of financial loss or reduced metrics. Bar chart decrease vectors Blue and Purple Isometric Bar Graph Showing a Downtrend. An isometric 3D bar graph with three descending steps, made of a glossy, reflective material with a blue and purple gradient. This illustrates a decrease or decline. Concept of financial loss or reduced metrics
Free with trial Black bar graph with downward arrows indicating a decline or loss on a white background. Bar chart decrease illustrations Falling bar graph with downward arrows indicating decline or loss chart. Black bar graph with downward arrows indicating a decline or loss on a white background
Free with trial A black bar labeled PRICE tapers to a point above a long black bar labeled BASE. Clear details and vibrant col. Bar chart decrease illustrations Black price bar tapering to a point above a long base bar on white graph chart. A black bar labeled PRICE tapers to a point above a long black bar labeled BASE. Clear details and vibrant col
Free with trial A black icon showing two bars of different heights with a downward arrow pointing to the smaller bar. Bar chart decrease illustrations Black icon of two bars with a downward arrow pointing to the smaller bar chart. A black icon showing two bars of different heights with a downward arrow pointing to the smaller bar
Free with trial Stacked brown boxes beside upward and downward arrows with a bar chart. Ideal for logistics, supply chain, e-commerce, shipping, inventory, warehouse, and business growth. Simple flat metaphor. Bar chart decrease vectors Shipment Tracking and Inventory Management with Stacked Boxes and Growth Chart. Stacked brown boxes beside upward and downward arrows with a bar chart. Ideal for logistics, supply chain, e-commerce, shipping, inventory, warehouse, and business growth. Simple flat metaphor
Free with trial A 3D bar graph illustrating a downward trend with a green arrow, featuring a heart icon with a minus sign, on a white background. Bar chart decrease illustrations 3D bar graph with a downward trending green arrow and a heart icon with a minus sign chart. A 3D bar graph illustrating a downward trend with a green arrow, featuring a heart icon with a minus sign, on a white background
Free with trial A black icon showing a bar graph with a downward trending arrow indicating a decline. Bar chart decrease illustrations Black bar graph with downward trending arrow icon on white background chart decline. A black icon showing a bar graph with a downward trending arrow indicating a decline
Free with trial Up and Down sign with golden arrows isolated on a black, vector illustration. Concept of sales bar chart symbol icon with arrow moving down and sales bar chart with gold arrows moving up and down. Bar chart decrease vectors Up and Down sign with golden arrows isolated on a black, vector illustration. Concept of sales bar chart symbol
Free with trial Simple black bar graph icon with bars of varying heights on a white background Clear details and vibrant color. Bar chart decrease illustrations Simple black bar graph icon showing varying heights on a white background chart data. Simple black bar graph icon with bars of varying heights on a white background Clear details and vibrant color
Free with trial A flat design illustration of two bar charts, one green and one red, both showing a downward trend with arrows, representing financial or business decline. Bar chart decrease illustrations Bar chart showing declining trend isolated on white background. A flat design illustration of two bar charts, one green and one red, both showing a downward trend with arrows, representing financial or business decline
Free with trial A clear visual representation of a downward trend on a bar chart. The red arrow starkly indicates a falling trajectory, suitable for financial or economic contexts. Bar chart decrease illustrations Financial chart shows decline with downward trending red arrow. A clear visual representation of a downward trend on a bar chart. The red arrow starkly indicates a falling trajectory, suitable for financial or economic contexts
Free with trial Declining Bar Chart Shows Economic Downturn Illustration Red Arrow Signifies Loss Trend. Bar chart decrease vectors Declining Bar Chart Shows Economic Downturn Illustration Red Arrow Signifies Loss Trend
Free with trial Illustrated business chart displays a drop in finances, demonstrated through declining bar graphs and a downward trending line. Geometric shapes and a dollar sign add visual interest to the illustration. Bar chart decrease illustrations Financial Decline Shown by Business Chart with Graphic Elements. Illustrated business chart displays a drop in finances, demonstrated through declining bar graphs and a downward trending line. Geometric shapes and a dollar sign add visual interest to the illustration.
Free with trial Blue Glass 3D Bar Chart Showing Data Decline. Bar chart decrease illustrations Blue Glass 3D Bar Chart Showing Data Decline
Free with trial Bar graph showing decreasing values alongside arrows moving toward a minimal cloud. Ideal for data analysis, statistics, regression, performance tracking, economy, analytics, simple flat metaphor. Bar chart decrease vectors Declining Bar Chart with Arrows and Cloud Representing Regression or Data Flow. Bar graph showing decreasing values alongside arrows moving toward a minimal cloud. Ideal for data analysis, statistics, regression, performance tracking, economy, analytics, simple flat metaphor
Free with trial A globe with a map of the world on it, sitting next to a set of orange bar graphs. Bar chart decrease illustrations A globe sitting on top of a table next to a bar chart. A globe with a map of the world on it, sitting next to a set of orange bar graphs
Free with trial A stylized declining bar chart with a downward arrow on a red, yellow, and dark backdrop, conveying a sense of financial loss. Bar chart decrease illustrations Declining bar chart with arrow on a red yellow and dark backdrop. a stylized declining bar chart with a downward arrow on a red, yellow, and dark backdrop, conveying a sense of financial loss
Free with trial A vibrant, flat-design illustration depicts a bar graph with a downward-trending arrow, suggesting a decline in data. The graph features bars in red, yellow, green, and blue, set against a clean white background. The composition is simple, yet conveys a clear message of financial or performance decrease. Bar chart decrease illustrations Colorful Bar Graph with Declining Trend and Arrows, Business Concept. A vibrant, flat-design illustration depicts a bar graph with a downward-trending arrow, suggesting a decline in data. The graph features bars in red, yellow, green, and blue, set against a clean white background. The composition is simple, yet conveys a clear message of financial or performance decrease
Free with trial Red sad face beside a line graph showing a downward trend and a bar graph. Ideal for business loss, economic decline, performance issues, challenges, setbacks, analytics, trends. Simple flat metaphor. Bar chart decrease vectors Declining Chart with Sad Face and Bar Graph Representing Negative Trend and Challenges. Red sad face beside a line graph showing a downward trend and a bar graph. Ideal for business loss, economic decline, performance issues, challenges, setbacks, analytics, trends. Simple flat metaphor
Free with trial This graphic depicts a bar chart with a downward trending line, observed closely with a magnifying glass, symbolizing scrutiny, analysis, and potential performance decline or investigation of data. Bar chart decrease vectors Declining Chart with Magnifying Glass: Analysis and Performance Review. This graphic depicts a bar chart with a downward trending line, observed closely with a magnifying glass, symbolizing scrutiny, analysis, and potential performance decline or investigation of data.
Free with trial A bar graph illustrates a decreasing trend in financial performance, indicated by a red arrow and a dollar symbol. Bar chart decrease illustrations Bar chart showing financial decline with downward trend and dollar sign. A bar graph illustrates a decreasing trend in financial performance, indicated by a red arrow and a dollar symbol
Free with trial This infographic displays a bar graph illustrating a sharp negative trend. The red line clearly depicts a significant decrease, showcasing concepts like downturn, recession, and loss within a business or financial context. Ideal for presentations, reports, and analyses highlighting negative market trends or economic decline, generated by AI. Bar chart decrease illustrations Decreasing bar graph showing negative trend decline. This infographic displays a bar graph illustrating a sharp negative trend. The red line clearly depicts a significant decrease, showcasing concepts like downturn, recession, and loss within a business or financial context. Ideal for presentations, reports, and analyses highlighting negative market trends or economic decline, generated by AI.
Free with trial Bar chart showing a steep downward trend with a large arrow indicating decline. Bar chart decrease vectors Bar chart showing a steep downward trend with a large arrow indicating decline
Free with trial Business decline, Businessman examines decreasing bar graph and chart. Bar chart decrease vectors Business decline, Businessman examines decreasing bar graph and chart
Free with trial Bar graph with declining values, percentage on black square, globe in blue square. Ideal for data, statistics, global business, market trends, finance, analysis research flat simple metaphor. Bar chart decrease vectors Bar chart with decreasing bars alongside percentage and globe icons for data and global analytics. Bar graph with declining values, percentage on black square, globe in blue square. Ideal for data, statistics, global business, market trends, finance, analysis research flat simple metaphor