Free with trial An artistic creation that reflects beauty in simplicity. The design highlights precision, clean details, and a harmonious flow, resulting in a versatile and professional visual outcome. Bar chart decrease vectors Business lion Presenting bar graph chart. An artistic creation that reflects beauty in simplicity. The design highlights precision, clean details, and a harmonious flow, resulting in a versatile and professional visual outcome
Free with trial A set of four black and white icons illustrating volume control. Two icons depict increasing volume with a speaker symbol and an upward arrow alongside a rising bar graph. The other two icons represent decreasing volume with a speaker symbol and a downward arrow next to a falling bar graph. These clean, minimalist graphics are ideal for user interfaces, apps, and digital media. Bar chart decrease vectors Volume Control Icons: Up and Down. A set of four black and white icons illustrating volume control. Two icons depict increasing volume with a speaker symbol and an upward arrow alongside a rising bar graph. The other two icons represent decreasing volume with a speaker symbol and a downward arrow next to a falling bar graph. These clean, minimalist graphics are ideal for user interfaces, apps, and digital media.
Free with trial This minimalist graphic illustration features a series of vertical green bars arranged in descending order of height. A bold black diagonal arrow points downwards across the top of the bars, symbolizing a decline or negative performance. The clean design uses a flat aesthetic against a plain background, making it ideal for business presentations or financial reports. Bar chart decrease vectors A simple green bar chart showing a downward trend with a black arrow. This minimalist graphic illustration features a series of vertical green bars arranged in descending order of height. A bold black diagonal arrow points downwards across the top of the bars, symbolizing a decline or negative performance. The clean design uses a flat aesthetic against a plain background, making it ideal for business presentations or financial reports
Free with trial A comprehensive vector icon collection illustrating various aspects of financial crises, market downturns, and economic challenges. This set includes symbols like bull and bear market dynamics, broken shields representing risk and vulnerability, declining bar charts, candlestick patterns, and emergency indicators. Concepts such as bankruptcy, recession, financial loss, and market volatility are visually conveyed. Ideal for financial news, economic reports, business presentations, educational materials, and articles discussing market risks or economic forecasts. Bar chart decrease vectors Financial Crisis, Market Downturn, and Bankruptcy Vector Icons Set. A comprehensive vector icon collection illustrating various aspects of financial crises, market downturns, and economic challenges. This set includes symbols like bull and bear market dynamics, broken shields representing risk and vulnerability, declining bar charts, candlestick patterns, and emergency indicators. Concepts such as bankruptcy, recession, financial loss, and market volatility are visually conveyed. Ideal for financial news, economic reports, business presentations, educational materials, and articles discussing market risks or economic forecasts.
Free with trial A conceptual vector illustration depicting a severe economic downturn. The image features a grey bar chart with progressively shorter bars, symbolizing declining profits or performance. A bold red arrow points sharply downwards, representing a crash or significant loss, alongside a blue line graph also showing a negative trend. This graphic is ideal for illustrating concepts such as financial crisis, recession, stock market crash, business failure, bankruptcy, and negative growth. Perfect for financial reports, business presentations, news articles, and economic analysis infographics. Bar chart decrease illustrations Economic Downturn and Financial Crisis Graph. A conceptual vector illustration depicting a severe economic downturn. The image features a grey bar chart with progressively shorter bars, symbolizing declining profits or performance. A bold red arrow points sharply downwards, representing a crash or significant loss, alongside a blue line graph also showing a negative trend. This graphic is ideal for illustrating concepts such as financial crisis, recession, stock market crash, business failure, bankruptcy, and negative growth. Perfect for financial reports, business presentations, news articles, and economic analysis infographics.
Free with trial A striking 3D rendering depicts a significant financial market decline, symbolized by a bold red arrow sharply pointing downwards across a dark grey background. The scene includes a subtle line graph and bar charts in shades of red and grey, illustrating a negative trend in data. This image effectively conveys concepts of economic recession, stock market crash, business losses, and financial crisis. Ideal for articles, presentations, and reports discussing market downturns, investment risks, or economic challenges. Bar chart decrease illustrations Financial Market Decline with Red Arrow Chart. A striking 3D rendering depicts a significant financial market decline, symbolized by a bold red arrow sharply pointing downwards across a dark grey background. The scene includes a subtle line graph and bar charts in shades of red and grey, illustrating a negative trend in data. This image effectively conveys concepts of economic recession, stock market crash, business losses, and financial crisis. Ideal for articles, presentations, and reports discussing market downturns, investment risks, or economic challenges.
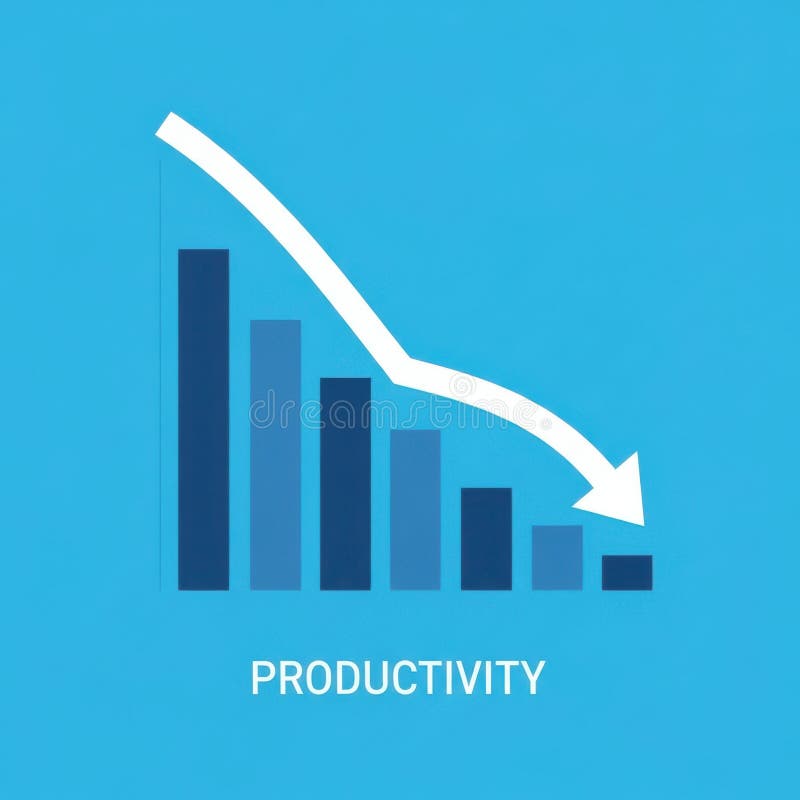
Free with trial A bar graph visually represents a downward trend in productivity over time, indicating a decline in efficiency or output. Bar chart decrease illustrations Decreasing Productivity Graph Showing Decline. A bar graph visually represents a downward trend in productivity over time, indicating a decline in efficiency or output
Free with trial A collection of nine simple, solid black icons on a white background, illustrating concepts of decline, loss, and negative trends using various charts like bar graphs, line graphs, and pie charts with downward pointing arrows. Bar chart decrease vectors Set of black icons representing financial decrease and downward trends. A collection of nine simple, solid black icons on a white background, illustrating concepts of decline, loss, and negative trends using various charts like bar graphs, line graphs, and pie charts with downward pointing arrows
Free with trial A comprehensive collection of hand-drawn business and data visualization icons. This doodle-style set features a variety of essential elements, including different types of arrows, bar graphs, line charts, and pie charts. The sketchy, black and white illustrations are perfect for infographics, presentations, financial reports, and marketing materials. Each icon is isolated on a white background, representing concepts like growth, statistics, process flow, and direction. This versatile vector set is ideal for adding a creative, hand-made touch to any project related to analytics, finance, or strategy. Bar chart decrease illustrations Hand Drawn Business and Finance Doodle Icon Set. A comprehensive collection of hand-drawn business and data visualization icons. This doodle-style set features a variety of essential elements, including different types of arrows, bar graphs, line charts, and pie charts. The sketchy, black and white illustrations are perfect for infographics, presentations, financial reports, and marketing materials. Each icon is isolated on a white background, representing concepts like growth, statistics, process flow, and direction. This versatile vector set is ideal for adding a creative, hand-made touch to any project related to analytics, finance, or strategy.
Free with trial This vector illustration set features six distinct icons representing key financial and economic concepts. It includes bar charts depicting growth with a green arrow and decline with a red arrow, alongside currency exchange rate indicators for USD, INR, and EUR. Two donut charts visualize data distribution, while a world map colored green and red signifies global market trends or segmentation. Ideal for business presentations, financial reports, economic analysis, and investment-related content, these versatile graphics convey complex data clearly and concisely. Bar chart decrease vectors Financial Growth, Decline, and Global Market Data Visualization Icons Set. This vector illustration set features six distinct icons representing key financial and economic concepts. It includes bar charts depicting growth with a green arrow and decline with a red arrow, alongside currency exchange rate indicators for USD, INR, and EUR. Two donut charts visualize data distribution, while a world map colored green and red signifies global market trends or segmentation. Ideal for business presentations, financial reports, economic analysis, and investment-related content, these versatile graphics convey complex data clearly and concisely.
Free with trial A stark red arrow dramatically descends across a series of blue bars, illustrating a significant downward trend. Bar chart decrease illustrations Red arrow shows sharp decline on blue bar graph. A stark red arrow dramatically descends across a series of blue bars, illustrating a significant downward trend
Free with trial Abstract 3d bar charts illustrating data visualization, financial statistics, and business analysis, presenting growth and decline trends in a report format. Bar chart decrease illustrations Business data visualization showing 3d bar graphs. Abstract 3d bar charts illustrating data visualization, financial statistics, and business analysis, presenting growth and decline trends in a report format
Free with trial Economic critical crisis concept. The bar garph with red drop down arrow on red background. Recession financial, cryptocurrency, gold, and the stock market. Losing money and cash. Bearish. Bar chart decrease vectors Economic critical crisis concept. The bar garph with red drop down arrow on red background. Recession financial, cryptocurrency
Free with trial Collection of business growth and financial analysis icons featuring bar charts and arrows with editable line art and flat shape style. Editable vector icon set. Bar chart decrease vectors Collection of business growth and financial analysis icons featuring bar charts and arrows with editable line art and flat shape
Free with trial Stylized data illustrates financial increase using dollar signs, bar graphs, and arrows. Some data trends down while other data trends up, showing potential profits and losses. Bar chart decrease illustrations Stock Market Data Shows Economic Growth and Potential Loss in the Future. Stylized data illustrates financial increase using dollar signs, bar graphs, and arrows. Some data trends down while other data trends up, showing potential profits and losses.
Free with trial Economic critical crisis concept. The bar garph on red background. Recession financial, cryptocurrency, gold, and the stock market. Losing money and cash. Bearish. Bar chart decrease vectors Economic critical crisis concept. The bar garph on red background. Recession financial, cryptocurrency, gold, and the stock market
Free with trial A collage of nine distinct charts and graphs, primarily displaying financial data, growth trends, and economic indicators. The visuals feature line graphs, area charts, and bar charts with various colored lines and shaded areas representing different metrics over time. Accompanying text and labels suggest analysis of business performance, economic growth, and financial markets. This collection is ideal for presentations, reports, and articles related to finance, economics, and business analytics. Bar chart decrease illustrations Collection of Financial and Business Growth Charts. A collage of nine distinct charts and graphs, primarily displaying financial data, growth trends, and economic indicators. The visuals feature line graphs, area charts, and bar charts with various colored lines and shaded areas representing different metrics over time. Accompanying text and labels suggest analysis of business performance, economic growth, and financial markets. This collection is ideal for presentations, reports, and articles related to finance, economics, and business analytics.
Free with trial This image showcases colorful 3D charts and graphs, representing financial data, generated by AI. It includes bar graphs, pie charts, and other visual representations of financial performance, displayed on a tablet and printed reports. The image suggests growth and positive financial trends. Bar chart decrease illustrations AI-Generated Financial Charts. This image showcases colorful 3D charts and graphs, representing financial data, generated by AI. It includes bar graphs, pie charts, and other visual representations of financial performance, displayed on a tablet and printed reports. The image suggests growth and positive financial trends.
Free with trial Set of six black business charts icons showing growth and decline trends with arrows and bars in vector style clear and simple design calm. Generative AI. Bar chart decrease vectors Business growth and decline charts arrows statistics bar graph icons vector illustration. Set of six black business charts icons showing growth and decline trends with arrows and bars in vector style clear and simple design calm. Generative AI
Free with trial Economic critical crisis concept. The bar garph with drop down arrow on red background. Recession financial, cryptocurrency, gold, and the stock market. Losing money and cash. Bearish. Bar chart decrease vectors Economic critical crisis concept. The bar garph with drop down arrow on red background. Recession financial, cryptocurrency, gold
Free with trial Up and down sign with green and black arrows in flat style showing movement direction and sales change. Vector illustration of a sales bar chart icon used as an elevator symbol or universal pictogram. Bar chart decrease vectors Up and down sign with green and black arrows in flat style showing movement direction
Free with trial Bar chart illustration showing a descending trend. Four vertical bars in gradient hues of orange and blue decrease in height from left to right. A line graph with circles marks the top of each bar, emphasizing the downward trend. The design is simple and uses soft pastel colors, against a white background, highlighting the decreasing business data concept. Bar chart decrease vectors Decreasing Trend Graph: Business Data Chart Illustration. Bar chart illustration showing a descending trend. Four vertical bars in gradient hues of orange and blue decrease in height from left to right. A line graph with circles marks the top of each bar, emphasizing the downward trend. The design is simple and uses soft pastel colors, against a white background, highlighting the decreasing business data concept.
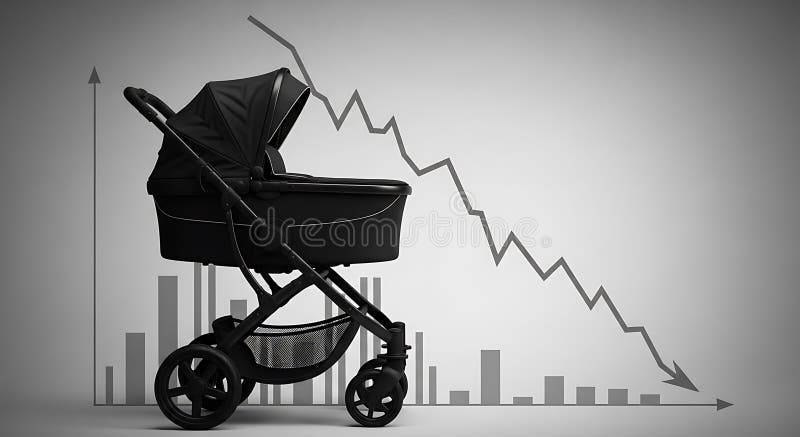
Free with trial A stark visual representation of demographic decline featuring a baby carriage silhouetted against a backdrop of a downward-trending graph and bar charts, symbolizing falling birth rates and. Bar chart decrease illustrations Demographic Decline Baby Carriage with Downturn Graph and Population Decrease Concept. A stark visual representation of demographic decline featuring a baby carriage silhouetted against a backdrop of a downward-trending graph and bar charts, symbolizing falling birth rates and
Free with trial A collage of various hand-drawn charts and graphs in shades of blue, illustrating business growth, data analysis, and financial trends. The collection includes bar charts, line graphs, and pie charts, all rendered with a sketchy, artistic style. These visuals are perfect for presentations, reports, or any project requiring a dynamic and informative representation of data and progress. Bar chart decrease illustrations Hand-Drawn Business Growth Charts and Graphs Collection. A collage of various hand-drawn charts and graphs in shades of blue, illustrating business growth, data analysis, and financial trends. The collection includes bar charts, line graphs, and pie charts, all rendered with a sketchy, artistic style. These visuals are perfect for presentations, reports, or any project requiring a dynamic and informative representation of data and progress.
Free with trial Abstract illustration of business growth, featuring bar graphs and line graphs in shades of blue and grey. The image conveys concepts of data analysis, progress, and financial performance. Suitable for presentations, reports, and marketing materials related to business, finance, and technology. Bar chart decrease illustrations Abstract Business Growth Chart. Abstract illustration of business growth, featuring bar graphs and line graphs in shades of blue and grey. The image conveys concepts of data analysis, progress, and financial performance. Suitable for presentations, reports, and marketing materials related to business, finance, and technology.
Free with trial A simple and clear black-and-white illustration of decreasing stacks of dollar coins, symbolizing loss, reduced income, or financial decline. Perfect for presentations, infographics, and finance apps. Bar chart decrease vectors Declining Revenue Icon Stacked Coin Chart. A simple and clear black-and-white illustration of decreasing stacks of dollar coins, symbolizing loss, reduced income, or financial decline. Perfect for presentations, infographics, and finance apps
Free with trial A side-by-side infographic compares rising productivity before burnout and its decline after, using orange bar graphs �. Bar chart decrease illustrations . A side-by-side infographic compares rising productivity before burnout and its decline after, using orange bar graphs �
Free with trial A man in a dark suit touches a glowing blue digital interface overlaid on a downward trending bar graph. Bar chart decrease illustrations Businessman touching glowing digital interface with downward trend graph technology. A man in a dark suit touches a glowing blue digital interface overlaid on a downward trending bar graph
Free with trial A 3D bar graph made of blue blocks with three red arrows pointing in different directions. The graph shows a mix of increasing and decreasing trends. The blocks are arranged in ascending order of height on the right side, while the left side has a more random arrangement. The red arrows are superimposed over the graph, with one pointing upwards, one to the left and one downwards. The background is. Bar chart decrease illustrations A blue block graph with red arrows. A 3D bar graph made of blue blocks with three red arrows pointing in different directions. The graph shows a mix of increasing and decreasing trends. The blocks are arranged in ascending order of height on the right side, while the left side has a more random arrangement. The red arrows are superimposed over the graph, with one pointing upwards, one to the left and one downwards. The background is
Free with trial Downward trending bar graph with a black arrow, representing losses. Bar chart decrease vectors Downward trending bar graph with a black arrow, representing losses
Free with trial Declining Bar Graph with Arrow Showing Increase and Downward Trend. Bar chart decrease vectors Declining Bar Graph with Arrow Showing Increase and Downward Trend
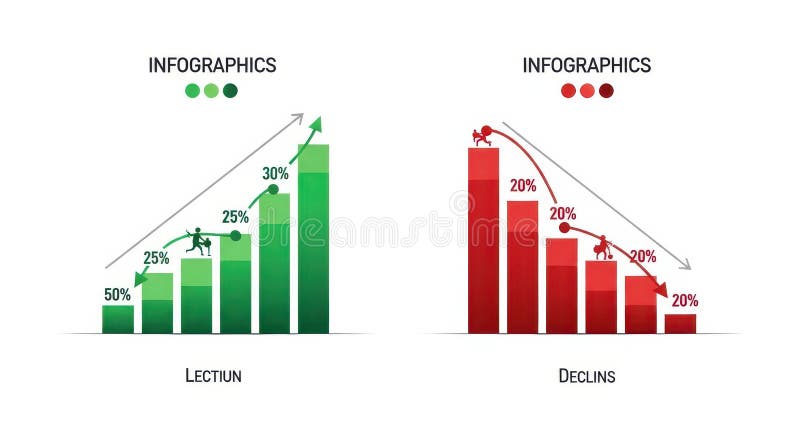
Free with trial The image displays two infographics side by side. the left infographic, titled "lection," depicts a green bar graph showing growth, starting at 50% and increasing to 30% with a figure climbing the bars. an upward-pointing arrow indicates positive growth. the right infographic, titled "declins," shows a red bar graph illustrating decline, starting at 20% and decreasing to 20% with a figure falling down the bars. a downward-pointing arrow indicates negative growth. Bar chart decrease illustrations Infographics showing growth and decline charts. the image displays two infographics side by side. the left infographic, titled "lection," depicts a green bar graph showing growth, starting at 50% and increasing to 30% with a figure climbing the bars. an upward-pointing arrow indicates positive growth. the right infographic, titled "declins," shows a red bar graph illustrating decline, starting at 20% and decreasing to 20% with a figure falling down the bars. a downward-pointing arrow indicates negative growth.
Free with trial This infographic shows business data with both an increasing chart with 20% growth and a decreasing chart with 10% decline, which can be used to illustrate business concepts. Bar chart decrease illustrations Infographic Showing Business Growth and Decline. This infographic shows business data with both an increasing chart with 20% growth and a decreasing chart with 10% decline, which can be used to illustrate business concepts
Free with trial This image showcases a bar graph depicting rising factory production, generated by AI, superimposed on a blurred background of a bustling industrial facility. The upward trend suggests growth and efficiency in the manufacturing process, highlighting the positive impact of modern technology. Bar chart decrease illustrations Factory Production Increase. This image showcases a bar graph depicting rising factory production, generated by AI, superimposed on a blurred background of a bustling industrial facility. The upward trend suggests growth and efficiency in the manufacturing process, highlighting the positive impact of modern technology.
Free with trial A set of nine minimalist vector icons depicting various types of charts and graphs including bar charts, progress bars, and trend lines for data visualization and analytics. Bar chart decrease vectors Collection of simple black glyph icons representing business charts graphs and data analysis. A set of nine minimalist vector icons depicting various types of charts and graphs including bar charts, progress bars, and trend lines for data visualization and analytics
Free with trial Bar graph displays a colorful representation of business growth and financial success with bars increasing in height and vibrant colors on a reflective surface indicating positive trends. Bar chart decrease illustrations Colorful bar graph showing growth and success in business and finance on a reflective surface. Bar graph displays a colorful representation of business growth and financial success with bars increasing in height and vibrant colors on a reflective surface indicating positive trends.
Free with trial Falling trend sketch of business finance graph with bar charts and arrow. Bar chart decrease illustrations Falling trend sketch of business finance graph with bar charts and arrow
Free with trial This image showcases vibrant 3D bar and line charts, generated by AI, offering a dynamic visual representation of business data. The colorful design effectively communicates trends and comparisons across multiple data sets, providing a clear and engaging overview of key performance indicators. Bar chart decrease illustrations AI-Generated 3D Business Charts. This image showcases vibrant 3D bar and line charts, generated by AI, offering a dynamic visual representation of business data. The colorful design effectively communicates trends and comparisons across multiple data sets, providing a clear and engaging overview of key performance indicators.
Free with trial A 3D rendering shows a financial graph with four white bars of decreasing height. A red arrow points downwards across the bars, indicating a decline. A stack of gold coins sits in front of the shortest bar on a black rectangular base. The background is white. Bar chart decrease illustrations White bars chart red arrow gold coins business finance. A 3D rendering shows a financial graph with four white bars of decreasing height. A red arrow points downwards across the bars, indicating a decline. A stack of gold coins sits in front of the shortest bar on a black rectangular base. The background is white
Free with trial Laptop with declining graph and office supplies doodle linear objects set. Downward bar chart, mug 2D vector outline clip arts drawings isolated on white. Hand drawn sketch illustrations collection. Bar chart decrease vectors Laptop with declining graph and office supplies doodle linear objects set
Free with trial Red falling arrow and declining chart with stock market data overlay on office interior background, symbolizing global financial collapse impact. Bar chart decrease illustrations Financial market crash with red downward arrow and stock graph lines descending sharply over modern office background during. Red falling arrow and declining chart with stock market data overlay on office interior background, symbolizing global financial collapse impact
Free with trial Blue bars on a graph display a downward trend highlighted by a yellow arrow showing decline Great for illustrating economic concepts and market trends. Bar chart decrease illustrations Decreasing Bar Graph with Arrow Downward Financial Decline. Blue bars on a graph display a downward trend highlighted by a yellow arrow showing decline Great for illustrating economic concepts and market trends
Free with trial A striking 3D rendering features an abstract bar graph composed of numerous translucent blue rectangular blocks against a dark, almost black, background. The varying heights of the blocks create a dynamic visual representation of data, statistics, or growth trends. This modern and futuristic design is ideal for illustrating concepts related to business, finance, technology, analytics, market research, or digital information in presentations, reports, websites, and corporate media. Bar chart decrease illustrations Abstract 3D Blue Bar Graph Visualization. A striking 3D rendering features an abstract bar graph composed of numerous translucent blue rectangular blocks against a dark, almost black, background. The varying heights of the blocks create a dynamic visual representation of data, statistics, or growth trends. This modern and futuristic design is ideal for illustrating concepts related to business, finance, technology, analytics, market research, or digital information in presentations, reports, websites, and corporate media.
Free with trial A modern workspace features a desktop computer displaying hand-drawn charts and graphs, representing data analysis and business insights. The screen shows various types of charts including bar graphs, line graphs, and pie charts. The overall image projects a sense of productivity and strategic pla. Bar chart decrease illustrations Data Visualization on Desktop. A modern workspace features a desktop computer displaying hand-drawn charts and graphs, representing data analysis and business insights. The screen shows various types of charts including bar graphs, line graphs, and pie charts. The overall image projects a sense of productivity and strategic pla
Free with trial A magnifying glass focuses on a vibrant bar graph, symbolizing financial growth and investment opportunities. Stacks of gold coins rest on a financial report, enhancing the visual representation of wealth and prosperity. This 3D rendering, generated by AI, is ideal for illustrating financial concep. Bar chart decrease illustrations Financial Growth Analysis. A magnifying glass focuses on a vibrant bar graph, symbolizing financial growth and investment opportunities. Stacks of gold coins rest on a financial report, enhancing the visual representation of wealth and prosperity. This 3D rendering, generated by AI, is ideal for illustrating financial concep
Free with trial A dynamic 3D rendering of a bar graph, depicting a downward trend with vibrant red bars and a prominent white arrow pointing downwards. The scene is set against a dark, subtly textured background, creating a dramatic visual contrast. This image effectively symbolizes decline, loss, negative financial trends, or challenges in business. Bar chart decrease illustrations 3D Bar Graph with Declining Red Bars and White Arrow Ai Generated. A dynamic 3D rendering of a bar graph, depicting a downward trend with vibrant red bars and a prominent white arrow pointing downwards. The scene is set against a dark, subtly textured background, creating a dramatic visual contrast. This image effectively symbolizes decline, loss, negative financial trends, or challenges in business.
Free with trial This 3D rendered image shows a computer screen displaying various charts and graphs, including bar charts, pie charts, and line graphs. The data visualization is colorful and easy to understand, generated by AI for quick data interpretation. The design is simple and modern, ideal for presentations. Bar chart decrease illustrations AI-Generated Data Dashboard. This 3D rendered image shows a computer screen displaying various charts and graphs, including bar charts, pie charts, and line graphs. The data visualization is colorful and easy to understand, generated by AI for quick data interpretation. The design is simple and modern, ideal for presentations
Free with trial Percent arrows up and down icon set. Income and cost increase and decrease arrow icons. Bar chart decrease vectors Percent arrows up and down icon set
Free with trial The image depicts a bar graph with three vertical bars of decreasing height, accompanied by a red downward arrow. The tallest bar is dark blue, the middle bar is light blue, and the shortest bar is light cyan. The red arrow signifies a downward trend or decline in performance or data. Bar chart decrease illustrations Decline in performance graph. The image depicts a bar graph with three vertical bars of decreasing height, accompanied by a red downward arrow. The tallest bar is dark blue, the middle bar is light blue, and the shortest bar is light cyan. The red arrow signifies a downward trend or decline in performance or data
Free with trial A modern, clean isometric illustration showcasing various data visualizations. Multiple charts and graphs, including bar charts, line graphs, and pie charts, are displayed on floating screens, representing data analysis, business intelligence, or financial reporting. Ideal for presentations, reports, or website banners related to data-driven concepts. Bar chart decrease illustrations Isometric 3D Data Visualization: Charts and Graphs on Floating Screens. A modern, clean isometric illustration showcasing various data visualizations. Multiple charts and graphs, including bar charts, line graphs, and pie charts, are displayed on floating screens, representing data analysis, business intelligence, or financial reporting. Ideal for presentations, reports, or website banners related to data-driven concepts.
Free with trial A hand presents a glowing graph illustrating cost reduction. the downward arrow and shrinking bars emphasize decreasing expenses. a visual representation of financial efficiency and savings, ideal for business. Bar chart decrease illustrations Representation of cost reduction shown above a hand with a downward trending bar graph and arrow. a hand presents a glowing graph illustrating cost reduction. the downward arrow and shrinking bars emphasize decreasing expenses. a visual representation of financial efficiency and savings, ideal for business.
Free with trial A vibrant and playful collection of hand-drawn financial and business icons. The set includes a bar graph, gold bars, a downward arrow, calculators, a smiley face, and cartoon dollar bills. These icons are perfect for illustrating concepts related to finance, economics, investment, and business growth. The simple and cheerful design makes them ideal for educational materials, presentations, and websites. Bar chart decrease vectors Finance and Business Icons Set. A vibrant and playful collection of hand-drawn financial and business icons. The set includes a bar graph, gold bars, a downward arrow, calculators, a smiley face, and cartoon dollar bills. These icons are perfect for illustrating concepts related to finance, economics, investment, and business growth. The simple and cheerful design makes them ideal for educational materials, presentations, and websites.
Free with trial The image displays two bar graphs representing the stock market activities of buying and selling. The left graph, labeled 'BUY', shows a pyramid structure with increasing bars from bottom to top, indicating a rise in buying activities. The right graph, labeled 'SELL', shows a pyramid structure with decreasing bars from top to bottom, indicating a rise in selling activities. Bar chart decrease illustrations Stock market buy and sell graphs. The image displays two bar graphs representing the stock market activities of buying and selling. The left graph, labeled 'BUY', shows a pyramid structure with increasing bars from bottom to top, indicating a rise in buying activities. The right graph, labeled 'SELL', shows a pyramid structure with decreasing bars from top to bottom, indicating a rise in selling activities
Free with trial The image depicts a downward trending stock market graph with a prominent red arrow pointing downwards. This indicates a decline in stock prices over time. The bars in the graph show a clear decrease in value from left to right. Bar chart decrease illustrations Stock market downtrend indicated. The image depicts a downward trending stock market graph with a prominent red arrow pointing downwards. This indicates a decline in stock prices over time. The bars in the graph show a clear decrease in value from left to right
Free with trial Illustration of global stock market data. The graphic includes a world map background bar charts and a line graph. Represents finance investment and trading, trends across international. Bar chart decrease illustrations Illustration of global stock market data. The graphic includes a world map background bar charts and a line graph. Represents
Free with trial Red world map overlay on wet surface with vertical bar charts. Global finance data analysis. Economic recession risk market crash. Stock market decline information visualization. Bar chart decrease illustrations Red world map overlay on wet surface with vertical bar charts. Global finance data analysis. Economic recession risk, market. Red world map overlay on wet surface with vertical bar charts. Global finance data analysis. Economic recession risk market crash. Stock market decline information visualization.
Free with trial A comprehensive overview of financial data is presented through various charts and graphs. The scene includes line graphs, bar charts, pie charts, and donut charts, accompanied by stacks of coins. The color palette is muted, featuring shades of beige, brown, and gray, creating a professional and clean aesthetic. This image is suitable for illustrating finance, business, investment, and data analysis concepts. Bar chart decrease illustrations Financial Data and Charts Overview. A comprehensive overview of financial data is presented through various charts and graphs. The scene includes line graphs, bar charts, pie charts, and donut charts, accompanied by stacks of coins. The color palette is muted, featuring shades of beige, brown, and gray, creating a professional and clean aesthetic. This image is suitable for illustrating finance, business, investment, and data analysis concepts.
Free with trial A hand's finger pushes a bright yellow arrow downwards, directly onto a bar graph displaying a significant decrease. This image symbolizes financial decline and negative business trends. Bar chart decrease illustrations Hand pushing down yellow arrow on declining business financial graph chart showing negative growth. A hand's finger pushes a bright yellow arrow downwards, directly onto a bar graph displaying a significant decrease. This image symbolizes financial decline and negative business trends
Free with trial Declining bar chart with downward arrow. A downward sloping red arrow over a series of green bars decreasing in height, illustrating decline or reduction. Bar chart decrease illustrations Declining bar chart with downward arrow. A downward sloping red arrow over a series of green bars decreasing in height, illustrating decline or reduction
Free with trial This image depicts a bar graph with a downward trend, represented by red bars decreasing in height from left to right. A large red arrow at the end of the graph further emphasizes the downward direction, indicating a significant decline in the measured values. Bar chart decrease illustrations Decreasing trend indicated by red arrow. This image depicts a bar graph with a downward trend, represented by red bars decreasing in height from left to right. A large red arrow at the end of the graph further emphasizes the downward direction, indicating a significant decline in the measured values
Free with trial A vivid red-themed digital display highlights a sharp decline in market performance, with 3d bar visuals emphasizing decreasing trends and financial volatility. Bar chart decrease illustrations Close-up view of a red downward-trending stock market graph with 3d bar charts showing declining values, on a digital financial. A vivid red-themed digital display highlights a sharp decline in market performance, with 3d bar visuals emphasizing decreasing trends and financial volatility
Free with trial Conceptual illustration representing cryptocurrency market trends with a bar graph showing financial growth alongside shadows of investment risk and volatility. Bar chart decrease vectors Stylized illustration showing cryptocurrency growth with bar graphs and shadows representing investment risks and market trends. conceptual illustration representing cryptocurrency market trends with a bar graph showing financial growth alongside shadows of investment risk and volatility
Free with trial The image features four bar graphs displaying data trends over time, with varying scales and patterns on each graph. Bar chart decrease illustrations Four graphs showing data trends over time. The image features four bar graphs displaying data trends over time, with varying scales and patterns on each graph
Free with trial Red arrow pointing down, falling concept of loss market crash, falling red arrow indicating a decrease in value, big red arrow going down, business loss financial decline economic fall recession. Bar chart decrease vectors Red arrow pointing down, falling concept of loss market crash. Red arrow pointing down, falling concept of loss market crash, falling red arrow indicating a decrease in value, big red arrow going down, business loss financial decline economic fall recession.
Free with trial Business chart showing decline, red arrow down indicates financial loss, crisis, or failure. Bar chart decrease illustrations Business graph with red arrow pointing down showing financial decline. Business chart showing decline, red arrow down indicates financial loss, crisis, or failure
Free with trial A globe sits atop a descending bar graph, symbolizing economic downturn. The visual represents a global recession, market decline, or financial crisis. It is a concept for business and investment risks. Bar chart decrease illustrations Globe and declining bar graph isolated on white background. A globe sits atop a descending bar graph, symbolizing economic downturn. The visual represents a global recession, market decline, or financial crisis. It is a concept for business and investment risks
Free with trial A hand-drawn illustration featuring a large percentage symbol at the center, surrounded by various financial and business-related doodles. Icons include bar charts, pie charts, stacks of coins, a calculator, dollar signs, and numerous arrows indicating direction, flow, or change. The style is simple, black and white line art, suitable for representing concepts like finance, economics, growth, discounts, and business analysis. Bar chart decrease illustrations Doodle Financial Icons and Percentage Symbol. A hand-drawn illustration featuring a large percentage symbol at the center, surrounded by various financial and business-related doodles. Icons include bar charts, pie charts, stacks of coins, a calculator, dollar signs, and numerous arrows indicating direction, flow, or change. The style is simple, black and white line art, suitable for representing concepts like finance, economics, growth, discounts, and business analysis.
Free with trial A 3D rendered image of a tall cylindrical structure composed of stainless steel vertical bars arranged in descending order from tallest at the top to shortest at the bottom, creating a minimalist bar chart visualization that rests on a rectangular base of the same metallic material, evoking a modern and sleek aesthetic suitable for presentations about data analysis, financial growth, business. Bar chart decrease illustrations Modern stainless steel 3D bar graph rendering with minimalist design and sleek vertical structure. A 3D rendered image of a tall cylindrical structure composed of stainless steel vertical bars arranged in descending order from tallest at the top to shortest at the bottom, creating a minimalist bar chart visualization that rests on a rectangular base of the same metallic material, evoking a modern and sleek aesthetic suitable for presentations about data analysis, financial growth, business
Free with trial A red jagged line trending downward on a dark background with a white bar at the bottom. Bar chart decrease illustrations A red downward trend line on a dark background. a red jagged line trending downward on a dark background with a white bar at the bottom
Free with trial A stark red arrow points sharply downwards, crossing over a series of stacked white cylindrical objects resembling coins or bars. The stacked objects are arranged in a bar graph formation, with the arrow's path indicating a significant decline. The entire composition is set against a clean white background. Bar chart decrease illustrations Red Downward Arrow Graphing Over Stacked White Coins on White Background chart. A stark red arrow points sharply downwards, crossing over a series of stacked white cylindrical objects resembling coins or bars. The stacked objects are arranged in a bar graph formation, with the arrow's path indicating a significant decline. The entire composition is set against a clean white background
Free with trial Collection of eight minimalist line icons representing various types of data visualization, including bar charts, line graphs, pie charts, and progress indicators. Ideal for websites, apps, or presentations needing a clean and modern aesthetic. Bar chart decrease illustrations Data Visualization Icons. Collection of eight minimalist line icons representing various types of data visualization, including bar charts, line graphs, pie charts, and progress indicators. Ideal for websites, apps, or presentations needing a clean and modern aesthetic.
Free with trial This image showcases twelve diverse data visualization icons, including bar charts, pie charts, line graphs, and other visual representations of data. These icons are ideal for presentations, reports, or digital interfaces needing a modern and aesthetically pleasing design. The color palette is co. Bar chart decrease illustrations Data Visualization Icons
Free with trial A set of twelve colorful icons representing various data visualization methods, including bar charts, pie charts, line graphs, and other visual representations of data analysis. Perfect for presentations, reports, and websites needing clear data insights. Bar chart decrease illustrations Data Visualization Icons. A set of twelve colorful icons representing various data visualization methods, including bar charts, pie charts, line graphs, and other visual representations of data analysis. Perfect for presentations, reports, and websites needing clear data insights.
Free with trial An illustration of a bar graph on an easel with a downward trend line, indicating a decrease in values over time or categories. The graph is displayed on a white canvas, supported by a wooden easel, set against a plain white background. Bar chart decrease illustrations A graph on an easel showing a downward trend. An illustration of a bar graph on an easel with a downward trend line, indicating a decrease in values over time or categories. The graph is displayed on a white canvas, supported by a wooden easel, set against a plain white background
Free with trial Red arrow going down stock icon on white background. Bankruptcy, financial market crash icon for your web site design, logo, app, UI. graph chart down trend symbol. chart going down sign. Bar chart decrease vectors Red arrow going down stock icon on white background. Bankruptcy, financial market crash icon for your web site design
Free with trial Red arrow going down stock icon on white background. Bankruptcy, financial market crash icon for your web site design, logo, app, UI. graph chart down trend symbol. chart going down sign. Bar chart decrease vectors Red arrow going down stock icon on white background. Bankruptcy, financial market crash icon for your web site design. Red arrow going down stock icon on white background. Bankruptcy, financial market crash icon for your web site design, logo, app, UI. graph chart down trend symbol.chart going down sign.
Free with trial A 3D graphic of a bar graph with blue and yellow bars and a large blue arrow pointing downward indicating a decline or decrease in the trend shown by the graph. Bar chart decrease illustrations A blue and yellow graph with a downward trend arrow. a 3D graphic of a bar graph with blue and yellow bars and a large blue arrow pointing downward indicating a decline or decrease in the trend shown by the graph
Free with trial A collection of colorful 3D financial graphics on a white background. This includes a rising candlestick chart with red and green bars, a segmented pie chart with four colors, and a circular segmented chart with five colors. Bar chart decrease illustrations Colorful 3D Financial Charts and Graphs on White Background finance business. A collection of colorful 3D financial graphics on a white background. This includes a rising candlestick chart with red and green bars, a segmented pie chart with four colors, and a circular segmented chart with five colors
Free with trial This image showcases a variety of modern, flat-design charts and graphs commonly used in business, finance, and data analysis. It includes bar charts, pie charts, and line graphs, presented in a clean, minimalist style with teal and gray color accents. These visual representations are ideal for illustrating trends, statistics, performance, and financial data in presentations, reports, and web content. Bar chart decrease illustrations Collection of Business and Financial Charts and Graphs. This image showcases a variety of modern, flat-design charts and graphs commonly used in business, finance, and data analysis. It includes bar charts, pie charts, and line graphs, presented in a clean, minimalist style with teal and gray color accents. These visual representations are ideal for illustrating trends, statistics, performance, and financial data in presentations, reports, and web content.