Free with trial This AI-generated image depicts a calculator displaying "TAX-2025" alongside a bar graph, illustrating potential tax revenue projections for the year. The graph, generated by AI, shows a projected decrease in tax revenue over time. This visualization is helpful for financial planning and forecastin. Bar chart decrease illustrations Tax Projections 2025. This AI-generated image depicts a calculator displaying "TAX-2025" alongside a bar graph, illustrating potential tax revenue projections for the year. The graph, generated by AI, shows a projected decrease in tax revenue over time. This visualization is helpful for financial planning and forecastin
Free with trial A three-dimensional bar graph on a dark blue background displays a vertical arrangement of multicolored bars�'orange, yellow, and red�'with the tallest bar at the bottom and the shortest at the top, illustrating a declining trend in cancer diagnosis rates under a striking bright blue overhead light that casts a dramatic and ominous mood, suitable for representing statistical data, medical. Bar chart decrease illustrations A 3D bar graph on a dark blue background shows decreasing cancer diagnosis rates with orange yellow and red vertical bars under. A three-dimensional bar graph on a dark blue background displays a vertical arrangement of multicolored bars�'orange, yellow, and red�'with the tallest bar at the bottom and the shortest at the top, illustrating a declining trend in cancer diagnosis rates under a striking bright blue overhead light that casts a dramatic and ominous mood, suitable for representing statistical data, medical
Free with trial A vibrant collection of flat design charts, including a bar graph and two pie charts, presented together to visualize data and trends effectively on a clean white background. Bar chart decrease vectors Illustration of colorful bar and pie charts isolated on white background. A vibrant collection of flat design charts, including a bar graph and two pie charts, presented together to visualize data and trends effectively on a clean white background
Free with trial Chat arrow down icon Vector set on white background. EPS 10. Bar chart decrease vectors Chart arrow down icon set. decline downward chart vector symbol. stock trend downturn graph sign. negative economy bar Chart. Chat arrow down icon Vector set on white background. EPS 10
Free with trial Chat arrow down icon Vector set on white background. EPS 10. Bar chart decrease vectors Chart arrow down icon set. decline downward chart vector symbol. stock trend downturn graph sign. negative economy bar Chart. Chat arrow down icon Vector set on white background. EPS 10
Free with trial Chat arrow down icon Vector set on white background. EPS 10. Bar chart decrease vectors Chart arrow down icon set. decline downward chart vector symbol. stock trend downturn graph sign. negative economy bar Chart. Chat arrow down icon Vector set on white background. EPS 10
Free with trial Chat arrow down icon Vector set on white background. EPS 10. Bar chart decrease vectors Chart arrow down icon set. decline downward chart vector symbol. stock trend downturn graph sign. negative economy bar Chart. Chat arrow down icon Vector set on white background. EPS 10
Free with trial Charts and diagrams icon collection. Duotone color. Vector illustration. Containing graphic, infographic, graph, pie chart, graphs, bar chart, circular diagram, diagram, decrease, increase, with three design. Bar chart decrease vectors Economics strategy, analysis of sales, statistic, data statistic illustration set or collection for banner, landing web page. Charts and diagrams icon collection. Duotone color. Vector illustration. Containing graphic, infographic, graph, pie chart, graphs, bar chart, circular diagram, diagram, decrease, increase, with three design
Free with trial Charts and diagrams icon collection. Duotone color. Vector illustration. Containing graphic, infographic, graph, pie chart, graphs, bar chart, circular diagram, diagram, decrease, increase, with three design. Bar chart decrease vectors Economics strategy, analysis of sales, statistic, data statistic illustration set or collection for banner, landing web page. Charts and diagrams icon collection. Duotone color. Vector illustration. Containing graphic, infographic, graph, pie chart, graphs, bar chart, circular diagram, diagram, decrease, increase, with three design
Free with trial Charts and diagrams icon collection. Duotone color. Vector illustration. Containing graphic, infographic, graph, pie chart, graphs, bar chart, circular diagram, diagram, decrease, increase, with three design. Bar chart decrease vectors Economics strategy, analysis of sales, statistic, data statistic illustration set or collection for banner, landing web page. Charts and diagrams icon collection. Duotone color. Vector illustration. Containing graphic, infographic, graph, pie chart, graphs, bar chart, circular diagram, diagram, decrease, increase, with three design
Free with trial Charts and diagrams icon collection. Duotone color. Vector illustration. Containing graphic, infographic, graph, pie chart, graphs, bar chart, circular diagram, diagram, decrease, increase, with three design. Bar chart decrease vectors Economics strategy, analysis of sales, statistic, data statistic illustration set or collection for banner, landing web page. Charts and diagrams icon collection. Duotone color. Vector illustration. Containing graphic, infographic, graph, pie chart, graphs, bar chart, circular diagram, diagram, decrease, increase, with three design
Free with trial Data charts shown on mobile devices displayed with a bar graph represent growth and financial analysis on a tech interface Perfect for illustrating investment or business trends. Bar chart decrease illustrations Analyzing Stock Market Data with Mobile Tech and Bar Graph. Data charts shown on mobile devices displayed with a bar graph represent growth and financial analysis on a tech interface Perfect for illustrating investment or business trends
Free with trial Falling Sales Chart with Arrow and Flag, Financial Decline Concept, Losses. Bar chart decrease vectors Falling Sales Chart with Arrow and Flag, Financial Decline Concept, Losses
Free with trial Graph and diagram from boats with decrease. Finance and business concept. 3D Illustration. 3D rendering on blue background. Bar chart decrease illustrations Graph and diagram from boats with decrease. Finance and business concept. 3D Illustration.3D rendering
Free with trial Graph and diagram from planes with decrease. Finance and business concept. 3D Illustration. 3D rendering on blue background. Bar chart decrease illustrations Graph and diagram from planes with decrease. Finance and business concept. 3D Illustration.3D rendering
Free with trial Graph and diagram from planes with decrease. Finance and business concepts. 3D Illustration isolated. 3D rendering on blue background. Bar chart decrease illustrations Graph and diagram from planes with decrease. Finance and business concepts. 3D Illustration isolated.
Free with trial Botswana oil industry concept, industrial illustration - lowering down chart on Botswana flag background. 3D Illustration. Bar chart decrease illustrations Lowering down chart on Botswana flag background - industrial illustration of Botswana oil industry or market concept. 3D. Botswana oil industry concept, industrial illustration - lowering down chart on Botswana flag background. 3D Illustration
Free with trial Barbados oil industry concept, industrial illustration - lowering down chart on Barbados flag background. 3D Illustration. Bar chart decrease illustrations Lowering down chart on Barbados flag background - industrial illustration of Barbados oil industry or market concept. 3D. Barbados oil industry concept, industrial illustration - lowering down chart on Barbados flag background. 3D Illustration
Free with trial Gold bullion placed on a financial stock market chart background, representing investment, wealth, and market trends in the global economy. Bar chart decrease illustrations Gold bullion with financial chart, investment concept. Gold bullion placed on a financial stock market chart background, representing investment, wealth, and market trends in the global economy.
Free with trial 3d modelled gold bars with arrows pointing upward. Bar chart decrease illustrations Gold bars with rising financial chart on black background. 3d modelled gold bars with arrows pointing upward.
Free with trial 3d modelled gold bars with green arrow pointing upward. Bar chart decrease illustrations Gold bars with rising financial chart on black background. 3d modelled gold bars with green arrow pointing upward.
Free with trial Business graph showing falling trend with arrow for recession and financial loss. Bar chart decrease vectors Business crisis chart with falling arrow. Business graph showing falling trend with arrow for recession and financial loss
Free with trial Decreasing bar graph with falling arrow as a metaphor for stock market crash business loss and economic crisis concept. Bar chart decrease illustrations Decreasing red graph symbolizing business loss and economic crisis. Decreasing bar graph with falling arrow as a metaphor for stock market crash business loss and economic crisis concept
Free with trial A 3D human character pushes against a collapsing red bar chart with a downward arrow, a business conception of preventing financial loss and crisis. Bar chart decrease illustrations 3D Human Character Trying to Stop a Falling Red Business Graph. A 3D human character pushes against a collapsing red bar chart with a downward arrow, a business conception of preventing financial loss and crisis
Free with trial Financial chart with bull and bear in stock market on red and green color background. Bar chart decrease illustrations Financial chart with bull and bear in stock market on red and green color background
Free with trial A sad 3D person stands before a downward-trending red arrow and bar chart, a business conception of financial crisis, failure, and economic recession. Bar chart decrease illustrations Sad 3D Human Character with a Falling Business Graph in the Background. A sad 3D person stands before a downward-trending red arrow and bar chart, a business conception of financial crisis, failure, and economic recession
Free with trial Illustration of a declining financial trend with a bar graph and downward arrow indicating bankruptcy. Bar chart decrease vectors Financial decline concept with downward bar graph and arrow. Illustration of a declining financial trend with a bar graph and downward arrow indicating bankruptcy.
Free with trial The image displays an abstract logo combining a stylized green leaf with four horizontal bars that decrease in length and shade from dark to light green. This design effectively symbolizes concepts of sustainability progress and ecological data visualization. Rendered by Ai, the clean vector graphic is ideal for environmental consulting growth tracking or organic brand identity. It conveys both. Bar chart decrease illustrations Abstract green leaf data progress bar symbol. The image displays an abstract logo combining a stylized green leaf with four horizontal bars that decrease in length and shade from dark to light green. This design effectively symbolizes concepts of sustainability progress and ecological data visualization. Rendered by Ai, the clean vector graphic is ideal for environmental consulting growth tracking or organic brand identity. It conveys both
Free with trial A striking 3D visualization features a formation of polished black cubes descending like a minimalist bar chart indicating decline. Rendered by Ai this abstract geometric composition stands dramatically against a deep matte black background. The stark contrast and high gloss finish emphasize concepts of data analysis business loss or mathematical patterns. Bar chart decrease illustrations Abstract dark graph of descending glossy cubes. A striking 3D visualization features a formation of polished black cubes descending like a minimalist bar chart indicating decline. Rendered by Ai this abstract geometric composition stands dramatically against a deep matte black background. The stark contrast and high gloss finish emphasize concepts of data analysis business loss or mathematical patterns
Free with trial Vibrant vector illustration featuring business data charts and graphs, including bar graphs, line graphs, pie charts, and a roller coaster metaphor for market trends. This eye-catching design is perfect for presentations, infographics, and financial reports. Bar chart decrease illustrations Business Data Charts Graphs Vector Illustration, Statistics. Vibrant vector illustration featuring business data charts and graphs, including bar graphs, line graphs, pie charts, and a roller coaster metaphor for market trends. This eye-catching design is perfect for presentations, infographics, and financial reports.
Free with trial A vibrant graphic of a bar graph illustrating a downward trend, accented by a gear with a dollar sign, implying financial issues or market decline. Bar chart decrease vectors Dollar rate decrease icon. Currency decrease icon. Dollar sign symbol, USD currency. A vibrant graphic of a bar graph illustrating a downward trend, accented by a gear with a dollar sign, implying financial issues or market decline.
Free with trial A professional collection of 16 business and financial icons featuring various bar charts and line graphs. Perfect for UI dashboards, corporate presentations, and data-heavy infographics showing market growth or decline. Bar chart decrease vectors Business Growth Bar Charts and Financial Trend Line Graph Vector Icons Set. A professional collection of 16 business and financial icons featuring various bar charts and line graphs. Perfect for UI dashboards, corporate presentations, and data-heavy infographics showing market growth or decline.
Free with trial A professional collection of 16 business and financial icons featuring various bar charts and line graphs. Perfect for UI dashboards, corporate presentations, and data-heavy infographics showing market growth or decline. Bar chart decrease vectors Business Growth Bar Charts and Financial Trend Line Graph Vector Icons Set. A professional collection of 16 business and financial icons featuring various bar charts and line graphs. Perfect for UI dashboards, corporate presentations, and data-heavy infographics showing market growth or decline.
Free with trial An illustration showing a declining blue bar graph with a sad person icon next to a downward arrow in flat style. Bar chart decrease vectors Declining bar graph with a sad person illustration. An illustration showing a declining blue bar graph with a sad person icon next to a downward arrow in flat style.
Free with trial Declining Bar Graph with Downward Arrow, Business Loss and Negative Growth Concept on White Background. Bar chart decrease vectors Declining Bar Graph with Downward Arrow, Business Loss
Free with trial A flat illustration of business graphs and charts showing analysis results. Featuring clean design and vibrant color scheme. Bar chart decrease vectors Colorful business graph and chart flat style design. A flat illustration of business graphs and charts showing analysis results. Featuring clean design and vibrant color scheme.
Free with trial A line art icon depicting business performance analysis. Bar chart decrease illustrations Gear, Chart, Envelope Business Performance Analysis Icon. A line art icon depicting business performance analysis.
Free with trial Simple black icons representing financial growth and decline, perfect for business analytics and reporting. This scalable vector graphic is versatile for web and print. Bar chart decrease vectors Bar charts with arrows indicating growth or decline. Simple black icons representing financial growth and decline, perfect for business analytics and reporting. This scalable vector graphic is versatile for web and print
Free with trial Report document line icon. Neumorphic, Flat shadow, 3d buttons. Column graph sign. Growth diagram, pie chart symbol. Line report document icon. Social media icons. Vector. Bar chart decrease vectors Report document line icon. Column graph sign. Neumorphic buttons. Vector. Report document line icon. Neumorphic, Flat shadow, 3d buttons. Column graph sign. Growth diagram, pie chart symbol. Line report document icon. Social media icons. Vector
Free with trial A set of three depicting financial decline with dollar signs and arrows. The are in black and blue colors. They feature a bar graph with a downward arrow and a dollar sign coin. The represent business, finance, and economic concepts. Bar chart decrease vectors Financial decline with dollar signs and arrows graph chart. A set of three depicting financial decline with dollar signs and arrows. The are in black and blue colors. They feature a bar graph with a downward arrow and a dollar sign coin. The represent business, finance, and economic concepts
Free with trial A comprehensive set of vector line icons depicting bull and bear market trends. This collection features various combinations of bull and bear silhouettes integrated with financial charts, including rising and falling line graphs and bar graphs. Each icon clearly symbolizes either a bullish market (growth, upward trend) or a bearish market (decline, downward trend). Ideal for financial websites, trading applications, investment presentations, economic reports, infographics, and educational materials illustrating stock market dynamics and investment strategies. Bar chart decrease vectors Bull and Bear Market Stock Trading Line Icons Set. A comprehensive set of vector line icons depicting bull and bear market trends. This collection features various combinations of bull and bear silhouettes integrated with financial charts, including rising and falling line graphs and bar graphs. Each icon clearly symbolizes either a bullish market (growth, upward trend) or a bearish market (decline, downward trend). Ideal for financial websites, trading applications, investment presentations, economic reports, infographics, and educational materials illustrating stock market dynamics and investment strategies.
Free with trial A flat style graph depicting a downward trend with declining bars and arrow. Strong use of contrasting colors. Bar chart decrease vectors Declining bar graph showing negative trend with falling arrow. A flat style graph depicting a downward trend with declining bars and arrow. Strong use of contrasting colors.
Free with trial A logo for a data visualization service, a simple chart bar forming a sharp, singular peak, vector graphic design on a white background, simple minimalistic style, flat color, sunflower yellow color palette, vector graphics, vector illustration, logo, professional logo, logo design, high-quality graphic designer work, logo icon --chaos 30 --ar 16:9 --v 7 Job ID: a54fbe77-4416-47fc-b767-. Bar chart decrease illustrations Yellow Waveform Graph on White Background, Representing Data, Analytics, or Sound. a logo for a data visualization service, a simple chart bar forming a sharp, singular peak, vector graphic design on a white background, simple minimalistic style, flat color, sunflower yellow color palette, vector graphics, vector illustration, logo, professional logo, logo design, high-quality graphic designer work, logo icon --chaos 30 --ar 16:9 --v 7 Job ID: a54fbe77-4416-47fc-b767-
Free with trial The image depicts a bar graph with a downward trend. The graph shows a series of bars representing value over time. The value starts high and gradually decreases, indicating a decline over the period measured. The x-axis is labeled 'Time' and the y-axis is labeled 'Value'. The bars are red, and a red arrow at the end of the line graph emphasizes the downward trend. Bar chart decrease illustrations Decreasing value over time. The image depicts a bar graph with a downward trend. The graph shows a series of bars representing value over time. The value starts high and gradually decreases, indicating a decline over the period measured. The x-axis is labeled 'Time' and the y-axis is labeled 'Value'. The bars are red, and a red arrow at the end of the line graph emphasizes the downward trend
Free with trial The graph displays two lines, one green and one red. The green line is ascending, indicating growth or progress, while the red line is descending, suggesting a decline or decrease. Bar chart decrease illustrations A graph with a green line and a red line. The graph displays two lines, one green and one red. The green line is ascending, indicating growth or progress, while the red line is descending, suggesting a decline or decrease
Free with trial A bar graph with a downward trend highlighted in neon colors, illustrating a decrease in values over time. Bar chart decrease illustrations Graph showing a downward trend over time. A bar graph with a downward trend highlighted in neon colors, illustrating a decrease in values over time
Free with trial Four colorful bar charts are displayed on a graph, representing trends, statistics, and timeline data, with a potential focus on business infographics elements. Bar chart decrease vectors Four colorful bar charts are displayed on a graph, representing trends, statistics, and timeline data, with a potential
Free with trial Colorful bar charts are presenting statistical trends and business performance data across different time periods. Possibly days of the week. Using a vibrant color scheme of blue. Purple. And orange. Bar chart decrease vectors Colorful bar charts are presenting statistical trends and business performance data across different time periods
Free with trial The image showcases a smartphone displaying financial data visualizations, including line graphs and bar charts. Additional icons and graphics related to data analysis and finance surround the phone, emphasizing the digital and analytical nature of the content. This composition was generated by AI,. Bar chart decrease illustrations Mobile Financial Data. The image showcases a smartphone displaying financial data visualizations, including line graphs and bar charts. Additional icons and graphics related to data analysis and finance surround the phone, emphasizing the digital and analytical nature of the content. This composition was generated by AI,
Free with trial Business strategy, performance analysis, goal setting, success tracking, financial growth, decision-making. Visual includes bar chart, target with an arrow and directional arrows. Business strategy. Bar chart decrease vectors Business Growth, Performance Metrics, and Success Concept with Charts, Arrows, and Target Symbol. Business strategy, performance analysis, goal setting, success tracking, financial growth, decision-making. Visual includes bar chart, target with an arrow and directional arrows. Business strategy
Free with trial Red arrow going down stock icon on white background. Bankruptcy, financial market crash icon for your web site design, logo, app, UI. graph chart down trend symbol. chart going down sign. Bar chart decrease vectors Red arrow going down stock icon on white background. Bankruptcy, financial market crash icon for your web site. Red arrow going down stock icon on white background. Bankruptcy, financial market crash icon for your web site design, logo, app, UI. graph chart down trend symbol.chart going down sign.
Free with trial Economic recession, business owner seated on a falling down bar graph and a red arrow. Bar chart decrease vectors Economic recession, business owner seated on a falling down bar graph and a red arrow.
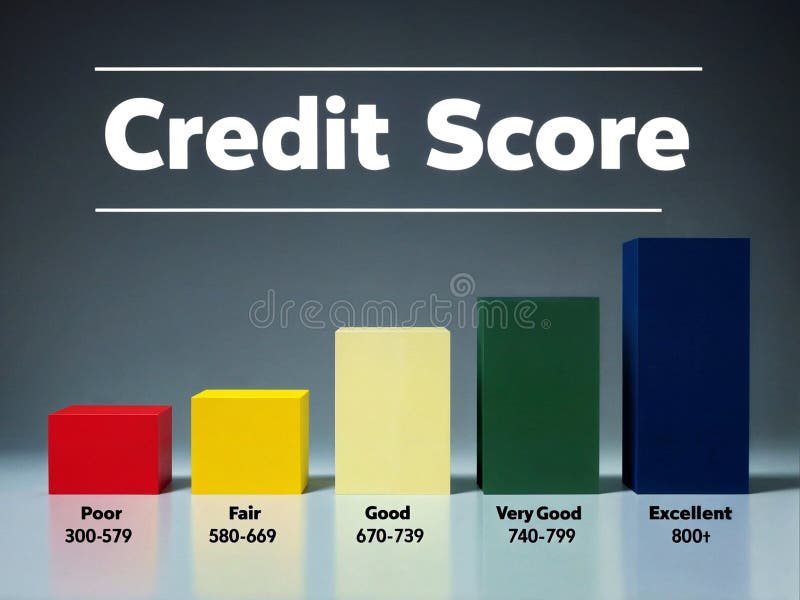
Free with trial 3d render illustration of increasing progress bar of indicating poor, fair, good, very good and excellent level of creditworthiness. Bar chart decrease illustrations 3d illustration render progress bars indicating credit score level. 3d render illustration of increasing progress bar of indicating poor, fair, good, very good and excellent level of creditworthiness
Free with trial A collection of financial icons representing various aspects of money management, investment, and financial planning. The set includes illustrations of coin stacks with arrows, bar graphs with magnifying glass, a financial planning chart, a bitcoin symbol, cash and coins, a hand putting a coin into a piggy bank, a debt payment chart, and a growth chart with coins. Suitable for illustrating articles, presentations, and websites related to finance, investment, and economics. Bar chart decrease vectors Financial Planning and Investment Icons Set. A collection of financial icons representing various aspects of money management, investment, and financial planning. The set includes illustrations of coin stacks with arrows, bar graphs with magnifying glass, a financial planning chart, a bitcoin symbol, cash and coins, a hand putting a coin into a piggy bank, a debt payment chart, and a growth chart with coins. Suitable for illustrating articles, presentations, and websites related to finance, investment, and economics.
Free with trial A comprehensive collection of 12 modern, abstract vector icons designed for business, finance, and data analytics themes. This vibrant set features geometric shapes, upward-trending bar charts, risk indicators, decision-making prompts like "YES" and "NO," and numerical data representations. Perfect for enhancing presentations, reports, websites, mobile applications, and infographics, these versatile symbols convey concepts of growth, strategy, risk management, market analysis, and progress with a clean, contemporary aesthetic. Bar chart decrease vectors Business and Data Analytics Abstract Icon Set. A comprehensive collection of 12 modern, abstract vector icons designed for business, finance, and data analytics themes. This vibrant set features geometric shapes, upward-trending bar charts, risk indicators, decision-making prompts like "YES" and "NO," and numerical data representations. Perfect for enhancing presentations, reports, websites, mobile applications, and infographics, these versatile symbols convey concepts of growth, strategy, risk management, market analysis, and progress with a clean, contemporary aesthetic.
Free with trial A 3D bar graph shows a downward trend in sales, accompanied by a sale ribbon and a gold coin. Bar chart decrease illustrations Declining sales graph with sale ribbon and coin. A 3D bar graph shows a downward trend in sales, accompanied by a sale ribbon and a gold coin
Free with trial A stark red arrow plunges downwards across a blue bar graph, visually representing a significant economic downturn or loss. Bar chart decrease illustrations Red arrow graph showing sharp financial decline. A stark red arrow plunges downwards across a blue bar graph, visually representing a significant economic downturn or loss
Free with trial The image displays two bar graphs representing the stock market activities of buying and selling. The left graph, labeled 'BUY', shows a pyramid structure with increasing bars from bottom to top, indicating a rise in buying activities. The right graph, labeled 'SELL', shows a pyramid structure with decreasing bars from top to bottom, indicating a rise in selling activities. Bar chart decrease illustrations Stock market buy and sell graphs. The image displays two bar graphs representing the stock market activities of buying and selling. The left graph, labeled 'BUY', shows a pyramid structure with increasing bars from bottom to top, indicating a rise in buying activities. The right graph, labeled 'SELL', shows a pyramid structure with decreasing bars from top to bottom, indicating a rise in selling activities
Free with trial A 3D rendering of a bar graph with teal bars of decreasing height, indicating a downward trend. A bold red arrow overlays the graph, sharply descending and pointing towards the lowest bar, visually representing a significant loss or decline. The background is slightly blurred, suggesting a professional or office environment. Bar chart decrease illustrations Business graph showing a sharp decline with a red arrow pointing downwards. A 3D rendering of a bar graph with teal bars of decreasing height, indicating a downward trend. A bold red arrow overlays the graph, sharply descending and pointing towards the lowest bar, visually representing a significant loss or decline. The background is slightly blurred, suggesting a professional or office environment
Free with trial This vector graphic depicts a magnifying glass focused on a female figure and a declining bar graph, symbolizing the. Bar chart decrease illustrations Women\'s Job Loss Magnifying Glass on Female Employment Decline. This vector graphic depicts a magnifying glass focused on a female figure and a declining bar graph, symbolizing the.
Free with trial A bar graph illustrating growth trends with notable peaks and valleys, highlighting significant increases and decreases over time. Bar chart decrease illustrations Graph showing steady growth with peaks and valleys. A bar graph illustrating growth trends with notable peaks and valleys, highlighting significant increases and decreases over time
Free with trial Red 3d arrow going down stock icon on white background. Bankruptcy, financial market crash icon for your web site design, logo, app, UI. graph chart downtrend symbol. chart going down sign. Bar chart decrease vectors Red 3d arrow going down stock icon on white background. Bankruptcy, financial market crash icon for your web site design
Free with trial Red 3d arrow going down stock icon on white background. Bankruptcy, financial market crash icon for your web site design, logo, app, UI. graph chart downtrend symbol. chart going down sign. Bar chart decrease vectors Red 3d arrow going down stock icon on white background. Bankruptcy, financial market crash icon for your web site design, logo. Red 3d arrow going down stock icon on white background. Bankruptcy, financial market crash icon for your web site design, logo, app, UI. graph chart downtrend symbol.chart going down sign.
Free with trial A circular golden coin with a black glossy face. On the black surface, a golden bar graph shows a downward trend, with the bars decreasing in height from left to right. A golden arrow points downwards, emphasizing the decline. The coin is isolated on a white background. Bar chart decrease illustrations Golden Coin with Black Background Featuring a Falling Bar Graph and Downward Arrow falling graph. A circular golden coin with a black glossy face. On the black surface, a golden bar graph shows a downward trend, with the bars decreasing in height from left to right. A golden arrow points downwards, emphasizing the decline. The coin is isolated on a white background
Free with trial A clean line drawing showcases a magnifying glass focusing on a hand holding a declining bar graph with a downward. Bar chart decrease illustrations Declining Market Analysis Magnifying Glass on Loss Trend. A clean line drawing showcases a magnifying glass focusing on a hand holding a declining bar graph with a downward.
Free with trial Red 3d arrow going down stock icon on white background. Bankruptcy, financial market crash icon for your web site design, logo, app, UI. graph chart downtrend symbol. chart going down sign. Bar chart decrease vectors Red 3d arrow going down stock icon on white background. Bankruptcy, financial market crash icon for your web site design
Free with trial Red 3d arrow going down stock icon on white background. Bankruptcy, financial market crash icon for your web site design, logo, app, UI. graph chart downtrend symbol. chart going down sign. Bar chart decrease vectors Red 3d arrow going down stock icon on white background. Bankruptcy, financial market crash icon for your web site design
Free with trial A collection of eight thin-line related to finance and business. The depict a stack of coins with a dollar sign, a document with a dollar sign, an upward trending graph over city buildings, and a bar chart with a plus sign. The bottom row coins and currency symbols, a calculator with a dollar sign, a document with a calculator and charts, and a person. Bar chart decrease illustrations Financial set with charts and calculator finance business. A collection of eight thin-line related to finance and business. The depict a stack of coins with a dollar sign, a document with a dollar sign, an upward trending graph over city buildings, and a bar chart with a plus sign. The bottom row coins and currency symbols, a calculator with a dollar sign, a document with a calculator and charts, and a person
Free with trial Data analytics dashboard illustrating a mix of line graphs, bar charts, and data summaries, representing business growth, financial trends, and statistical insights for market analysis. Bar chart decrease vectors Data analytics dashboard showing business growth and decline. Data analytics dashboard illustrating a mix of line graphs, bar charts, and data summaries, representing business growth, financial trends, and statistical insights for market analysis
Free with trial This comprehensive vector illustration features a set of 18 flat icons depicting various financial trends, market indicators, and warning signals. The collection includes rising and falling line graphs, bar charts, currency symbols (dollar and euro) indicating fluctuations, and alert symbols like sirens and exclamation marks. Ideal for illustrating concepts of economic growth, decline, market volatility, financial crisis, investment risks, and business performance. Perfect for presentations, reports, websites, and applications related to finance, economics, and stock markets. Bar chart decrease vectors Financial Trends, Market Indicators and Crisis Alert Icons Set. This comprehensive vector illustration features a set of 18 flat icons depicting various financial trends, market indicators, and warning signals. The collection includes rising and falling line graphs, bar charts, currency symbols (dollar and euro) indicating fluctuations, and alert symbols like sirens and exclamation marks. Ideal for illustrating concepts of economic growth, decline, market volatility, financial crisis, investment risks, and business performance. Perfect for presentations, reports, websites, and applications related to finance, economics, and stock markets.
Free with trial Collection of simple black vector icons representing financial charts, data analysis graphs, and business statistics. Includes trend arrows, magnifier, and settings symbols. Bar chart decrease vectors Set of black business graph and chart icons for data analysis. Collection of simple black vector icons representing financial charts, data analysis graphs, and business statistics. Includes trend arrows, magnifier, and settings symbols
Free with trial This image illustrates a bar graph showing an upward trend in financial growth, accompanied by a line graph depicting market fluctuations over time. Bar chart decrease illustrations Graphical representation of financial growth and fluctuation. This image illustrates a bar graph showing an upward trend in financial growth, accompanied by a line graph depicting market fluctuations over time
Free with trial A vibrant, hand-drawn doodle illustration centered around a large percentage sign. This creative sketch features various financial and business icons, including bar graphs, pie charts, stacks of coins, dollar signs, and arrows indicating growth and decline. The colorful, cartoonish style makes it perfect for illustrating concepts like interest rates, economic trends, business analytics, and financial reports. Ideal for use in presentations, infographics, websites, and educational materials, this vector art is isolated on a white background for versatile application. Bar chart decrease illustrations Finance and Economy Doodle Illustration. A vibrant, hand-drawn doodle illustration centered around a large percentage sign. This creative sketch features various financial and business icons, including bar graphs, pie charts, stacks of coins, dollar signs, and arrows indicating growth and decline. The colorful, cartoonish style makes it perfect for illustrating concepts like interest rates, economic trends, business analytics, and financial reports. Ideal for use in presentations, infographics, websites, and educational materials, this vector art is isolated on a white background for versatile application.
Free with trial Circular maze with a descending bar chart icon, symbolizing the challenge of navigating business data and analytics amid declines, obstacles, and the search for strategic solutions and recovery. Bar chart decrease illustrations Navigating complex data decline challenges and finding solutions. Circular maze with a descending bar chart icon, symbolizing the challenge of navigating business data and analytics amid declines, obstacles, and the search for strategic solutions and recovery