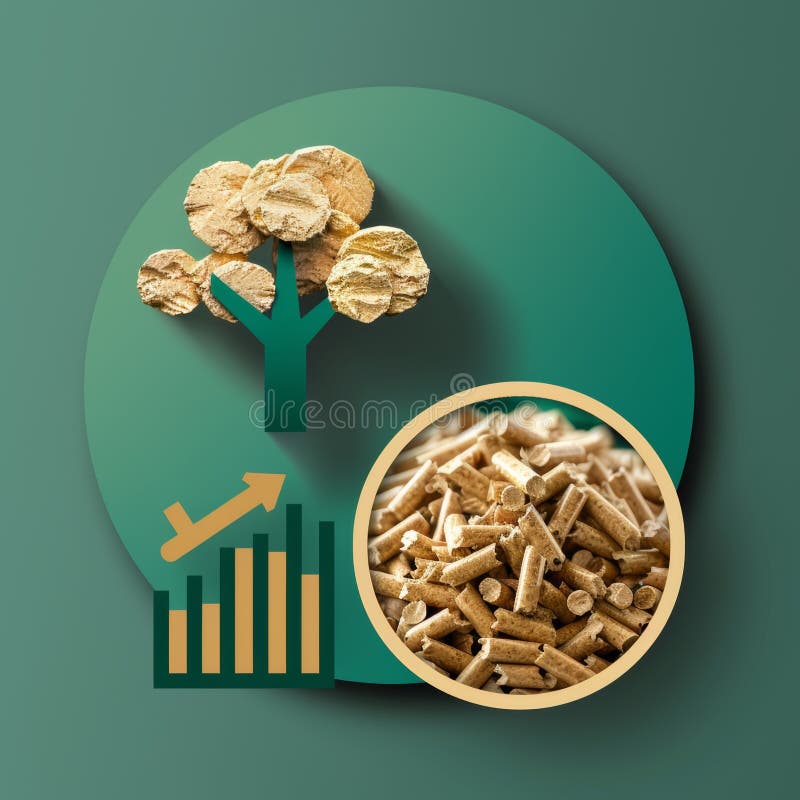
Free with trial Tree illustration with bar graph displaying decrease in carbon emissions from wood pellets, Generated by AI. Data decrease illustrations Tree illustration with bar graph displaying decrease in carbon emissions from wood pellets
Free with trial Abstract graph with zigzag pattern, 3 data points connected by line, hand pointing upwards For Social Media Post Size. Data decrease illustrations Abstract graph with zigzag pattern, 3 data points connected by line, hand pointing upwards
Free with trial Abstract financial chart with red bars and lines representing market decline, emphasizing data analysis and economics. Generative AI. Data decrease illustrations Abstract financial chart with red bars and lines representing market decline, emphasizing data analysis and economics
Free with trial Tree illustration with bar graph displaying decrease in carbon emissions from wood pellets, Generated by AI. Data decrease illustrations Tree illustration with bar graph displaying decrease in carbon emissions from wood pellets
Free with trial Tree illustration with bar graph displaying decrease in carbon emissions from wood pellets, Generated by AI. Data decrease illustrations Tree illustration with bar graph displaying decrease in carbon emissions from wood pellets
Free with trial Tree illustration with bar graph displaying decrease in carbon emissions from wood pellets, Generated by AI. Data decrease illustrations Tree illustration with bar graph displaying decrease in carbon emissions from wood pellets
Free with trial Tree illustration with bar graph displaying decrease in carbon emissions from wood pellets, Generated by AI. Data decrease illustrations Tree illustration with bar graph displaying decrease in carbon emissions from wood pellets
Free with trial An enthusiastic senator proudly holds up a bar graph pointing out the significant decrease in crime rates since a new databased policy was put into place.. Vector illustration. Data decrease vectors An enthusiastic senator proudly holds up a bar graph pointing out the significant decrease in crime rates since a new
Free with trial A dynamic 3D illustration of a glossy red arrow pointing downwards in a jagged, volatile path. Isolated on a white background, this graphic icon is a powerful symbol for negative concepts. It represents decline, decrease, failure, loss, and crisis. This visual is perfect for illustrating stock market crashes, economic recession, financial downturns, poor business performance, or any downward trend in data and statistics. An ideal element for reports, presentations, and financial news, with ample copy space. Data decrease illustrations Red Jagged Arrow of Decline - Financial Crisis Concept. A dynamic 3D illustration of a glossy red arrow pointing downwards in a jagged, volatile path. Isolated on a white background, this graphic icon is a powerful symbol for negative concepts. It represents decline, decrease, failure, loss, and crisis. This visual is perfect for illustrating stock market crashes, economic recession, financial downturns, poor business performance, or any downward trend in data and statistics. An ideal element for reports, presentations, and financial news, with ample copy space.
Free with trial A vibrant 3D bar chart icon isolated on a clean white background. This minimalist data visualization features five colorful bars in a soft, pastel palette of yellow, pink, and purple, arranged in descending order. The clean, modern render is perfect for illustrating concepts like business statistics, financial reports, market analysis, and performance metrics. An ideal graphic element for presentations, infographics, websites, and educational materials, symbolizing data, comparison, and analytics in a visually appealing way. 3D illustration. Data decrease illustrations 3D Colorful Bar Chart for Business and Data Analysis. A vibrant 3D bar chart icon isolated on a clean white background. This minimalist data visualization. A vibrant 3D bar chart icon isolated on a clean white background. This minimalist data visualization features five colorful bars in a soft, pastel palette of yellow, pink, and purple, arranged in descending order. The clean, modern render is perfect for illustrating concepts like business statistics, financial reports, market analysis, and performance metrics. An ideal graphic element for presentations, infographics, websites, and educational materials, symbolizing data, comparison, and analytics in a visually appealing way. 3D illustration.
Free with trial Company graphs data illustration time valleys, volatility market, background trend company graphs data. Data decrease illustrations Company graphs data
Free with trial Set Browser with shield, Financial growth decrease, window and Secure your site HTTPS, SSL icon. Vector. Data decrease vectors Set Browser with shield, Financial growth decrease, window and Secure your site HTTPS, SSL icon. Vector
Free with trial Tree illustration with bar graph displaying decrease in carbon emissions from wood pellets, Generated by AI. Data decrease illustrations Tree illustration with bar graph displaying decrease in carbon emissions from wood pellets
Free with trial Bear or bearish market trend in crypto currency or stocks. Trade exchange background, down arrow graph for decrease in rates. Cryptocurrency price chart, blockchain technology. Global economy crash. , AI. Data decrease illustrations Bear or bearish market trend in crypto currency or stocks. Trade exchange background, down arrow graph for decrease in rates.
Free with trial Bear or bearish market trend in crypto currency or stocks. Trade exchange background, down arrow graph for decrease in rates. Cryptocurrency price chart, blockchain technology. Global economy crash. , AI. Data decrease illustrations Bear or bearish market trend in crypto currency or stocks. Trade exchange background, down arrow graph for decrease in rates.
Free with trial Bear or bearish market trend in crypto currency or stocks. Trade exchange background, down arrow graph for decrease in rates. Cryptocurrency price chart, blockchain technology. Global economy crash. , AI. Data decrease illustrations Bear or bearish market trend in crypto currency or stocks. Trade exchange background, down arrow graph for decrease in rates.
Free with trial Bear or bearish market trend in crypto currency or stocks. Trade exchange background, down arrow graph for decrease in rates. Cryptocurrency price chart, blockchain technology. Global economy crash. , AI. Data decrease illustrations Bear or bearish market trend in crypto currency or stocks. Trade exchange background, down arrow graph for decrease in rates.
Free with trial Bear or bearish market trend in crypto currency or stocks. Trade exchange background, down arrow graph for decrease in rates. Cryptocurrency price chart, blockchain technology. Global economy crash. , AI. Data decrease illustrations Bear or bearish market trend in crypto currency or stocks. Trade exchange background, down arrow graph for decrease in rates.
Free with trial Bear or bearish market trend in crypto currency or stocks. Trade exchange background, down arrow graph for decrease in rates. Cryptocurrency price chart, blockchain technology. Global economy crash. , AI. Data decrease illustrations Bear or bearish market trend in crypto currency or stocks. Trade exchange background, down arrow graph for decrease in rates.
Free with trial Bear or bearish market trend in crypto currency or stocks. Trade exchange background, down arrow graph for decrease in rates. Cryptocurrency price chart, blockchain technology. Global economy crash. , AI. Data decrease illustrations Bear or bearish market trend in crypto currency or stocks. Trade exchange background, down arrow graph for decrease in rates.
Free with trial Bear or bearish market trend in crypto currency or stocks. Trade exchange background, down arrow graph for decrease in rates. Cryptocurrency price chart, blockchain technology. Global economy crash. , AI. Data decrease illustrations Bear or bearish market trend in crypto currency or stocks. Trade exchange background, down arrow graph for decrease in rates.
Free with trial Bear or bearish market trend in crypto currency or stocks. Trade exchange background, down arrow graph for decrease in rates. Cryptocurrency price chart, blockchain technology. Global economy crash. , AI. Data decrease illustrations Bear or bearish market trend in crypto currency or stocks. Trade exchange background, down arrow graph for decrease in rates.
Free with trial Co2, carbon emission reduction, woman analyzing data, vector illustration. Data decrease vectors Co2 carbon emission reduction, woman analyzes data. co2, carbon emission reduction, woman analyzing data, vector illustration
Free with trial Data merging loss graph illustration analysis metrics, performance validation, accuracy convergence data merging loss graph. Data decrease illustrations Data merging loss graph
Free with trial Set line Delivery tracking, Financial growth decrease, Layers and Infographic element. White square button. Vector. Data decrease vectors Set line Delivery tracking, Financial growth decrease, Layers and Infographic element. White square button. Vector
Free with trial Candlestick chart showing a series of red and green bars representing price fluctuations over time. Each rectangular bar displays financial data, with green indicating an increase and red indicating a decrease. Thin vertical lines extend above and below the bars, illustrating price range. Numerical values such as 20. 800 and 213. 500 label specific points on the chart, judging stock or currency performance. Horizontal lines suggest moving averages, highlighting trends in the data. Data decrease illustrations Candlestick chart showing a series of red and green bars representing price
Free with trial Data merging sales graph illustration analysis trends, revenue performance, forecast comparison data merging sales graph. Data decrease illustrations Data merging sales graph
Free with trial Set line Online shopping on screen Browser window setting and Financial growth decrease. Business infographic template. Vector. Data decrease vectors Set line Online shopping on screen, Browser window, setting and Financial growth decrease. Business infographic template
Free with trial Data loading sales graph illustration analytics visualization, performance trends, metrics dashboard data loading sales graph. Data decrease illustrations Data loading sales graph
Free with trial Comparison comparing data illustration analysis graph, traffic website, overlay divergence comparison comparing data. Data decrease illustrations Comparison comparing data
Free with trial The image displays a candlestick chart, commonly used in financial markets to represent price movements of an asset over time. the chart features red and green candlesticks, where green indicates a price increase and red indicates a price decrease. a yellow line overlays the candlesticks, likely representing a moving average, which is a common technical indicator used to smooth out price data and identify trends. the chart is set against a dark blue background with grid lines, and time intervals are marked along the x-axis. a scale on the right side shows the price values. the overall impression is that of a tool used for technical analysis in trading or investment. Data decrease illustrations Stock market candlestick chart with moving average. the image displays a candlestick chart, commonly used in financial markets to represent price movements of an asset over time. the chart features red and green candlesticks, where green indicates a price increase and red indicates a price decrease. a yellow line overlays the candlesticks, likely representing a moving average, which is a common technical indicator used to smooth out price data and identify trends. the chart is set against a dark blue background with grid lines, and time intervals are marked along the x-axis. a scale on the right side shows the price values. the overall impression is that of a tool used for technical analysis in trading or investment.
Free with trial Square icon with rounded edges featuring a red downward-trending bar graph on a white background. The graph has five bars of varying heights, each decreasing from left to right, with a red arrow descending across the tops of the bars. The icon is set against a plain gray background, highlighting the contrast between the red graph and the white square. The design suggests a decrease or decline in data or statistics, commonly used in business or financial contexts. Data decrease illustrations Square icon with rounded edges featuring a red downward-trending bar graph on a
Free with trial Illustration features two stylized documents with checkmarks, symbolizing tasks or data lists. Adjacent to the papers are a green upward arrow and a red downward arrow, each marked with a percentage sign, indicating increase and decrease in values. The background is light blue, enhancing the contrast. The graphic suggests concepts of data analysis, financial trends, or statistical reports. Data decrease vectors Duplicate or update thin line document. Illustration features two stylized documents with checkmarks, symbolizing tasks or data lists. Adjacent to the papers are a green upward arrow and a red downward arrow, each marked with a percentage sign, indicating increase and decrease in values. The background is light blue, enhancing the contrast. The graphic suggests concepts of data analysis, financial trends, or statistical reports.
Free with trial 3D illustration of a bar graph showing a declining trend. Red bars of decreasing height are set against a backdrop of a light gray frame. The image is perfect for presentations, reports, or any visual representation of negative growth, decline, or decrease in data. Suitable for use in business, finance, and educational contexts. Data decrease vectors Declining Trend Bar Graph. 3D illustration of a bar graph showing a declining trend. Red bars of decreasing height are set against a backdrop of a light gray frame. The image is perfect for presentations, reports, or any visual representation of negative growth, decline, or decrease in data. Suitable for use in business, finance, and educational contexts.
Free with trial Generated with the use of AI. 3D graphic bar graph showing a declining trend, where the bars gradually decrease in height. The graph's surface is metallic, reflecting a somber environment. DEFLATION emphasizing economic downturn. Data decrease illustrations 3D graphic bar graph showing a declining trend where the bars gradually decrease in height. The graphs surface is metallic. Generated with the use of AI. 3D graphic bar graph showing a declining trend, where the bars gradually decrease in height. The graph's surface is metallic, reflecting a somber environment. DEFLATION emphasizing economic downturn
Free with trial A line graph with a decreasing trend is commonly used to depict scenarios like declining sales, decreasing stock prices, or any situation where a decrease in values over time or across categories is a significant aspect of the data. It provides a clear and intuitive way to understand trends and make informed interpretations about the decreasing values being represented. Data decrease illustrations Chart with decreasing line graph. A line graph with a decreasing trend is commonly used to depict scenarios like declining sales, decreasing stock prices, or any situation where a decrease in values over time or across categories is a significant aspect of the data. It provides a clear and intuitive way to understand trends and make informed interpretations about the decreasing values being represented.
Free with trial Set line Server Website with stocks market Infographic of city map Laptop browser window Financial growth decrease Browser shield Photo retouching and Secure your HTTPS SSL icon. Vector. Data decrease illustrations Set line Server, Website with stocks market, Infographic of city map, Laptop browser window, Financial growth decrease. Set line Server Website with stocks market Infographic of city map Laptop browser window Financial growth decrease Browser shield Photo retouching and Secure your HTTPS SSL icon. Vector.
Free with trial A visual representation of data, showcasing trends and comparisons through a green bar chart. This graphic illustrates statistical information and growth patterns effectively. Data decrease illustrations Bar chart data analysis on. A visual representation of data, showcasing trends and comparisons through a green bar chart. This graphic illustrates statistical information and growth patterns effectively
Free with trial Bar graphs data illustration company year, color performance, categories trend bar graphs data. Data decrease illustrations Bar graphs data
Free with trial This image showcases a dynamic data visualization, generated by AI, depicting a flowing wave pattern over a gridded background. The abstract design uses cool blue tones and suggests growth, movement, or change in data trends. The wave's form is both aesthetically pleasing and symbolic of complex in. Data decrease illustrations Abstract Data Wave. This image showcases a dynamic data visualization, generated by AI, depicting a flowing wave pattern over a gridded background. The abstract design uses cool blue tones and suggests growth, movement, or change in data trends. The wave's form is both aesthetically pleasing and symbolic of complex in
Free with trial A simple line graph illustration showing fluctuations and an upward trend. The graph is drawn on a grid with a black line and red data points, indicating a period of increase, followed by a decrease, and then a final increase. This image can be used to represent business trends, financial analysis, stock market data, or any data that shows changes over time. Data decrease vectors Line Graph with Fluctuations. A simple line graph illustration showing fluctuations and an upward trend. The graph is drawn on a grid with a black line and red data points, indicating a period of increase, followed by a decrease, and then a final increase. This image can be used to represent business trends, financial analysis, stock market data, or any data that shows changes over time.
Free with trial This image showcases six vibrant icons representing various data visualization methods, including pie charts, bar graphs, and gauges. These colorful and engaging visuals are perfect for presentations or reports and were generated by AI. They offer a quick and easy way to represent data in a clear a. Data decrease illustrations Colorful Data Visualization Icons. This image showcases six vibrant icons representing various data visualization methods, including pie charts, bar graphs, and gauges. These colorful and engaging visuals are perfect for presentations or reports and were generated by AI. They offer a quick and easy way to represent data in a clear a
Free with trial Abstract graphical representation of data trends, likely showing increases and decreases. The design is composed of a network of connecting points and lines, with a pattern of various shades of gray, white, and red. The texture suggests a digital or technological origin, with a soft focus on the visual elements. The format is suitable for commercial or editorial purposes related to technology,. Data decrease illustrations Abstract data graph visualization. Abstract graphical representation of data trends, likely showing increases and decreases. The design is composed of a network of connecting points and lines, with a pattern of various shades of gray, white, and red. The texture suggests a digital or technological origin, with a soft focus on the visual elements. The format is suitable for commercial or editorial purposes related to technology,
Free with trial Close-up of a digital stock market ticker showing share symbols, prices, percentage changes, and market index performance. The display features rising and falling stocks, market fluctuations, and trading data. Ideal for financial concepts, investment visuals, stock exchange, market trends, trading platforms, finance news, economic reports, and financial presentations. Data decrease illustrations . Close-up of a digital stock market ticker showing share symbols, prices, percentage changes, and market index performance. The display features rising and falling stocks, market fluctuations, and trading data. Ideal for financial concepts, investment visuals, stock exchange, market trends, trading platforms, finance news, economic reports, and financial presentations.
Free with trial Abstract graph with zigzag pattern, 3 data points connected by line, hand pointing upwards Generative AI. Data decrease illustrations Abstract graph with zigzag pattern, 3 data points connected by line, hand pointing upwards
Free with trial Abstract graph with zigzag pattern, 3 data points connected by line, hand pointing upwards Vertical Mobile Wallpaper. Data decrease illustrations Abstract graph with zigzag pattern, 3 data points connected by line, hand pointing upwards
Free with trial Abstract graph with zigzag pattern, 3 data points connected by line, hand pointing upwards Vertical Mobile Wallpaper. Data decrease illustrations Abstract graph with zigzag pattern, 3 data points connected by line, hand pointing upwards
Free with trial Abstract graph with zigzag pattern, 3 data points connected by line, hand pointing upwards Vertical Mobile Wallpaper. Data decrease illustrations Abstract graph with zigzag pattern, 3 data points connected by line, hand pointing upwards
Free with trial A simple vector outline illustration of a down-pointing arrow. This icon symbolizes down, descend, decrease, or download. Ideal for user interfaces, data indicators, directional signs, or instructional graphics. Its clear directional message is suitable for various digital and print applications, vector design Generative AI. Data decrease vectors Down Arrow Descend Fall Direction Vector, vector design Generative AI. A simple vector outline illustration of a down-pointing arrow. This icon symbolizes down, descend, decrease, or download. Ideal for user interfaces, data indicators, directional signs, or instructional graphics. Its clear directional message is suitable for various digital and print applications, vector design Generative AI
Free with trial Line graph is representing market trend with data points. Data decrease vectors Line graph showing market trend with data points. Line graph is representing market trend with data points
Free with trial A simple flat vector illustration of a downward arrow, symbolizing decrease, decline, or downward movement. Ideal for data visualization, negative trends, or navigational prompts. Its clear design ensures immediate understanding for various informational graphics, vector design Generative AI. Data decrease vectors Flat Downward Arrow Direction Icon, vector design Generative AI. A simple flat vector illustration of a downward arrow, symbolizing decrease, decline, or downward movement. Ideal for data visualization, negative trends, or navigational prompts. Its clear design ensures immediate understanding for various informational graphics, vector design Generative AI
Free with trial A colored outline vector icon of a line graph showing a downward trend, indicating a decrease or decline. Represents financial trends, statistics, losses, or negative performance. Useful for finance, business reports, or data visualization showing reduction. Illustrates a declining value over time, vector design Generative AI. Data decrease vectors Decreasing Trend Stock Market Graph Vector, vector design Generative AI. A colored outline vector icon of a line graph showing a downward trend, indicating a decrease or decline. Represents financial trends, statistics, losses, or negative performance. Useful for finance, business reports, or data visualization showing reduction. Illustrates a declining value over time, vector design Generative AI
Free with trial A clear vector illustration of a minus sign transforming into an arrow pointing right, symbolizing reduction, decrease, or negative progress. Ideal for data visualization, economic trends, or abstract concepts of decline. It visually conveys a shift downwards or towards less, vector design Generative AI. Data decrease vectors Minus Sign Arrow, Reduction Progress, vector design Generative AI. A clear vector illustration of a minus sign transforming into an arrow pointing right, symbolizing reduction, decrease, or negative progress. Ideal for data visualization, economic trends, or abstract concepts of decline. It visually conveys a shift downwards or towards less, vector design Generative AI
Free with trial Abstract financial chart with red bars and lines representing market decline, emphasizing data analysis and economics. Generative AI. Data decrease illustrations Abstract financial chart with red bars and lines representing market decline, emphasizing data analysis and economics
Free with trial Abstract financial chart with red bars and lines representing market decline, emphasizing data analysis and economics. Generative AI. Data decrease illustrations Abstract financial chart with red bars and lines representing market decline, emphasizing data analysis and economics
Free with trial Long, three dimensional arrow pointing downwards, symbolizing a decrease or decline. Data decrease illustrations Isometric arrow pointing down representing decrease. Long, three dimensional arrow pointing downwards, symbolizing a decrease or decline
Free with trial This vibrant, wavy graph, generated by AI, displays data progression using a color-coded system. The gradual color shift from green to red signifies a change in values, making it ideal for representing various trends or metrics. The accompanying key provides additional clarity. Data decrease illustrations Colorful AI-Generated Data Visualization. This vibrant, wavy graph, generated by AI, displays data progression using a color-coded system. The gradual color shift from green to red signifies a change in values, making it ideal for representing various trends or metrics. The accompanying key provides additional clarity.
Free with trial A prominent down arrow icon, rendered with a bold outline, indicating direction, download, or a decrease. Suitable for user interfaces, directional signage, data visualization, or instructional graphics. Its clear and strong form ensures immediate recognition, vector design Generative AI. Data decrease vectors Down Arrow Icon in Bold Outline Style, vector design Generative AI. A prominent down arrow icon, rendered with a bold outline, indicating direction, download, or a decrease. Suitable for user interfaces, directional signage, data visualization, or instructional graphics. Its clear and strong form ensures immediate recognition, vector design Generative AI
Free with trial Decrease glowing style sales graph split illustration profit revenue, analysis forecast, growth decline decrease glowing style sales graph split. Data decrease illustrations Decrease glowing style sales graph split
Free with trial Multiple line charts showing data trends over months on a grid background. Concept of data analysis and financial growth. 3D Rendering. Data decrease illustrations Multiple line charts showing data trends over months on grid background. 3D Rendering. Multiple line charts showing data trends over months on a grid background. Concept of data analysis and financial growth. 3D Rendering
Free with trial A vector icon depicting a line chart with a downward trend. Represents decline, decrease, negative trend, or falling statistics. Useful for finance apps, business reports, stock market monitoring, or visualizing negative data changes, vector design Generative AI. Data decrease vectors Decreasing Line Chart Icon Vector Illustration, vector design Generative AI. A vector icon depicting a line chart with a downward trend. Represents decline, decrease, negative trend, or falling statistics. Useful for finance apps, business reports, stock market monitoring, or visualizing negative data changes, vector design Generative AI
Free with trial This icon represents a decrease trend with multiple arrows pointing down. Data decrease vectors Arrows pointing down representing decrease trend icon. This icon represents a decrease trend with multiple arrows pointing down
Free with trial A modern, colorful bar chart illustrates a downward trend in financial performance or statistical data. Data decrease illustrations Financial Data Analysis Graph Illustration. A modern, colorful bar chart illustrates a downward trend in financial performance or statistical data
Free with trial 3D rendering of a dynamic presentation stand showcasing financial data. Colorful, geometric shapes and infographics present market statistics, including percentages, dollar amounts, and bar graphs. Stacks of coins and various data elements are displayed on a dark blue platform with orange accents. Suitable for illustrating financial reports, market analysis, investment strategies, or business presentations. Data decrease illustrations Modern Financial Data Visualization Display. 3D rendering of a dynamic presentation stand showcasing financial data. Colorful, geometric shapes and infographics present market statistics, including percentages, dollar amounts, and bar graphs. Stacks of coins and various data elements are displayed on a dark blue platform with orange accents. Suitable for illustrating financial reports, market analysis, investment strategies, or business presentations.
Free with trial Trend hand drawn style declining sales graph illustration decrease arrow, data analytics, visual report trend hand drawn style declining sales graph. Data decrease illustrations Trend hand drawn style declining sales graph
Free with trial Abstract Glowing Orange and Blue Data Graph. Data decrease illustrations Abstract Glowing Orange and Blue Data Graph
Free with trial A hand in a black suit sleeve points downward against a red background. The hand is prominently featured in the foreground, emphasizing direction. Behind it, a red zigzag line graph with an arrow points downward, symbolizing decline or reduction. The red background accentuates the theme of loss or decrease, commonly associated with financial or performance downturns. The image combines elements of business attire with graphical data representation, conveying a message of falling trends or negative outcomes. Data decrease illustrations A hand in a black suit sleeve points downward against a red background. The hand
Free with trial This image shows a person's hand holding a smartphone displaying a stock market chart. In the background, a larger monitor mirrors similar stock data. The scene conveys trading, investment, and financial analysis through technology. The focus is on digital finance, with the smartphone symbolizing accessibility and immediacy in market engagement. The red and green lines in the graphs represent market fluctuations, essential for traders monitoring stock performance. Data decrease illustrations Stock Trading on Smartphone: Analyzing Market Data. This image shows a person's hand holding a smartphone displaying a stock market chart. In the background, a larger monitor mirrors similar stock data. The scene conveys trading, investment, and financial analysis through technology. The focus is on digital finance, with the smartphone symbolizing accessibility and immediacy in market engagement. The red and green lines in the graphs represent market fluctuations, essential for traders monitoring stock performance.
Free with trial Decrease graph icon in generic style. Statistic illustration concept. Data decrease vectors Decrease graph icon in generic style. Statistic concept. Decrease graph icon in generic style. Statistic illustration concept
Free with trial This minimalist vector illustration features two identical line graphs, presented in contrasting black and white themes. The left graph displays a black line on a white background, while the right shows a white line on a black background. Both graphs depict a clear downward trend with jagged fluctuations, symbolizing decline, loss, or negative growth over time. This versatile icon set is ideal for illustrating concepts such as economic downturns, financial losses, market crashes, business failures, or any data showing a significant decrease. Perfect for presentations, reports, infographics, and web design. Data decrease vectors Declining Line Graph Icon Set - Black and White. This minimalist vector illustration features two identical line graphs, presented in contrasting black and white themes. The left graph displays a black line on a white background, while the right shows a white line on a black background. Both graphs depict a clear downward trend with jagged fluctuations, symbolizing decline, loss, or negative growth over time. This versatile icon set is ideal for illustrating concepts such as economic downturns, financial losses, market crashes, business failures, or any data showing a significant decrease. Perfect for presentations, reports, infographics, and web design.
Free with trial Visualization collapsing data analytics chart illustration trend analysis, dashboard metrics, anomaly decline visualization collapsing data analytics chart. Data decrease illustrations Visualization collapsing data analytics chart
Free with trial Laptop Displays Business Analytics Graph Data. Data decrease illustrations Laptop Displays Business Analytics Graph Data
Free with trial Abstract cloud on red forex chart backdrop. Market crisis and data server concept. 3D Rendering. Data decrease illustrations Abstract cloud on forex chart backdrop. Market crisis and data server concept. 3D Rendering