Free with trial Downward Trend Chart Illustration with Bars and Arrow Signifying Decrease Business and Finance Data. AI generated. Decrease charts vectors Downward Trend Chart Illustration with Bars and Arrow Signifying Decrease Business and Finance Data. AI generated
Free with trial The image displays an abstract symbol that appears to be inspired by candlestick charts used in financial markets. it features a symmetrical design with two sets of shapes. the top set consists of two vertical rectangles, one green on the left and one red on the right, each with a short vertical line extending upwards from its top. below this set is a horizontal rectangle, half green and half red. the bottom set mirrors the top, with two vertical rectangles, again green on the left and red on the right, each with a short vertical line extending downwards from its bottom. the green color typically represents a bullish trend (price increase), while the red represents a bearish trend (price decrease). the overall design is clean and minimalist, set against a white background. Decrease charts illustrations Abstract bullish bearish candlestick chart symbol. The image displays an abstract symbol that appears to be inspired by candlestick charts used in financial. the image displays an abstract symbol that appears to be inspired by candlestick charts used in financial markets. it features a symmetrical design with two sets of shapes. the top set consists of two vertical rectangles, one green on the left and one red on the right, each with a short vertical line extending upwards from its top. below this set is a horizontal rectangle, half green and half red. the bottom set mirrors the top, with two vertical rectangles, again green on the left and red on the right, each with a short vertical line extending downwards from its bottom. the green color typically represents a bullish trend (price increase), while the red represents a bearish trend (price decrease). the overall design is clean and minimalist, set against a white background.
Free with trial Rate showing extensive set of dark gray illustrating financial graphs charts and data analysis symbols keywords: financial, graphs, charts, data. Decrease charts illustrations Extensive Set of Dark Gray Illustrating Financial Graphs Charts and Data Analysis Symbols Keywords: financial. Rate showing extensive set of dark gray. Rate showing extensive set of dark gray illustrating financial graphs charts and data analysis symbols keywords: financial, graphs, charts, data
Free with trial A collage of nine distinct charts and graphs, primarily displaying financial data, growth trends, and economic indicators. The visuals feature line graphs, area charts, and bar charts with various colored lines and shaded areas representing different metrics over time. Accompanying text and labels suggest analysis of business performance, economic growth, and financial markets. This collection is ideal for presentations, reports, and articles related to finance, economics, and business analytics. Decrease charts illustrations Collection of Financial and Business Growth Charts. A collage of nine distinct charts and graphs, primarily displaying financial data, growth trends, and. A collage of nine distinct charts and graphs, primarily displaying financial data, growth trends, and economic indicators. The visuals feature line graphs, area charts, and bar charts with various colored lines and shaded areas representing different metrics over time. Accompanying text and labels suggest analysis of business performance, economic growth, and financial markets. This collection is ideal for presentations, reports, and articles related to finance, economics, and business analytics.
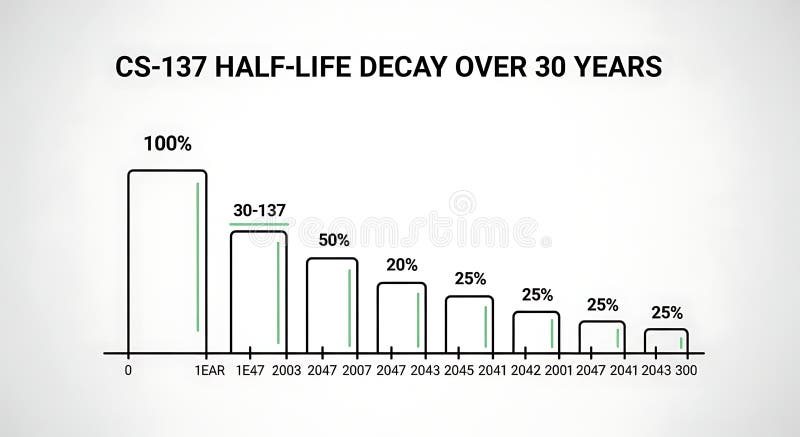
Free with trial A line graph illustrating the decrease in half-life over 30 years with bars representing percentage decay at different years, demonstrating long-term decline suitable for scientific, educational, or research presentations. Decrease charts illustrations Half-life Decay Over 30 Years Chart Showing Decrease in Value or Effectiveness. A line graph illustrating the decrease in half-life over 30 years with bars. A line graph illustrating the decrease in half-life over 30 years with bars representing percentage decay at different years, demonstrating long-term decline suitable for scientific, educational, or research presentations
Free with trial Hand-drawn financial charts, graphs, and calculators perfect for business, finance, and accounting illustrations. These vector illustrations depict various tools used for data analysis and financial calculations. Decrease charts vectors Collection of Hand Drawn Financial Charts and Calculators. Hand-drawn financial charts, graphs, and calculators perfect for business, finance, and accounting. Hand-drawn financial charts, graphs, and calculators perfect for business, finance, and accounting illustrations. These vector illustrations depict various tools used for data analysis and financial calculations.
Free with trial A businessman in a suit analyzes financial data on a tablet, with a glowing graph and a percentage decrease suggesting market analysis , image generative using ai tools. Decrease charts illustrations Businessman analyzing financial growth on tablet with percentage decrease. A businessman in a suit analyzes financial data on a tablet, with a glowing graph and. A businessman in a suit analyzes financial data on a tablet, with a glowing graph and a percentage decrease suggesting market analysis , image generative using ai tools
Free with trial Set of twelve black and white icons representing business and finance concepts such as graphs charts analysis tools and targets isolated on transparent background. Decrease charts vectors Collection of business and finance icons including graphs charts and analysis tools for presentations and reports. Set of twelve black and white icons. Set of twelve black and white icons representing business and finance concepts such as graphs charts analysis tools and targets isolated on transparent background
Free with trial Chsales data charts illustration company year, color coded, categories month chsales data charts. Decrease charts illustrations Chsales data charts. Illustration company year, color coded, categories month AI generated. chsales data charts illustration company year, color coded, categories month chsales data charts
Free with trial Business data is visually represented in black and white through various charts and graphs illustrating growth analysis and strategic planning for financial reporting showing a clear picture of market. Decrease charts vectors Black and white business data visualization with charts and graphs showing growth and analysis for financial reporting and. Business data is visually represented. Business data is visually represented in black and white through various charts and graphs illustrating growth analysis and strategic planning for financial reporting showing a clear picture of market
Free with trial Close-up image of a red arrow pointing downwards dramatically positioned on financial charts and graphs illustrating a negative market trend representing economic decline or recession Ideal for illustrating financial loss or economic crisis. Decrease charts illustrations Red Arrow Pointing Down on Financial Charts and Graphs Showing Market Decline Economic Crisis AI generated. Close-up image of a red arrow pointing downwards. Close-up image of a red arrow pointing downwards dramatically positioned on financial charts and graphs illustrating a negative market trend representing economic decline or recession Ideal for illustrating financial loss or economic crisis
Free with trial A green zigzag arrow graph pointing downwards, symbolizing a decrease, decline, or downward trend. This can be used for financial charts showing a market drop or for any data visualization representing a reduction or loss. vector design Generative AI. Decrease charts vectors Green Arrow Graph Pointing Down for Financial and Data Trends, vector design Generative AI. A green zigzag arrow graph pointing downwards, symbolizing a decrease. A green zigzag arrow graph pointing downwards, symbolizing a decrease, decline, or downward trend. This can be used for financial charts showing a market drop or for any data visualization representing a reduction or loss. vector design Generative AI
Free with trial This image features four different types of graphs and charts that illustrate various trends and data analysis. These visual representations include bar graphs, line graphs, and 3D block charts. Decrease charts illustrations Graphs and charts showing trends and data analysis isolated on transparent background. This image features four different types of graphs and charts that. This image features four different types of graphs and charts that illustrate various trends and data analysis. These visual representations include bar graphs, line graphs, and 3D block charts
Free with trial 3D render featuring three blue bar charts labeled "TAX. " Each bar is topped with a gold percentage coin. A red downward arrow is placed on the middle bar, indicating a decrease. The objects are set against a transparent background, enhancing their vibrant blue and gold contrast. The arrangement suggests visual representation of tax data trends. Decrease charts vectors 3d render of blue tax bar charts with gold percentage coins and red arrow isolated on transparent background. 3D render featuring three blue bar charts labeled '. 3D render featuring three blue bar charts labeled "TAX." Each bar is topped with a gold percentage coin. A red downward arrow is placed on the middle bar, indicating a decrease. The objects are set against a transparent background, enhancing their vibrant blue and gold contrast. The arrangement suggests visual representation of tax data trends.
Free with trial Flat design business icons depict various charts, percentage signs, targets, hierarchical diagrams, and coin stacks representing financial growth and data analysis in monochrome. Generative AI. Decrease charts vectors Black and white flat design business icons including charts percentage target and money stacks illustrating financial growth and. Flat design business icons. Flat design business icons depict various charts, percentage signs, targets, hierarchical diagrams, and coin stacks representing financial growth and data analysis in monochrome. Generative AI
Free with trial Business professional analyzing cost data with a magnifying glass over financial charts and graphs indicating market trends and growth opportunities. Glyphic. Decrease charts illustrations Business professional analyzing cost data with a magnifying glass over financial charts and graphs indicating market. Trends and growth opportunities. Glyphic
Free with trial Template sketch image artwork collage of young housewife lady ahnd hold broken coins recession business decrease downwards earnings budget. Decrease charts illustrations Template sketch image artwork collage of young housewife lady ahnd hold broken coins recession business decrease. Downwards earnings budget
Free with trial A modern, clean isometric illustration showcasing various data visualizations. Multiple charts and graphs, including bar charts, line graphs, and pie charts, are displayed on floating screens, representing data analysis, business intelligence, or financial reporting. Ideal for presentations, reports, or website banners related to data-driven concepts. Decrease charts illustrations Isometric 3D Data Visualization: Charts and Graphs on Floating Screens. A modern, clean isometric illustration showcasing various data visualizations. Multiple. A modern, clean isometric illustration showcasing various data visualizations. Multiple charts and graphs, including bar charts, line graphs, and pie charts, are displayed on floating screens, representing data analysis, business intelligence, or financial reporting. Ideal for presentations, reports, or website banners related to data-driven concepts.
Free with trial Displaying slanted turquoise banner showing bold pink HUGE SALE text in interface, with line charts. Digital, marketing, modern, technology, data, analytics, futuristic. Decrease charts illustrations Displaying slanted turquoise banner showing bold pink HUGE SALE text in interface, with line charts. Digital, marketing, modern, technology, data, analytics
Free with trial A comprehensive overview of financial data is presented through various charts and graphs. The scene includes line graphs, bar charts, pie charts, and donut charts, accompanied by stacks of coins. The color palette is muted, featuring shades of beige, brown, and gray, creating a professional and clean aesthetic. This image is suitable for illustrating finance, business, investment, and data analysis concepts. Decrease charts illustrations Financial Data and Charts Overview. A comprehensive overview of financial data is presented through various charts and graphs. The scene includes line graphs. A comprehensive overview of financial data is presented through various charts and graphs. The scene includes line graphs, bar charts, pie charts, and donut charts, accompanied by stacks of coins. The color palette is muted, featuring shades of beige, brown, and gray, creating a professional and clean aesthetic. This image is suitable for illustrating finance, business, investment, and data analysis concepts.
Free with trial Tablet computer, situated on a wooden surface, presents business charts and graphs. A small potted plant is in the foreground. Decrease charts illustrations A tablet computer displaying financial charts and graphs on a wooden surface. Tablet computer, situated on a wooden surface, presents business charts and graphs. Tablet computer, situated on a wooden surface, presents business charts and graphs. A small potted plant is in the foreground
Free with trial Hand-drawn financial charts and graphs displayed on a transparent glass board, perfect for business presentations. Decrease charts illustrations Glass Board with Hand-Drawn Financial Charts and Graphs. Hand-drawn financial charts and graphs displayed on a transparent glass board, perfect for business. Hand-drawn financial charts and graphs displayed on a transparent glass board, perfect for business presentations
Free with trial This image showcases a vibrant 3D rendering of various financial charts, including bar graphs, pie charts, and a rising arrow, symbolizing growth and profitability. Ideal for presentations, reports, and financial articles. Decrease charts illustrations Colorful 3D Financial Charts Showing Growth and Profit. This image showcases a vibrant 3D rendering of various financial charts, including bar graphs, pie charts. This image showcases a vibrant 3D rendering of various financial charts, including bar graphs, pie charts, and a rising arrow, symbolizing growth and profitability. Ideal for presentations, reports, and financial articles.
Free with trial This image showcases vibrant 3D bar and line charts, generated by AI, offering a dynamic visual representation of business data. The colorful design effectively communicates trends and comparisons across multiple data sets, providing a clear and engaging overview of key performance indicators. Decrease charts illustrations AI-Generated 3D Business Charts. This image showcases vibrant 3D bar and line charts, generated by AI, offering a dynamic visual representation of business data. This image showcases vibrant 3D bar and line charts, generated by AI, offering a dynamic visual representation of business data. The colorful design effectively communicates trends and comparisons across multiple data sets, providing a clear and engaging overview of key performance indicators.
Free with trial Hand-drawn diagram illustrating a financial decline, featuring a large central downward arrow annotated with terms like falling, decrease, and downward trend. Surrounding elements include bar graphs and line charts labeled sales, metrics, and loss, each with arrows pointing downwards. The sketch uses rough, scribbled lines on a textured paper background to emphasize negative financial performance. Decrease charts illustrations Scribbled lines on a textured paper background to emphasize negative. Hand-drawn diagram illustrating a financial decline, featuring a large central downward. Hand-drawn diagram illustrating a financial decline, featuring a large central downward arrow annotated with terms like falling, decrease, and downward trend. Surrounding elements include bar graphs and line charts labeled sales, metrics, and loss, each with arrows pointing downwards. The sketch uses rough, scribbled lines on a textured paper background to emphasize negative financial performance.
Free with trial A close-up image depicting a red arrow pointing downwards positioned on a stack of documents and charts This represents a financial downturn or business decline illustrating concepts such as market crisis or economic loss A laptop is visible in the background. Decrease charts illustrations Financial Decline Red Arrow on Stack of Documents and Charts Showing Business Downturn AI generated. A close-up image depicting a red arrow pointing downwards. A close-up image depicting a red arrow pointing downwards positioned on a stack of documents and charts This represents a financial downturn or business decline illustrating concepts such as market crisis or economic loss A laptop is visible in the background
Free with trial This image was created using Generative AI. Set of black and white symbols showing increase and decrease trends. Bar charts with arrows indicate market performance, profit, loss, and financial statistics for business analysis. Decrease charts vectors Business growth and decline icons with charts. This image was created using Generative AI. Set of black and white symbols showing increase and decrease trends. This image was created using Generative AI. Set of black and white symbols showing increase and decrease trends. Bar charts with arrows indicate market performance, profit, loss, and financial statistics for business analysis
Free with trial A 3D figure sits on a platform reviewing financial data, using a laptop to analyze bar graphs, pie charts and line graphs representing business performance and growth. Decrease charts illustrations 3D Character Analyzing Business Charts and Graphs on Laptop. A 3D figure sits on a platform reviewing financial data, using a laptop to analyze bar graphs, pie. A 3D figure sits on a platform reviewing financial data, using a laptop to analyze bar graphs, pie charts and line graphs representing business performance and growth.
Free with trial This image displays two distinct charts illustrating annual revenue performance over quarters. The left chart features a line graph with shaded areas, showing trends and cumulative revenue. The right chart presents a bar graph with stacked segments, offering a clear comparison of revenue contributions across different quarters. Both charts use a clean, modern design with blue, green, and gray color palettes, suitable for business presentations, financial reports, and data visualization. Decrease charts illustrations Annual Revenue Performance Charts: Line and Bar Graphs. This image displays two distinct charts illustrating annual revenue performance over quarters. The left. This image displays two distinct charts illustrating annual revenue performance over quarters. The left chart features a line graph with shaded areas, showing trends and cumulative revenue. The right chart presents a bar graph with stacked segments, offering a clear comparison of revenue contributions across different quarters. Both charts use a clean, modern design with blue, green, and gray color palettes, suitable for business presentations, financial reports, and data visualization.
Free with trial This image was created using Generative AI. A set of financial icons featuring graphs, charts, and money. Business and finance concepts. Decrease charts vectors Financial icons set with graphs, charts, and money. This image was created using Generative AI. A set of financial icons featuring graphs, charts, and money. This image was created using Generative AI. A set of financial icons featuring graphs, charts, and money. Business and finance concepts
Free with trial Infographic collage illustrating rising fuel prices and economic inflation with multiple line and bar charts showing upward and downward trends. Central image features a fuel pump nozzle over a bold red-orange rising arrow, surrounded by icons of shopping carts, houses, coins, and delivery trucks. Blue, gray, and red graphs depict cost increases. Ideal for articles on energy, economy, inflation, logistics, and financial analysis. Decrease charts vectors Rising Fuel Prices and Inflation Economic Charts. Infographic collage illustrating rising fuel prices and economic inflation with multiple line and bar charts. Infographic collage illustrating rising fuel prices and economic inflation with multiple line and bar charts showing upward and downward trends. Central image features a fuel pump nozzle over a bold red-orange rising arrow, surrounded by icons of shopping carts, houses, coins, and delivery trucks. Blue, gray, and red graphs depict cost increases. Ideal for articles on energy, economy, inflation, logistics, and financial analysis.
Free with trial A compelling image depicting a red downward-pointing arrow dramatically positioned over a stack of financial reports visually communicating a significant market downturn or economic crisis The charts and graphs emphasize the severity of the decline Ideal for illustrating financial news or articles related to economic instability. Decrease charts illustrations Financial Crisis Red Downward Arrow on Stack of Financial Reports and Charts Showing Market Decline AI generated. A compelling image depicting a red downward. A compelling image depicting a red downward-pointing arrow dramatically positioned over a stack of financial reports visually communicating a significant market downturn or economic crisis The charts and graphs emphasize the severity of the decline Ideal for illustrating financial news or articles related to economic instability
Free with trial A simple yet effective downward sloping arrow indicating a declining trend or negative progress. This infographic element is ideal for business reports, financial charts, educational materials, or presentations needing to visualize a decrease in value or performance over time. vector design Generative AI. Decrease charts vectors Downward Sloping Graph Arrow for Declining Trends, vector design Generative AI. A simple yet effective downward sloping arrow indicating a declining trend or. A simple yet effective downward sloping arrow indicating a declining trend or negative progress. This infographic element is ideal for business reports, financial charts, educational materials, or presentations needing to visualize a decrease in value or performance over time. vector design Generative AI
Free with trial Close-up view of financial charts in shades of blue with two pens resting on the document. The charts display various lines and bar graphs indicating data trends. The image has a cool tone and a shallow depth of field. Decrease charts illustrations Closeup Blue Financial Charts Two Pens Business Data Analysis Report Graphs Statistics business report. Close-up view of financial charts in shades of blue with. Close-up view of financial charts in shades of blue with two pens resting on the document. The charts display various lines and bar graphs indicating data trends. The image has a cool tone and a shallow depth of field
Free with trial Collection of Hand Drawn Charts and Graphs for Data Visualization. Nine simple black line illustrations of various charts and graphs. Decrease charts vectors Collection of Hand Drawn Charts and Graphs for Data Visualization. Nine simple black line illustrations of various charts and graphs
Free with trial Financial Growth Represented by Coins and Dynamic Charts. Ai Generated. Decrease charts illustrations Financial Growth Represented by Coins and Dynamic Charts. Ai Generated
Free with trial This image showcases vibrant 3D bar and pie charts illustrating upward trending business growth and financial success. Perfect for presentations or reports. Decrease charts illustrations Colorful 3D Bar Charts and Pie Charts Showing Business Growth. This image showcases vibrant 3D bar and pie charts illustrating upward trending business growth. This image showcases vibrant 3D bar and pie charts illustrating upward trending business growth and financial success. Perfect for presentations or reports.
Free with trial Rising thick red arrow filling grid lines in design studio, with blue pink charts, dotted bars. Financial, analytics, data, visualization, digital, technology, infographic. Decrease charts illustrations Rising thick red arrow filling grid lines in design studio, with blue pink charts, dotted bars. Financial, analytics, data, visualization, digital, technology
Free with trial Piggy bank, stethoscope, financial charts, healthcare costs, saving money, artistic wallpaper background Generative AI. Decrease charts illustrations Piggy bank, stethoscope, financial charts, healthcare costs, saving money. Artistic wallpaper background Generative AI
Free with trial A clear vector illustration showing a house icon with a downward arrow and percentage, symbolizing property value decrease or real estate market decline. This graphic is ideal for financial advisors, market analysts, or real estate news, indicating potential challenges or shifts, vector design Generative AI. Decrease charts vectors Property Value Decrease Chart, Real Estate Market Decline, vector design Generative AI. A clear vector illustration showing a house icon with a downward arrow. A clear vector illustration showing a house icon with a downward arrow and percentage, symbolizing property value decrease or real estate market decline. This graphic is ideal for financial advisors, market analysts, or real estate news, indicating potential challenges or shifts, vector design Generative AI
Free with trial Inflation pictogram group. Set of growth and fall signs, income and profit signs. Dollar sign. Charts, notifications, messages. Set. Decrease charts vectors Inflation pictogram group. Set of growth and fall signs, income and profit signs. Dollar sign. Charts, notifications, messages. Inflation pictogram group. Set
Free with trial This image depicts a vibrant and modern representation of financial success, featuring 3D bar graphs, pie charts, and a calculator, all set against a clean white background. The upward-trending graph showcases growth and progress. Decrease charts illustrations Colorful 3D Financial Charts and Calculator Showing Business Growth. This image depicts a vibrant and modern representation of financial success, featuring 3D. This image depicts a vibrant and modern representation of financial success, featuring 3D bar graphs, pie charts, and a calculator, all set against a clean white background. The upward-trending graph showcases growth and progress.
Free with trial A downward pointing V shape arrow icon, perfect for indicating decline, decrease, or a bottoming out. This scalable vector graphic is ideal for financial charts, trend analysis, or negative indicators. Its simple design ensures clarity, making it effective for conveying downward movement or completion, vector design Generative AI. Decrease charts vectors Downward Pointing V Shape Arrow Icon, vector design Generative AI. A downward pointing V shape arrow icon, perfect for indicating decline, decrease, or a. A downward pointing V shape arrow icon, perfect for indicating decline, decrease, or a bottoming out. This scalable vector graphic is ideal for financial charts, trend analysis, or negative indicators. Its simple design ensures clarity, making it effective for conveying downward movement or completion, vector design Generative AI
Free with trial A striking image depicting a red arrow plummeting into a stack of business documents and financial charts The scene symbolizes economic downturn financial crisis or market decline perfect for illustrating articles on business news or financial analysis. Decrease charts illustrations Financial Crisis Concept Red Arrow Plunging into Stack of Business Documents and Charts Showing AI generated. A striking image depicting a red arrow plummeting. A striking image depicting a red arrow plummeting into a stack of business documents and financial charts The scene symbolizes economic downturn financial crisis or market decline perfect for illustrating articles on business news or financial analysis
Free with trial Modern minimalist studio setup featuring a tablet displaying financial data on a stand, surrounded by glowing floating percentage increase and decrease icons, representing economic trends. Decrease charts illustrations Modern Financial Business Presentation with Digital Charts. Modern minimalist studio setup featuring a tablet displaying financial data on a stand, surrounded by. Modern minimalist studio setup featuring a tablet displaying financial data on a stand, surrounded by glowing floating percentage increase and decrease icons, representing economic trends
Free with trial Close-up of various financial charts and graphs displayed on a dark screen, with blue and orange color schemes. Image. Decrease charts illustrations Financial Data Charts and Graphs on Screen. Close-up of various financial charts and graphs displayed on a dark screen, with blue and orange color schemes. AI. Close-up of various financial charts and graphs displayed on a dark screen, with blue and orange color schemes. Image
Free with trial Large red downward arrow overlaying several stock charts with declining trend lines and bar graphs. Charts display numerical data and fluctuating graphs, indicating financial market movements. The bold, three-dimensional arrow visually emphasizes a decrease or negative trend in stock market activities. The background is filled with close-up views of printed charts, highlighting various candlestick patterns typically seen in financial analyses. Decrease charts illustrations Red Arrow Signaling Financial Market Decline on Stock Charts. Large red downward arrow overlaying several stock charts with declining trend lines and bar graphs. Large red downward arrow overlaying several stock charts with declining trend lines and bar graphs. Charts display numerical data and fluctuating graphs, indicating financial market movements. The bold, three-dimensional arrow visually emphasizes a decrease or negative trend in stock market activities. The background is filled with close-up views of printed charts, highlighting various candlestick patterns typically seen in financial analyses.
Free with trial A collection of nine black depicting various business charts and graphs including bar charts pie charts and line graphs against a white background. Decrease charts vectors Set of black business analytics and data charts graph statistics. A collection of nine black depicting various business charts and graphs including bar charts. A collection of nine black depicting various business charts and graphs including bar charts pie charts and line graphs against a white background
Free with trial A prominent red banner featuring a clear downward-pointing arrow. This design effectively symbolizes a decrease, decline, or negative trend, making it suitable for charts, warning indicators, or data visualization in reports and presentations. Bold and direct communication, vector design Generative AI. Decrease charts vectors Red Banner with Downward Trend Arrow, vector design Generative AI. A prominent red banner featuring a clear downward-pointing arrow. This design effectively. A prominent red banner featuring a clear downward-pointing arrow. This design effectively symbolizes a decrease, decline, or negative trend, making it suitable for charts, warning indicators, or data visualization in reports and presentations. Bold and direct communication, vector design Generative AI
Free with trial This conceptual scientific illustration features a dramatic black hole on the left, rendered with a deep blue cosmic background and radiant rays of light emanating from its center, visually paired with a clean, modern bar graph on the right that charts a significant decrease in mass drop events over time, directly comparing a 10x mass decrease against a 100x mass drop with clear white data labels. Decrease charts illustrations An illustration of a black hole with a tenfold mass decrease and hundredfold mass drop alongside a comparative bar graph showing. This conceptual scientific. This conceptual scientific illustration features a dramatic black hole on the left, rendered with a deep blue cosmic background and radiant rays of light emanating from its center, visually paired with a clean, modern bar graph on the right that charts a significant decrease in mass drop events over time, directly comparing a 10x mass decrease against a 100x mass drop with clear white data labels
Free with trial This image showcases colorful 3D rendered charts and graphs displayed on a digital tablet, perfect for business presentations or reports illustrating growth and data analysis. The vibrant colors and clean design make it visually appealing and easy to understand. Decrease charts illustrations Colorful 3D Charts and Graphs on Digital Tablet for Business Presentation. This image showcases colorful 3D rendered charts and graphs displayed on a digital. This image showcases colorful 3D rendered charts and graphs displayed on a digital tablet, perfect for business presentations or reports illustrating growth and data analysis. The vibrant colors and clean design make it visually appealing and easy to understand.
Free with trial A minimalist flat style vector illustration showing a downward sloping line graph in red. Represents decline, decrease, loss, or negative trends. Useful for financial reports, business presentations, analytics dashboards, or economic charts indicating reduction, vector design Generative AI. Decrease charts vectors Flat style red line chart graph decline icon vector design Generative AI. A minimalist flat style vector illustration showing a downward sloping line graph in. A minimalist flat style vector illustration showing a downward sloping line graph in red. Represents decline, decrease, loss, or negative trends. Useful for financial reports, business presentations, analytics dashboards, or economic charts indicating reduction, vector design Generative AI
Free with trial Two black and white icons representing declining trends. On the left, stacked blocks decrease in height from left to right, with a downward arrow pointing from top left to bottom right. On the right, a bar chart with four bars of decreasing height features a similar downward-pointing arrow. Both images symbolize a decrease or downward trend, often used in financial, business, or data analysis contexts to indicate a reduction or loss. Decrease charts illustrations Declining business performance graphic stacked and standard bar charts. Two black and white icons representing declining trends. On the left, stacked blocks. Two black and white icons representing declining trends. On the left, stacked blocks decrease in height from left to right, with a downward arrow pointing from top left to bottom right. On the right, a bar chart with four bars of decreasing height features a similar downward-pointing arrow. Both images symbolize a decrease or downward trend, often used in financial, business, or data analysis contexts to indicate a reduction or loss.
Free with trial A grey downward curving arrow path icon, symbolizing decline, decrease, or a negative trend. Useful for financial charts, statistical graphs, and illustrating downward movements in data, vector design Generative AI. Decrease charts vectors Downward Curving Arrow Path for Decline, vector design Generative AI. A grey downward curving arrow path icon, symbolizing decline, decrease, or a negative trend. A grey downward curving arrow path icon, symbolizing decline, decrease, or a negative trend. Useful for financial charts, statistical graphs, and illustrating downward movements in data, vector design Generative AI
Free with trial Global finance data analysis on keyboard with charts, stunning background Generative AI. Decrease charts illustrations Global finance data analysis on keyboard with charts. Stunning background Generative AI
Free with trial Global economic recession graph with red falling charts on world map background. Conceptual illustration of financial crisis, stock market crash, and economic downturn featuring downward red arrow and bearish candlestick charts. Perfect for business news, financial risk reporting, and economic crisis blogs. Decrease charts illustrations Global economic recession graph with red falling charts on world map. Background. Conceptual illustration of financial crisis, stock market crash, and economic. Global economic recession graph with red falling charts on world map background. Conceptual illustration of financial crisis, stock market crash, and economic downturn featuring downward red arrow and bearish candlestick charts. Perfect for business news, financial risk reporting, and economic crisis blogs.
Free with trial A simple flat style vector illustration of a red arrow pointing downwards. Represents download, decrease, bottom, or direction. Useful for user interfaces, charts, reports, or directional signage graphics, vector design Generative AI. Decrease charts vectors Flat style red arrow point down indicator icon vector design Generative AI. A simple flat style vector illustration of a red arrow pointing downwards. Represents. A simple flat style vector illustration of a red arrow pointing downwards. Represents download, decrease, bottom, or direction. Useful for user interfaces, charts, reports, or directional signage graphics, vector design Generative AI
Free with trial Comprehensive data visualization with global charts and interactive graphs. Decrease charts illustrations Comprehensive data visualization with global charts and interactive graphs.
Free with trial Global oil prices charts showing significant spikes and falls, reflecting market volatility. Decrease charts illustrations Global oil prices charts showing significant spikes and falls. Reflecting market volatility
Free with trial Analyzing Financial Data with Glowing Charts and Vibrant Color Bokeh Effect , colorful theme. Decrease charts illustrations Analyzing Financial Data with Glowing Charts and Vibrant Color Bokeh Effect. Colorful theme
Free with trial A collection of icons featuring increase and decrease symbols in various styles, ideal for financial and business presentations. On white background. Decrease charts vectors A collection of icons featuring increase and decrease symbols in various styles, ideal for financial and business presentations. On white background
Free with trial Business Data Analysis Charts Graphs People Teamwork, isolated on white background. Decrease charts illustrations Business Data Analysis Charts Graphs People Teamwork, isolated on white background.
Free with trial Comprehensive data visualization, graphs and charts on a computer monitor for trend analysis reporting ,Generative AI. Decrease charts illustrations Comprehensive data visualization, graphs and charts on a computer monitor for trend analysis reporting. Generative AI
Free with trial Man in a beige shirt and jeans holding a paper with charts, isolated yellow background. AI-generated. Decrease charts illustrations Hands holding a paper with financial business charts, yellow background. Man in a beige shirt and jeans holding a paper with charts, isolated yellow background. Man in a beige shirt and jeans holding a paper with charts, isolated yellow background. AI-generated
Free with trial A hand interacts with luminous digital charts and graphs representing financial data. The scene conveys trends and growth in a modern business context. Scalp. Decrease charts illustrations Hand Interacting with Digital Charts and Graphs Displaying Financial Data in a Dark Background with Global Map for. A hand interacts with luminous digital charts. A hand interacts with luminous digital charts and graphs representing financial data. The scene conveys trends and growth in a modern business context. Scalp
Free with trial Black icons showing business growth and decline bar charts with arrows. Financial statistics, market trends, profit, loss, and analytics. Decrease charts vectors Business growth and decline bar charts, financial profit, loss, market trend analytics icons. Black icons showing business growth and decline bar charts with. Black icons showing business growth and decline bar charts with arrows. Financial statistics, market trends, profit, loss, and analytics
Free with trial A businessman looking at financial charts on screen, dark background, cinematic lighting, success concept. Decrease charts illustrations A businessman looking at financial charts on screen, dark background, cinematic lighting, success concept.
Free with trial Outline vector icon of a line graph showing a downward trend in line art. Represents decrease, loss, decline, or negative performance data. Suitable for financial charts, reports, data visualization, and illustrating negative changes over time, vector design Generative AI. Decrease charts vectors Line Graph Downward Trend Outline, Decline Loss Chart Symbol, vector design Generative AI. Outline vector icon of a line graph showing a downward trend in line. Outline vector icon of a line graph showing a downward trend in line art. Represents decrease, loss, decline, or negative performance data. Suitable for financial charts, reports, data visualization, and illustrating negative changes over time, vector design Generative AI
Free with trial Data charts and tables illustration sales bar, colorful categories, figures trends data charts and tables. Decrease charts illustrations Data charts and tables. Illustration sales bar, colorful categories, figures trends AI generated. data charts and tables illustration sales bar, colorful categories, figures trends data charts and tables
Free with trial A striking image depicting a large red arrow pointing downwards dramatically superimposed on a stack of financial reports and charts This powerful visual metaphor represents a market downturn or economic crisis Ideal for illustrating articles or presentations on financial instability. Decrease charts illustrations Financial Crisis Concept Red Arrow Falling on Stock Market Reports and Charts AI generated. A striking image depicting a large red arrow pointing downwards. A striking image depicting a large red arrow pointing downwards dramatically superimposed on a stack of financial reports and charts This powerful visual metaphor represents a market downturn or economic crisis Ideal for illustrating articles or presentations on financial instability
Free with trial This image was created using Generative AI. Set of black arrows pointing up and down with percent signs symbolizing percentage increase and decrease. Simple icon design suitable for business charts and financial reports. Decrease charts vectors Black percentage increase and decrease arrows with percent sign icon isolated on white background for financial data. This image was created using Generative AI. This image was created using Generative AI. Set of black arrows pointing up and down with percent signs symbolizing percentage increase and decrease. Simple icon design suitable for business charts and financial reports
Free with trial Collection of icons showing different types of charts graphs and data analysis tools isolated on transparent background. Decrease charts vectors Set of various icons representing business data analysis and statistics with charts and graphs. Collection of icons showing different types of charts graphs and. Collection of icons showing different types of charts graphs and data analysis tools isolated on transparent background
Free with trial A grid of thin line icons illustrating business growth and financial concepts, featuring charts, graphs, money symbols, and people. Decrease charts illustrations Business Growth and Financial Analytics Icon Collection with Charts and Money Keywords: business, growth, finance, analytics,. A grid of thin line icons. A grid of thin line icons illustrating business growth and financial concepts, featuring charts, graphs, money symbols, and people
Free with trial Financial graphs and charts with red and white design elements, displayed on an isolated white background. Concept of declining business performance. 3D Rendering. Decrease charts illustrations Financial graphs and charts showing a decline in performance. 3D Rendering. Financial graphs and charts with red and white design elements, displayed on an. Financial graphs and charts with red and white design elements, displayed on an isolated white background. Concept of declining business performance. 3D Rendering
Free with trial This cheerful 3D rendered illustration depicts a friendly cartoon businessman confidently presenting positive business growth charts and data, showcasing key performance indicators and financial success. The image is ideal for business, finance, and marketing concepts. Decrease charts illustrations Charming 3D Cartoon Businessman Presenting Growth Charts and Data. This cheerful 3D rendered illustration depicts a friendly cartoon businessman confidently. This cheerful 3D rendered illustration depicts a friendly cartoon businessman confidently presenting positive business growth charts and data, showcasing key performance indicators and financial success. The image is ideal for business, finance, and marketing concepts.
Free with trial A businessperson looking at declining financial charts during. A recession. Decrease charts illustrations A businessperson looking at declining financial charts during. A recession
Free with trial Set of icons featuring different types of charts and graphs used for data analysis and business growth isolated on transparent background. Decrease charts vectors Collection of various icons representing data analysis and business growth with charts and graphs. Set of icons featuring different types of charts and graphs. Set of icons featuring different types of charts and graphs used for data analysis and business growth isolated on transparent background
Free with trial A set of black and white icons representing different types of business and financial charts including bar graphs line graphs and pie charts. Decrease charts vectors Collection of various business and financial chart icons including bar graphs line graphs and pie charts. A set of black and white icons representing different. A set of black and white icons representing different types of business and financial charts including bar graphs line graphs and pie charts
Free with trial This infographic showcases a variety of graphs and charts, including bar graphs, line graphs, and pie charts, in a range of colors such as blue, green, and red. The image represents business data analysis, with arrows indicating growth, increase, and decrease trends. The infographic is a visual representation of market research, economy indicators, and metrics, making it a useful tool for business strategy and planning. Decrease charts vectors A colorful infographic featuring various graphs and charts to represent business data analysis. This infographic showcases a variety of graphs and charts. This infographic showcases a variety of graphs and charts, including bar graphs, line graphs, and pie charts, in a range of colors such as blue, green, and red. The image represents business data analysis, with arrows indicating growth, increase, and decrease trends. The infographic is a visual representation of market research, economy indicators, and metrics, making it a useful tool for business strategy and planning.
Free with trial A striking 3D rendering showcasing a red arrow dramatically plunging onto financial charts symbolizing economic downturn deflation and market instability The image effectively conveys concepts of financial risk and market decline. Decrease charts illustrations Red Arrow Falling on Financial Charts Showing Economic Downturn and Deflation Risk AI generated. A striking 3D rendering showcasing a red arrow dramatically. A striking 3D rendering showcasing a red arrow dramatically plunging onto financial charts symbolizing economic downturn deflation and market instability The image effectively conveys concepts of financial risk and market decline
 Sign in