Free with trial Declining bar chart with downward arrow graphic representing economic downturn and financial loss. Decrease financial trends vectors Declining bar chart with downward arrow graphic representing economic downturn and financial loss
Free with trial Red arrow pointing downward on a financial spreadsheet, magnifying glass focusing on economic decline. Concept for recession, market crash, business loss, and negative financial trends. Decrease financial trends illustrations Red arrow pointing downward on a financial spreadsheet, magnifying glass focusing on economic decline.
Free with trial A digital graphic with a percent symbols in red next to an American flag, depicting data or economic trends or tariffs. Decrease financial trends illustrations A digital graphic with a percent symbols in red next to an American flag, depicting data or economic trends or tariffs
Free with trial Modern timeline candles are moving down with no resistance. 12 month financial statistics graph with business calendar Fear of down markets and down trends. Decrease financial trends vectors Modern timeline candles are moving down with no resistance
Free with trial Gas pump nozzle next to stock market graph illustrating fuel price trends in realistic photography, Generated by AI. Decrease financial trends illustrations Gas pump nozzle next to stock market graph illustrating fuel price trends in realistic photography
Free with trial This image shows the concept of financial loss and gain with red and green dollar coins and arrows. It represents market trends and economic fluctuations. Decrease financial trends vectors Vector art of red and green dollar coins with arrows pointing up and down isolated on white background. This image shows the concept of financial loss and gain with red and green dollar coins and arrows. It represents market trends and economic fluctuations
Free with trial A vibrant bar graph illustrates a market downturn, symbolizing economic trends, financial instability, risk assessment, and potential recovery. It uses a rainbow color scheme for visual impact. Ideal for promoting your services or creating eye-catching visuals. Open area for featuring your products, copy space, banner, advertisement. . Generative AI. Decrease financial trends illustrations Colorful Bar Graph Showing Market Decline A vibrant bar graph illustrates a market downturn symbolizing economic trends. A vibrant bar graph illustrates a market downturn, symbolizing economic trends, financial instability, risk assessment, and potential recovery. It uses a rainbow color scheme for visual impact. Ideal for promoting your services or creating eye-catching visuals. Open area for featuring your products, copy space, banner, advertisement. . Generative AI
Free with trial Business Analytics And Data Visualization Line Icon Set. Financial Growth, Market Trends, And Performance Analysis Outline Symbol Collection. Editable Stroke. Isolated Vector Illustration. Decrease financial trends vectors Business Analytics And Data Visualization Line Icon Set. Financial Growth, Market Trends, And Performance Analysis
Free with trial Person holds smartphone displaying stock market charts. Person reviews financial data. Stock market trading in progress, on computer monitor. Person analyses market trends. Person. Decrease financial trends illustrations Person holds smartphone displaying stock market charts. Person reviews financial data. Stock market trading in progress on. Person holds smartphone displaying stock market charts. Person reviews financial data. Stock market trading in progress, on computer monitor. Person analyses market trends. Person.
Free with trial Concept of falling interest rates, showing a descending graph and coins dropping, illustrating economic impact and financial trends. Decrease financial trends illustrations Falling Interest Rates with Graph and Coins Symbolizing Impact. Concept of falling interest rates, showing a descending graph and coins dropping, illustrating economic impact and financial trends
Free with trial Concept of falling interest rates, showing a descending graph and coins dropping, illustrating economic impact and financial trends. Decrease financial trends illustrations Falling Interest Rates with Graph and Coins Symbolizing Impact. Concept of falling interest rates, showing a descending graph and coins dropping, illustrating economic impact and financial trends
Free with trial Concept of falling interest rates, showing a descending graph and coins dropping, illustrating economic impact and financial trends. Decrease financial trends illustrations Falling Interest Rates with Graph and Coins Symbolizing Impact. Concept of falling interest rates, showing a descending graph and coins dropping, illustrating economic impact and financial trends
Free with trial Concept of falling interest rates, showing a descending graph and coins dropping, illustrating economic impact and financial trends. Decrease financial trends illustrations Falling Interest Rates with Graph and Coins Symbolizing Impact. Concept of falling interest rates, showing a descending graph and coins dropping, illustrating economic impact and financial trends
Free with trial A bold red arrow sharply declines in a zigzag pattern, symbolizing a steep drop in performance or value. This visual powerfully conveys financial loss, economic downturn, or negative trends. Decrease financial trends illustrations Red arrow descending sharp decline downward trend graph represents financial loss economic downturn. A bold red arrow sharply declines in a zigzag pattern, symbolizing a steep drop in performance or value. This visual powerfully conveys financial loss, economic downturn, or negative trends
Free with trial A visual representation of india's economic downturn, showing a declining graph and financial crisis. it highlights the business decline and recession impacting the nation's economy and market trends. Decrease financial trends illustrations Understanding india economic recession and financial crisis with falling graph and business decline chart. a visual representation of india's economic downturn, showing a declining graph and financial crisis. it highlights the business decline and recession impacting the nation's economy and market trends.
Free with trial This comprehensive analysis explores the current downturn in the housing market, examining the factors driving falling house prices. We delve into the interconnectedness of real estate trends with broader economic indicators, including interest rates, inflation, and potential recessionary periods. The report visually depicts the negative trajectory of property values, highlighting the. Decrease financial trends illustrations Falling House Prices Analyzing Market Trends Impacts and Economic Forecasts for the Real Estate Sector. This comprehensive analysis explores the current downturn in the housing market, examining the factors driving falling house prices. We delve into the interconnectedness of real estate trends with broader economic indicators, including interest rates, inflation, and potential recessionary periods. The report visually depicts the negative trajectory of property values, highlighting the
Free with trial This image features six black bar chart icons with red and green arrows showing increase, decrease, and uncertainty trends. It is a clear, simple vector for business or data visuals, informative and clean. Generative AI. Decrease financial trends vectors Set of six vector bar chart icons with arrows indicating trends and question mark in black and colored design elements. This image features six black bar chart. This image features six black bar chart icons with red and green arrows showing increase, decrease, and uncertainty trends. It is a clear, simple vector for business or data visuals, informative and clean. Generative AI
Free with trial Global inflation trends displayed on multiple digital screens. Macroeconomic research paper on screens shows worldwide inflation data. Charts graphs illustrate global economic. Decrease financial trends illustrations Global inflation trends displayed on multiple digital screens. Macroeconomic research paper on screens shows worldwide inflation
Free with trial Money bag labeled Inflation, red upward graph suggests rising financial trends Generative AI. Decrease financial trends illustrations Money bag labeled Inflation, red upward graph suggests rising financial trends
Free with trial A red bar chart against a dark background showing a significant stock market decline. The image suggests financial crisis, risk, and economic downturn, suitable for business and financial related content. Decrease financial trends illustrations Red Stock Market Chart Plunging During Financial Crisis with dark background illustrating sharp decline. A red bar chart against a dark background showing a significant stock market decline. The image suggests financial crisis, risk, and economic downturn, suitable for business and financial related content
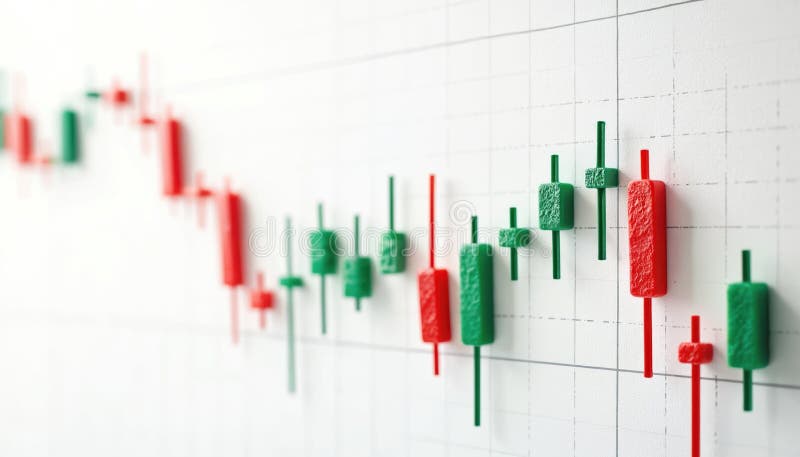
Free with trial Candlestick chart shows stock market fluctuations. Green candles show price increase, red candles pointing price decrease. Financial diagram of investment chart shows up down trends. Decrease financial trends illustrations Candlestick chart shows stock market fluctuations. Green candles show price increase, red candles pointing price decrease.
Free with trial Declining Bar Chart: Representing Loss, Reduction, and Negative Trends with a Downward-Pointing Arrow Graphic. Decrease financial trends vectors Declining Bar Chart: Representing Loss, Reduction, and Negative Trends with a Downward-Pointing Arrow Graphic
Free with trial A dramatic image depicting a significant decline in the Chinese economy. The Chinese flag overlays a nighttime Shanghai skyline, with a large red arrow dramatically pointing downwards, superimposed on a falling stock market graph. This image is ideal for illustrating economic news, financial reports, and articles about market volatility and global economic trends. Decrease financial trends illustrations China Economic Downturn: Stock Market Crash and Shanghai Skyline. A dramatic image depicting a significant decline in the Chinese economy. The Chinese flag overlays a nighttime Shanghai skyline, with a large red arrow dramatically pointing downwards, superimposed on a falling stock market graph. This image is ideal for illustrating economic news, financial reports, and articles about market volatility and global economic trends.
Free with trial Descending Graph Depicts a Clear Downward Trend in Business Financial Analysis and Loss Indicating Recession. Decrease financial trends vectors Descending Graph Depicts a Clear Downward Trend in Business Financial Analysis and Loss Indicating Recession
Free with trial 3D render of red and white candlestick chart with percentage symbols, symbolizing financial market analysis, stock trading, cryptocurrency, and investment trends in a modern style. Decrease financial trends illustrations 3D render of red and white candlestick chart with percentage symbols, symbolizing financial market analysis, stock trading
Free with trial A compilation of minimalist line art icons visually representing various financial concepts, including upward and downward market trends, investment growth, and economic indicators. Decrease financial trends vectors Collection of line art icons representing financial growth and market trends, isolated on transparent background. A compilation of minimalist line art icons visually representing various financial concepts, including upward and downward market trends, investment growth, and economic indicators
Free with trial A visual representation of a financial downturn. The red graph and arrows symbolize market decline, economic recession, and potential business failure, highlighting investment risks and negative trends. Decrease financial trends illustrations Red graph chart falling down financial crisis stock market crash economic recession business failure concept. A visual representation of a financial downturn. The red graph and arrows symbolize market decline, economic recession, and potential business failure, highlighting investment risks and negative trends.
Free with trial A bar graph showing a downward trend, with red and blue bars against a dark background. it represents a financial downturn, economic recession, or stock market crash. data analysis is key to understanding the trends. Decrease financial trends illustrations Stock market crash graph downtrend chart financial crisis economic recession business failure investment loss. a bar graph showing a downward trend, with red and blue bars against a dark background. it represents a financial downturn, economic recession, or stock market crash. data analysis is key to understanding the trends
Free with trial A dynamic stock market chart against a blurred city skyline, symbolizing financial growth and investment opportunities. it represents the intersection of urban finance and economic trends, showcasing potential. Decrease financial trends illustrations Stock market analysis chart with city skyline background for financial investment growth concept. a dynamic stock market chart against a blurred city skyline, symbolizing financial growth and investment opportunities. it represents the intersection of urban finance and economic trends, showcasing potential.
Free with trial Market trend icon in comic style. Decline arrow with magnifier cartoon vector illustration on isolated background. Decrease splash effect business concept. Decrease financial trends vectors Market trend icon in comic style. Decline arrow with magnifier cartoon vector illustration on isolated background. Decrease splash
Free with trial Hand interacting with a declining chart, symbolizing market trends and financial analysis ,Generative ai. Decrease financial trends illustrations Declining chart and hand interaction, visualizing market trends financial analysis for strategic decisionmaking. Hand interacting with a declining chart, symbolizing market trends and financial analysis ,Generative ai
Free with trial House model on gold coins, represents real estate investment. Concept illustrates decreasing interest rates impact on house price. Financial, banking, market trends, property value. Decrease financial trends illustrations House model on gold coins, represents real estate investment. Concept illustrates decreasing interest rates impact on house
Free with trial Witness the dynamic energy of the modern financial world in this captivating image. A digital display showcases a thriving stock market, complete with upward trends in financial charts and a stack of coins symbolizing wealth accumulation. The computer screen, the central focus, displays a complex array of financial graphs, highlighting market fluctuations and growth indicators. This visual. Decrease financial trends illustrations Stock Market Growth A Thriving Investment Landscape Visualized on a Computer Screen with Stacked Coins Charts and. Witness the dynamic energy of the modern financial world in this captivating image. A digital display showcases a thriving stock market, complete with upward trends in financial charts and a stack of coins symbolizing wealth accumulation. The computer screen, the central focus, displays a complex array of financial graphs, highlighting market fluctuations and growth indicators. This visual
Free with trial A captivating stock market analysis chart that visualizes financial data and business growth. The blue background enhances the modern design, perfect for illustrating investment trends and economic reports. Decrease financial trends illustrations Stock market analysis chart financial data graph business investment growth blue background vector illustration. a captivating stock market analysis chart that visualizes financial data and business growth. The blue background enhances the modern design, perfect for illustrating investment trends and economic reports.
Free with trial Real estate market analysis. Graphical representation of property value trends, growth patterns. Small house model with increasing bar chart in front of financial data diagram. Decrease financial trends illustrations Real estate market analysis. Graphical representation of property value trends, growth patterns. Small house model with
Free with trial A man sitting under a downward arrow surrounded by financial icons, symbolizing economic downturn, crisis, financial loss, and challenges in personal or business finance. Decrease financial trends vectors Man Sitting Under Downward Arrow Symbolizing Financial Loss, Crisis, And Economic Challenges, Flat Vector Illustration. A man sitting under a downward arrow surrounded by financial icons, symbolizing economic downturn, crisis, financial loss, and challenges in personal or business finance.
Free with trial A digital hand displays an illuminated financial growth graph with various statistics against a dark city backdrop, emphasizing technology in data analysis and investment trends. Scalp. Decrease financial trends illustrations Digital hand presenting glowing financial growth graph with statistics and global connectivity showcasing data analytics. A digital hand displays an illuminated financial growth graph with various statistics against a dark city backdrop, emphasizing technology in data analysis and investment trends. Scalp
Free with trial Red wooden arrow points down on yellow background. Business, market decline. Indicates economic recession, financial loss, investment risk. Shows negative trends, bankruptcy. Useful for. Decrease financial trends illustrations Red wooden arrow points down on yellow background. Business, market decline. Indicates economic recession, financial loss
Free with trial White sugar cubes pile up on dark surface. Blurry financial stock market chart with red green candlestick lines appears in background. Image commodity prices market trends, global. Decrease financial trends illustrations White sugar cubes pile up on dark surface. Blurry financial stock market chart with red green candlestick lines appears in
Free with trial Miniature shopping cart with red upward trending arrow declining retail sales, negative economic trends. Conceptual image represents falling consumer spending, market downturn financial. Decrease financial trends illustrations Miniature shopping cart with red upward trending arrow declining retail sales, negative economic trends. Conceptual image
Free with trial Person using smartphone for stock trading. Mobile phone displays financial data charts. Hands actively interact with screen. Market trends shown in background. Businessman investor. Decrease financial trends illustrations Person using smartphone for stock trading. Mobile phone displays financial data, charts. Hands actively interact with screen. Person using smartphone for stock trading. Mobile phone displays financial data charts. Hands actively interact with screen. Market trends shown in background. Businessman investor.
Free with trial A glowing red zigzag arrow points downward, representing a decline on a digital financial chart. The surface is gridded and dark, highlighting the red of the arrow. The arrow has a neon-like appearance and reflects off the glossy surface, signaling a decrease in value. The surrounding chart includes descending graphical elements indicating fluctuating data, conveying a downturn in financial performance or market trends. Decrease financial trends illustrations A large red arrow points downwards over a gridded financial chart showing a sharp decline in value. A glowing red zigzag arrow points downward, representing a decline on a digital financial chart. The surface is gridded and dark, highlighting the red of the arrow. The arrow has a neon-like appearance and reflects off the glossy surface, signaling a decrease in value. The surrounding chart includes descending graphical elements indicating fluctuating data, conveying a downturn in financial performance or market trends.
Free with trial A glowing red zigzag arrow points downward, representing a decline on a digital financial chart. The surface is gridded and dark, highlighting the red of the arrow. The arrow has a neon-like appearance and reflects off the glossy surface, signaling a decrease in value. The surrounding chart includes descending graphical elements indicating fluctuating data, conveying a downturn in financial performance or market trends. Decrease financial trends illustrations A large red arrow points downwards over a gridded financial chart showing a sharp decline in value. A glowing red zigzag arrow points downward, representing a decline on a digital financial chart. The surface is gridded and dark, highlighting the red of the arrow. The arrow has a neon-like appearance and reflects off the glossy surface, signaling a decrease in value. The surrounding chart includes descending graphical elements indicating fluctuating data, conveying a downturn in financial performance or market trends.
Free with trial A glowing red zigzag arrow points downward, representing a decline on a digital financial chart. The surface is gridded and dark, highlighting the red of the arrow. The arrow has a neon-like appearance and reflects off the glossy surface, signaling a decrease in value. The surrounding chart includes descending graphical elements indicating fluctuating data, conveying a downturn in financial performance or market trends. Decrease financial trends illustrations A large red arrow points downwards over a gridded financial chart showing a sharp decline in value. A glowing red zigzag arrow points downward, representing a decline on a digital financial chart. The surface is gridded and dark, highlighting the red of the arrow. The arrow has a neon-like appearance and reflects off the glossy surface, signaling a decrease in value. The surrounding chart includes descending graphical elements indicating fluctuating data, conveying a downturn in financial performance or market trends.
Free with trial A glowing red zigzag arrow points downward, representing a decline on a digital financial chart. The surface is gridded and dark, highlighting the red of the arrow. The arrow has a neon-like appearance and reflects off the glossy surface, signaling a decrease in value. The surrounding chart includes descending graphical elements indicating fluctuating data, conveying a downturn in financial performance or market trends. Decrease financial trends illustrations A large red arrow points downwards over a gridded financial chart showing a sharp decline in value. A glowing red zigzag arrow points downward, representing a decline on a digital financial chart. The surface is gridded and dark, highlighting the red of the arrow. The arrow has a neon-like appearance and reflects off the glossy surface, signaling a decrease in value. The surrounding chart includes descending graphical elements indicating fluctuating data, conveying a downturn in financial performance or market trends.
Free with trial A glowing red zigzag arrow points downward, representing a decline on a digital financial chart. The surface is gridded and dark, highlighting the red of the arrow. The arrow has a neon-like appearance and reflects off the glossy surface, signaling a decrease in value. The surrounding chart includes descending graphical elements indicating fluctuating data, conveying a downturn in financial performance or market trends. Decrease financial trends illustrations A large red arrow points downwards over a gridded financial chart showing a sharp decline in value. A glowing red zigzag arrow points downward, representing a decline on a digital financial chart. The surface is gridded and dark, highlighting the red of the arrow. The arrow has a neon-like appearance and reflects off the glossy surface, signaling a decrease in value. The surrounding chart includes descending graphical elements indicating fluctuating data, conveying a downturn in financial performance or market trends.
Free with trial Red arrow pointing downward on a financial spreadsheet, magnifying glass focusing on economic decline. Concept for recession, market crash, business loss, and negative financial trends. Decrease financial trends illustrations Red arrow pointing downward on a financial spreadsheet, magnifying glass focusing on economic decline.
Free with trial Red arrow pointing downward on a financial spreadsheet, magnifying glass focusing on economic decline. Concept for recession, market crash, business loss, and negative financial trends. Decrease financial trends illustrations Red arrow pointing downward on a financial spreadsheet, magnifying glass focusing on economic decline.
Free with trial Red arrow pointing downward on a financial spreadsheet, magnifying glass focusing on economic decline. Concept for recession, market crash, business loss, and negative financial trends. Decrease financial trends illustrations Red arrow pointing downward on a financial spreadsheet, magnifying glass focusing on economic decline.
Free with trial Red arrow pointing downward on a financial spreadsheet, magnifying glass focusing on economic decline. Concept for recession, market crash, business loss, and negative financial trends. Decrease financial trends illustrations Red arrow pointing downward on a financial spreadsheet, magnifying glass focusing on economic decline.
Free with trial Red arrow pointing downward on a financial spreadsheet, magnifying glass focusing on economic decline. Concept for recession, market crash, business loss, and negative financial trends. Decrease financial trends illustrations Red arrow pointing downward on a financial spreadsheet, magnifying glass focusing on economic decline.
Free with trial Red arrow pointing downward on a financial spreadsheet, magnifying glass focusing on economic decline. Concept for recession, market crash, business loss, and negative financial trends. Decrease financial trends illustrations Red arrow pointing downward on a financial spreadsheet, magnifying glass focusing on economic decline.
Free with trial Red arrow pointing downward on a financial spreadsheet, magnifying glass focusing on economic decline. Concept for recession, market crash, business loss, and negative financial trends. Decrease financial trends illustrations Red arrow pointing downward on a financial spreadsheet, magnifying glass focusing on economic decline.
Free with trial Red arrow pointing downward on a financial spreadsheet, magnifying glass focusing on economic decline. Concept for recession, market crash, business loss, and negative financial trends. Decrease financial trends illustrations Red arrow pointing downward on a financial spreadsheet, magnifying glass focusing on economic decline.
Free with trial Red arrow pointing downward on a financial spreadsheet, magnifying glass focusing on economic decline. Concept for recession, market crash, business loss, and negative financial trends. Decrease financial trends illustrations Red arrow pointing downward on a financial spreadsheet, magnifying glass focusing on economic decline.
Free with trial This AI-generated image depicts a calculator displaying "TAX-2025" alongside a bar graph, illustrating potential tax revenue projections for the year. The graph, generated by AI, shows a projected decrease in tax revenue over time. This visualization is helpful for financial planning and forecastin. Decrease financial trends illustrations Tax Projections 2025. This AI-generated image depicts a calculator displaying "TAX-2025" alongside a bar graph, illustrating potential tax revenue projections for the year. The graph, generated by AI, shows a projected decrease in tax revenue over time. This visualization is helpful for financial planning and forecastin
Free with trial Illustrates a stock market crash with declining graphs and red arrows. Represents economic downturn, financial crisis, and recession. Symbolizes loss, risk, and negative trends in business. Decrease financial trends illustrations Stock market crash financial crisis recession economic downturn red arrow graph chart diagram decline 2024. Illustrates a stock market crash with declining graphs and red arrows. Represents economic downturn, financial crisis, and recession. Symbolizes loss, risk, and negative trends in business.
Free with trial A digital graphic with a percent symbols in red next to an American flag, depicting data or economic trends or tariffs. Decrease financial trends illustrations A digital graphic with a percent symbols in red next to an American flag, depicting data or economic trends or tariffs
Free with trial A digital graphic with a percent symbols in red next to an American flag, depicting data or economic trends or tariffs. Decrease financial trends illustrations A digital graphic with a percent symbols in red next to an American flag, depicting data or economic trends or tariffs
Free with trial A digital graphic with a percent symbols in red next to an American flag, depicting data or economic trends or tariffs. Decrease financial trends illustrations A digital graphic with a percent symbols in red next to an American flag, depicting data or economic trends or tariffs
Free with trial The flag of UK with declining stock market graph and financial data overlay, symbolizing economic downturn, recession, or bearish market trends. Decrease financial trends illustrations The flag of UK with declining stock market graph and financial data overlay
Free with trial The flag of UAE with declining stock market graph and financial data overlay, symbolizing economic downturn, recession, or bearish market trends. Decrease financial trends illustrations The flag of UAE with declining stock market graph and financial data overlay
Free with trial The flag of USA with declining stock market graph and financial data overlay, symbolizing economic downturn, recession, or bearish market trends. Decrease financial trends illustrations The flag of USA with declining stock market graph and financial data overlay
Free with trial The flag of Oman with declining stock market graph and financial data overlay, symbolizing economic downturn, recession, or bearish market trends. Decrease financial trends illustrations The flag of Oman with declining stock market graph and financial data overlay
Free with trial The flag of Laos with declining stock market graph and financial data overlay, symbolizing economic downturn, recession, or bearish market trends. Decrease financial trends illustrations The flag of Laos with declining stock market graph and financial data overlay
Free with trial The flag of Mali with declining stock market graph and financial data overlay, symbolizing economic downturn, recession, or bearish market trends. Decrease financial trends illustrations The flag of Mali with declining stock market graph and financial data overlay
Free with trial The flag of Chad with declining stock market graph and financial data overlay, symbolizing economic downturn, recession, or bearish market trends. Decrease financial trends illustrations The flag of Chad with declining stock market graph and financial data overlay
Free with trial The flag of Cuba with declining stock market graph and financial data overlay, symbolizing economic downturn, recession, or bearish market trends. Decrease financial trends illustrations The flag of Cuba with declining stock market graph and financial data overlay
Free with trial The flag of Yemen with declining stock market graph and financial data overlay, symbolizing economic downturn, recession, or bearish market trends. Decrease financial trends illustrations The flag of Yemen with declining stock market graph and financial data overlay
Free with trial The flag of Benin with declining stock market graph and financial data overlay, symbolizing economic downturn, recession, or bearish market trends. Decrease financial trends illustrations The flag of Benin with declining stock market graph and financial data overlay
Free with trial The flag of Libya with declining stock market graph and financial data overlay, symbolizing economic downturn, recession, or bearish market trends. Decrease financial trends illustrations The flag of Libya with declining stock market graph and financial data overlay
Free with trial The flag of Malta with declining stock market graph and financial data overlay, symbolizing economic downturn, recession, or bearish market trends. Decrease financial trends illustrations The flag of Malta with declining stock market graph and financial data overlay
Free with trial The flag of Iraq with declining stock market graph and financial data overlay, symbolizing economic downturn, recession, or bearish market trends. Decrease financial trends illustrations The flag of Iraq with declining stock market graph and financial data overlay
Free with trial The flag of Iran with declining stock market graph and financial data overlay, symbolizing economic downturn, recession, or bearish market trends. Decrease financial trends illustrations The flag of Iran with declining stock market graph and financial data overlay
Free with trial The flag of Gabon with declining stock market graph and financial data overlay, symbolizing economic downturn, recession, or bearish market trends. Decrease financial trends illustrations The flag of Gabon with declining stock market graph and financial data overlay
Free with trial The flag of Kenya with declining stock market graph and financial data overlay, symbolizing economic downturn, recession, or bearish market trends. Decrease financial trends illustrations The flag of Kenya with declining stock market graph and financial data overlay
Free with trial The flag of Italy with declining stock market graph and financial data overlay, symbolizing economic downturn, recession, or bearish market trends. Decrease financial trends illustrations The flag of Italy with declining stock market graph and financial data overlay
Free with trial The flag of Japan with declining stock market graph and financial data overlay, symbolizing economic downturn, recession, or bearish market trends. Decrease financial trends illustrations The flag of Japan with declining stock market graph and financial data overlay
Free with trial The flag of Chile with declining stock market graph and financial data overlay, symbolizing economic downturn, recession, or bearish market trends. Decrease financial trends illustrations The flag of Chile with declining stock market graph and financial data overlay
Free with trial The flag of Ghana with declining stock market graph and financial data overlay, symbolizing economic downturn, recession, or bearish market trends. Decrease financial trends illustrations The flag of Ghana with declining stock market graph and financial data overlay