Free with trial A red financial graph with a descending trend indicates a stock market decline and bearish trends. The digital chart displays negative data, symbolizing loss and potential economic crisis. Decrease financial trends illustrations Red Stock Market Financial Graph Demonstrating Bearish Market Decline and Negative Trends. A red financial graph with a descending trend indicates a stock market decline and bearish trends. The digital chart displays negative data, symbolizing loss and potential economic crisis
Free with trial A vibrant pink 3D bar chart illustrates financial data with a prominent downward-trending arrow superimposed. The bars decrease in height from left to right, signifying a decline. An upward-pointing arrow is positioned at the top left, indicating a contrasting upward trend. The graphic is isolated on a white background, making it suitable for presentations on financial performance, market trends,. Decrease financial trends illustrations 3D Pink Bar Chart with Downward Trend Arrow and Upward Trend Arrow graph statistics. A vibrant pink 3D bar chart illustrates financial data with a prominent downward-trending arrow superimposed. The bars decrease in height from left to right, signifying a decline. An upward-pointing arrow is positioned at the top left, indicating a contrasting upward trend. The graphic is isolated on a white background, making it suitable for presentations on financial performance, market trends,
Free with trial Set of circular dollar currency icons with up and down arrows representing profit, loss, exchange and rate changes flat and glyph styles in black, red and green for business and finance use. Decrease financial trends vectors Money Currency Icons With Up And Down Arrows Showing Increase And Decrease Financial Trends. Set of circular dollar currency icons with up and down arrows representing profit, loss, exchange and rate changes flat and glyph styles in black, red and green for business and finance use.
Free with trial This 3D rendering showcases a vibrant bar chart illustrating business growth and financial performance. The colorful cylinders represent data points, rising to show increasing success. A line graph adds additional information about trends over time. Decrease financial trends illustrations Colorful 3D Bar Chart with Growth Graph Showing Business Success and Financial Data. This 3D rendering showcases a vibrant bar chart illustrating business growth and financial performance. The colorful cylinders represent data points, rising to show increasing success. A line graph adds additional information about trends over time.
Free with trial A close-up shot of a screen displaying a red financial graph with declining trends, indicating a bearish stock market. The chart shows decreasing value, suggesting potential losses and market downturn. Decrease financial trends illustrations Red Financial Graph Displaying Stock Market Decline and Bearish Trading Trends on a Screen. A close-up shot of a screen displaying a red financial graph with declining trends, indicating a bearish stock market. The chart shows decreasing value, suggesting potential losses and market downturn
Free with trial A 3D rendered blue arrow points downwards, symbolizing a decrease or reduction. Adjacent to the arrow is a pink circular icon containing a white percentage symbol. The composition is set against a clean white background, suggesting a concept related to sales, discounts, price drops, or negative financial trends. Decrease financial trends illustrations Downward Arrow with Percentage Symbol on White Background decrease reduction. A 3D rendered blue arrow points downwards, symbolizing a decrease or reduction. Adjacent to the arrow is a pink circular icon containing a white percentage symbol. The composition is set against a clean white background, suggesting a concept related to sales, discounts, price drops, or negative financial trends
Free with trial Illuminated red financial chart depicting vibrant stock market trends, showcasing upward and downward movements. ideal for financial reports, analysis, and investment presentations in the stock market domain. Generative AI. Decrease financial trends illustrations Dynamic Red Financial Data Chart with Glowing Lights for Stock Market Analysis Generative AI. Illuminated red financial chart depicting vibrant stock market trends, showcasing upward and downward movements. ideal for financial reports, analysis, and investment presentations in the stock market domain. Generative AI
Free with trial Futuristic financial data visualization with graphs and charts showing growth and market trends. Decrease financial trends illustrations Futuristic financial data visualization with graphs and charts showing growth and market trends
Free with trial Exploring the Impact of Renewable Energy on Global Financial Markets and Technological Trends, Generated by AI. Decrease financial trends illustrations Exploring the Impact of Renewable Energy on Global Financial Markets and Technological Trends
Free with trial Silver coins with glowing financial market graphs showing upward green arrows and downward red arrows, indicating. Decrease financial trends illustrations Assortment of silver coins displaying financial market graphs with upward and downward trends. Silver coins with glowing financial market graphs showing upward green arrows and downward red arrows, indicating
Free with trial A business professional conducts a thorough analysis of financial data using a magnifying glass, illustrating market trends with graphs and charts on a digital interface. Scalp. Decrease financial trends illustrations Business Professional Analyzing Financial Data with a Magnifying Glass, Graphs, and Visual Representation of Market. A business professional conducts a thorough analysis of financial data using a magnifying glass, illustrating market trends with graphs and charts on a digital interface. Scalp
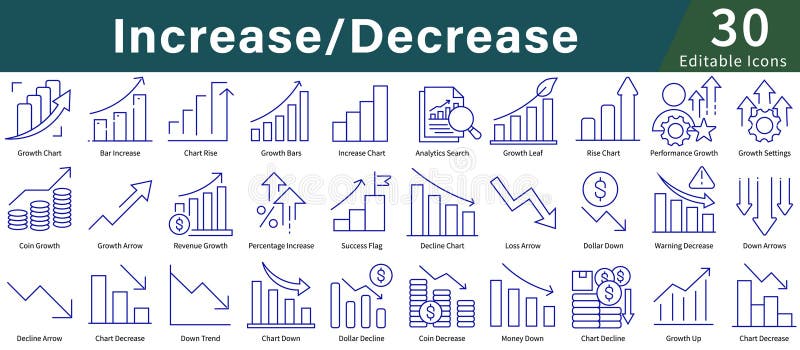
Free with trial Icons illustrating concepts of "Increase Decrease," using simple blue line art. Features include graphs and charts with upward and downward arrows, coins, dollar symbols, and percentage signs. Icons depict growth, decline, analytics, and performance tracking. Suitable for business, finance, or data analysis themes, these icons provide a visual representation of financial trends and statistics, making abstract concepts clear and easily understandable. The design is minimalistic and user-friendly, aimed at enhancing clarity in presentations and reports. Decrease financial trends vectors Increase Decrease Icon Set in Line Style with Editable Vector for Growth, Analytics, Charts, and Data Visualization. Icons illustrating concepts of "Increase Decrease," using simple blue line art. Features include graphs and charts with upward and downward arrows, coins, dollar symbols, and percentage signs. Icons depict growth, decline, analytics, and performance tracking. Suitable for business, finance, or data analysis themes, these icons provide a visual representation of financial trends and statistics, making abstract concepts clear and easily understandable. The design is minimalistic and user-friendly, aimed at enhancing clarity in presentations and reports.
Free with trial Description: A vibrant 3D rendering showcasing a bar chart with orange, blue, and yellow bars, representing upward financial trends or business growth. Ideal for presentations and reports. Decrease financial trends illustrations Colorful 3D Bar Chart: Business Growth and Financial Success. Description: A vibrant 3D rendering showcasing a bar chart with orange, blue, and yellow bars, representing upward financial trends or business growth. Ideal for presentations and reports.
Free with trial Hand interacting with blue chart, analyzing growth, trends, and financial performance data ,Generative ai. Decrease financial trends illustrations Hand analyzing blue chart, deciphering growth trends and financial performance for business success. Hand interacting with blue chart, analyzing growth, trends, and financial performance data ,Generative ai
Free with trial A glossy green arrow pointing downwards, emblazoned with a white percentage symbol, symbolizing decreasing prices, financial decline, sales reduction, and negative economic trends. Decrease financial trends illustrations Green downward arrow with percentage symbol indicating sales decrease and financial growth decline. A glossy green arrow pointing downwards, emblazoned with a white percentage symbol, symbolizing decreasing prices, financial decline, sales reduction, and negative economic trends
Free with trial Vibrant neon stock market graph showing financial data trends and analysis. Perfect for business, finance, and investment themes. Generative AI Illustration. Decrease financial trends illustrations Vibrant Neon Stock Market Graph Showing Financial Data Trends and Analysis. Generative AI Illustration. Vibrant neon stock market graph showing financial data trends and analysis. Perfect for business, finance, and investment themes. Generative AI Illustration
Free with trial Business person analyzes financial charts, market trends and investment strategies for economic growth ,Generative ai. Decrease financial trends illustrations Business person analyzes financial charts, market trends and investment strategies for economic growth
Free with trial A bear in a business suit sitting at a desk surrounded by stock market monitors displaying financial data, symbolizing bearish market trends and investment risks. Generative AI. Decrease financial trends illustrations A bear in a business suit sitting at a desk surrounded by stock market monitors displaying financial data, symbolizing bearish
Free with trial Bear market concept with a brown bear against a stock chart backdrop, symbolizing financial downturn and stock market trends, Generative AI. Decrease financial trends illustrations Bear market concept with a brown bear against a stock chart backdrop, symbolizing financial downturn and stock market trends
Free with trial Person analyses stock market trends on mobile phone. Investor views financial data on smartphone display. Stock charts display, market fluctuations. Businessman tracks investment. Decrease financial trends illustrations Person analyses stock market trends on mobile phone. Investor views financial data on smartphone display. Stock charts display
Free with trial This captivating long exposure photograph showcases a single, gleaming gold coin, subtly illuminated to emphasize its intricate details. The image represents the abstract concept of money, wealth, and economic forces. Intriguingly, the number "-4" is prominently featured on the coin's surface, suggesting a significant financial downturn or a substantial loss. This artistic representation is. Decrease financial trends illustrations Financial Impact Visualized A Long Exposure of a Gold Coin with 4 Highlighting Negative Financial Trends and Concepts. This captivating long exposure photograph showcases a single, gleaming gold coin, subtly illuminated to emphasize its intricate details. The image represents the abstract concept of money, wealth, and economic forces. Intriguingly, the number "-4" is prominently featured on the coin's surface, suggesting a significant financial downturn or a substantial loss. This artistic representation is
Free with trial The graphic illustrates stable bank withdrawals alongside a growing financial trend with upward movement, Bank withdrawals are currently stable and not showing any significant increase or decrease. Decrease financial trends vectors The graphic illustrates stable bank withdrawals alongside a growing financial trend with upward movement, Bank withdrawals are
Free with trial Stock market data screens show red graphs financial decline. Economic downturn, trading trends in modern office. Financial crisis, recession, bear market. Investment losses, falling. Decrease financial trends illustrations Stock market data screens show red graphs financial decline. Economic downturn, trading trends in modern office. Financial
Free with trial A futuristic robotic hand reaches towards interactive financial charts, showcasing cutting-edge technology in data analysis and stock market trends with vivid color accents. Scalp. Decrease financial trends illustrations Advanced robotic hand interacting with dynamic financial charts and graphs, artificial intelligence analysis, stock. A futuristic robotic hand reaches towards interactive financial charts, showcasing cutting-edge technology in data analysis and stock market trends with vivid color accents. Scalp
Free with trial A monitor displays a downward trending bar graph, symbolizing financial loss or economic decline. The visual representation emphasizes negative trends and potential risks. Decrease financial trends vectors Vector art of monitor displaying a downward trending bar graph, indicating financial loss or economic decline. A monitor displays a downward trending bar graph, symbolizing financial loss or economic decline. The visual representation emphasizes negative trends and potential risks
Free with trial Digital financial chart displays rising falling stock market data. Dynamic investment data visualization shows fluctuating market trends. Abstract financial interface with glowing. Decrease financial trends illustrations Digital financial chart displays rising, falling stock market data. Dynamic investment data visualization shows fluctuating. Digital financial chart displays rising falling stock market data. Dynamic investment data visualization shows fluctuating market trends. Abstract financial interface with glowing.
Free with trial Set of linear graphs with red and blue lines showing different trends and dynamics vector illustration. Change in time of election results or income. For business analytics, financial reports. Decrease financial trends vectors Set of linear graphs with red and blue lines showing different trends and dynamics vector illustration. Change in time of election
Free with trial An abstract representation of a financial chart displaying trends and data in vibrant orange against a dark background, Generative AI. Decrease financial trends illustrations An abstract representation of a financial chart displaying trends and data in vibrant orange against a dark background
Free with trial Two coins, one red and one green, each with a dollar sign and a downward arrow, symbolizing financial loss, economic decline, and negative market trends. Decrease financial trends vectors Vector art of two coins with dollar signs and downward arrows indicating financial loss isolated on white background. Two coins, one red and one green, each with a dollar sign and a downward arrow, symbolizing financial loss, economic decline, and negative market trends
Free with trial Watercolor illustration of business growth. Orange bar, pie charts on aged paper show data analysis, market trends, financial progress. Visuals represent success, planning strategic. Decrease financial trends illustrations Watercolor illustration of business growth. Orange bar, pie charts on aged paper show data analysis, market trends, financial
Free with trial Close-up shot of stock market chart with upward and downward trends. Red and blue lines over keyboard show dynamic financial data on screen. Economic analysis forecasting. Decrease financial trends illustrations Close-up shot of stock market chart with upward and downward trends. Red and blue lines over keyboard show dynamic financial data
Free with trial A wall display of framed blue data charts and graphs showing various financial trends and statistical information. A captivating fusion of imagination and modern design aesthetics. Generative AI. Decrease financial trends illustrations A wall display of framed blue data charts and graphs showing various financial trends and statistical information. Generative AI. A wall display of framed blue data charts and graphs showing various financial trends and statistical information. A captivating fusion of imagination and modern design aesthetics. Generative AI
Free with trial Digital screen displaying stock market trends analysis with red data points representing a decline, visualized through charts and candlestick diagrams. Decrease financial trends illustrations Financial data visualization of stock market trends showing declining statistics and analytical software for trading platform. Digital screen displaying stock market trends analysis with red data points representing a decline, visualized through charts and candlestick diagrams
Free with trial A vibrant depiction of the American flag overlaid with financial graphs, conveying economic activity and market fluctuations. The colors are bold and dynamic, reflecting financial markets' volatile nature and patriotic symbolism. Decrease financial trends illustrations American flag merged with fluctuating financial graph, symbolizing economic trends and stock market dynamics. A vibrant depiction of the American flag overlaid with financial graphs, conveying economic activity and market fluctuations. The colors are bold and dynamic, reflecting financial markets' volatile nature and patriotic symbolism.
Free with trial A hand interacts with a digital screen displaying financial growth trends and data visualizations for the year 2025. Decrease financial trends illustrations Analyzing financial growth trends on a digital interface. A hand interacts with a digital screen displaying financial growth trends and data visualizations for the year 2025
Free with trial Graph with financial data, line charts, and growth arrows on a grid background, indicating future trends for 2024 and 2025. 3D Rendering. Decrease financial trends illustrations Financial Data Analysis with Growth Arrows and Global Map. 3D Rendering. Graph with financial data, line charts, and growth arrows on a grid background, indicating future trends for 2024 and 2025. 3D Rendering
Free with trial Gold bullion placed on a financial stock market chart background, representing investment, wealth, and market trends in the global economy. Decrease financial trends illustrations Gold bullion with financial chart, investment concept. Gold bullion placed on a financial stock market chart background, representing investment, wealth, and market trends in the global economy.
Free with trial A set of financial growth and decline chart icons featuring up and down arrows with colorful bars, indicating economic trends. the concept of financial market increases, decreases and fluctuations. Decrease financial trends vectors Set of Financial Fluctuation Chart Icons in Flat Design. A set of financial growth and decline chart icons featuring up and down arrows with colorful bars, indicating economic trends. the concept of financial market increases, decreases and fluctuations
Free with trial A set of money icons featuring up and down arrows with dollar and coin symbols, indicating financial movements for profit and price reduction. The concept of money flow, economic trends. Decrease financial trends vectors Currency Symbols with Arrows Indicating Increase and Decrease. A set of money icons featuring up and down arrows with dollar and coin symbols, indicating financial movements for profit and price reduction. The concept of money flow, economic trends
Free with trial Downward arrow pointing to a dollar symbol beside a simplistic outline of a laptop. Ideal for economic trends, savings, financial losses, e-commerce, technology impact, cost reduction, minimalism. A. Decrease financial trends illustrations Financial Decrease Concept with Laptop, Downward Arrow, and Dollar Sign. Downward arrow pointing to a dollar symbol beside a simplistic outline of a laptop. Ideal for economic trends, savings, financial losses, e-commerce, technology impact, cost reduction, minimalism. A
Free with trial Sales performance, data analysis, business strategy, financial downturn, decision making, marketing insights. Arrow pointing down with sale text, charts check mark. Sales performance and data. Decrease financial trends vectors Sales Analytics and Performance Metrics with Downward Trends and Checkmark. Sales performance, data analysis, business strategy, financial downturn, decision making, marketing insights. Arrow pointing down with sale text, charts check mark. Sales performance and data
Free with trial Business performance, negative trends, data analysis, economic decline, search results, user concerns. Sad emoticon, graph with downward trend magnifying glass. Business and negative trends. Decrease financial trends vectors Declining Graph with Sad Face and Search Bar Negative Trends and Analysis. Business performance, negative trends, data analysis, economic decline, search results, user concerns. Sad emoticon, graph with downward trend magnifying glass. Business and negative trends
Free with trial A striking red line graph dramatically descends across a dark, futuristic digital grid background, illuminated by subtle blue light. This powerful visual represents a significant financial downturn, economic crisis, market crash, or business loss. The jagged, downward-sloping line symbolizes negative trends, risk, bankruptcy, and declining profits. It's an ideal image for conveying concepts of recession, failure, warning, or critical data analysis in business, finance, and technology contexts, emphasizing a period of decline or crisis. Decrease financial trends illustrations Red Declining Graph - Financial Crisis Concept. A striking red line graph dramatically descends across a dark, futuristic digital grid background, illuminated by subtle blue light. This powerful visual represents a significant financial downturn, economic crisis, market crash, or business loss. The jagged, downward-sloping line symbolizes negative trends, risk, bankruptcy, and declining profits. It's an ideal image for conveying concepts of recession, failure, warning, or critical data analysis in business, finance, and technology contexts, emphasizing a period of decline or crisis.
Free with trial Two simple icons representing financial market performance, one showing a downward trend and the other an upward trend, both with dollar symbols. Decrease financial trends vectors Financial graph icons showing market trends up and down. Two simple icons representing financial market performance, one showing a downward trend and the other an upward trend, both with dollar symbols
Free with trial A clean black and white set of nine vector icons showing growth, decline, stability, and financial trends for business presentations and reports. Decrease financial trends vectors Economic trend icons set flat design vector illustration. A clean black and white set of nine vector icons showing growth, decline, stability, and financial trends for business presentations and reports.
Free with trial Blue downward arrows illustrating a decrease in value beside coin stacks and Bitcoin, symbolizing financial uncertainty. Ideal for finance, cryptocurrency, investment risk, market trends, economy. Decrease financial trends vectors Declining Cryptocurrency Value Represented by Falling Arrows and Bitcoin Stacks. Blue downward arrows illustrating a decrease in value beside coin stacks and Bitcoin, symbolizing financial uncertainty. Ideal for finance, cryptocurrency, investment risk, market trends, economy
Free with trial E-commerce, consumer dissatisfaction, online shopping issues, financial challenges, sales decrease, supply chain problems. Sad face and empty cart. E-commerce and consumer dissatisfaction concept. Decrease financial trends vectors Sad Face and Empty Shopping Cart with Wavy Lines Unhappiness in E-commerce. E-commerce, consumer dissatisfaction, online shopping issues, financial challenges, sales decrease, supply chain problems. Sad face and empty cart. E-commerce and consumer dissatisfaction concept
Free with trial Business trends, financial shifts, growth, decline, recovery, cloud computing. Downward blue arrow and upward symbol towards a cloud. financial shifts and growth concepts. Decrease financial trends vectors Decrease and Growth Concept with Downward Arrow and Rising Symbol Towards a Cloud. Business trends, financial shifts, growth, decline, recovery, cloud computing. Downward blue arrow and upward symbol towards a cloud. financial shifts and growth concepts
Free with trial Data trends. Data with arrows indicating increase and decrease, growth chart, and audio waveform. Data trends highlight growth, performance tracking, and communication analysis. Suitable. Decrease financial trends illustrations Data Trends and Analysis with Arrows, Graph, and Audio Waveform Communication Metrics. Data trends. Data with arrows indicating increase and decrease, growth chart, and audio waveform. Data trends highlight growth, performance tracking, and communication analysis. Suitable
Free with trial Flat style icon depicting money with up and down arrows indicating financial fluctuation and market trends visualized. Decrease financial trends vectors Money and Arrows Icon Representing Financial Fluctuation Concept. Flat style icon depicting money with up and down arrows indicating financial fluctuation and market trends visualized.
Free with trial A light blue 3D zigzag arrow pointing downwards, illustrating market instability, declining trends, financial risks, and setbacks in a modern digital graphic style. Decrease financial trends vectors Light Blue 3D Zigzag Downward Arrow for Financial Decline and Risk. A light blue 3D zigzag arrow pointing downwards, illustrating market instability, declining trends, financial risks, and setbacks in a modern digital graphic style.
Free with trial Abstract illustration of a financial graph with glowing lines on a dark background. The graph shows two distinct curves, one starting in cool blue tones and transitioning to warm orange hues, suggesting a shift in market trends or performance. The image conveys concepts of data analysis, growth, decline, and financial forecasting. Suitable for illustrating business reports, presentations, or articles related to finance, investment, and economics. Decrease financial trends illustrations Abstract Financial Graph Illustration. Abstract illustration of a financial graph with glowing lines on a dark background. The graph shows two distinct curves, one starting in cool blue tones and transitioning to warm orange hues, suggesting a shift in market trends or performance. The image conveys concepts of data analysis, growth, decline, and financial forecasting. Suitable for illustrating business reports, presentations, or articles related to finance, investment, and economics.
Free with trial Six simple line graphs showcase various data trends, including upward, downward, and fluctuating patterns. Each graph features key data points marked with letters. Decrease financial trends illustrations Six Line Graph Charts Data Visualization, Trends, Growth, Analysis. Six simple line graphs showcase various data trends, including upward, downward, and fluctuating patterns. Each graph features key data points marked with letters
Free with trial Financial market chart with burning sun. Decrease financial trends illustrations Global stock market trading chart with financial data and candles, dark theme, red orange. Financial market chart with burning sun
Free with trial A versatile collection of flat vector icons representing key concepts in finance, economics, and security. This comprehensive set includes symbols for market growth, decline, and trends, various currency representations like the Euro and Korean Won, and essential security elements such as open and closed padlocks. Designed with a clean, modern aesthetic, these icons are perfect for enhancing business presentations, financial reports, websites, mobile applications, and infographics, effectively illustrating concepts like investment, market analysis, currency exchange, and data protection. Decrease financial trends vectors Financial and Security Vector Icon Set. A versatile collection of flat vector icons representing key concepts in finance, economics, and security. This comprehensive set includes symbols for market growth, decline, and trends, various currency representations like the Euro and Korean Won, and essential security elements such as open and closed padlocks. Designed with a clean, modern aesthetic, these icons are perfect for enhancing business presentations, financial reports, websites, mobile applications, and infographics, effectively illustrating concepts like investment, market analysis, currency exchange, and data protection.
Free with trial A bold, three-dimensional red percentage symbol (%) is depicted against a clean white background. The symbol is stylized with a downward-pointing arrow integrated into its design, suggesting a decrease or reduction. This graphic is ideal for illustrating concepts related to discounts, sales, negative growth, financial losses, or declining trends in various business and economic contexts. Decrease financial trends vectors Red Percentage Symbol with Downward Arrow. A bold, three-dimensional red percentage symbol (%) is depicted against a clean white background. The symbol is stylized with a downward-pointing arrow integrated into its design, suggesting a decrease or reduction. This graphic is ideal for illustrating concepts related to discounts, sales, negative growth, financial losses, or declining trends in various business and economic contexts.
Free with trial Consumer behavior, sustainability, e-commerce, recycling awareness, monetary trends, sales decrease. Blue arrow pointing down, recycling sign on a shopping bag and dollar coin. Consumer behavior. Decrease financial trends vectors Arrow Pointing Downward with Shopping Bag and Dollar Symbol - E-Commerce and Sustainability Concepts. Consumer behavior, sustainability, e-commerce, recycling. Consumer behavior, sustainability, e-commerce, recycling awareness, monetary trends, sales decrease. Blue arrow pointing down, recycling sign on a shopping bag and dollar coin. Consumer behavior
Free with trial An illustrative bar chart depicts a clear financial decline, with five orange bars progressively decreasing in height from left to right. Each bar is topped with a black-outlined money bag containing a dollar sign, symbolizing diminishing wealth, income, or investment. This simple, flat design icon effectively conveys concepts of financial loss, economic downturn, decreasing profits, or budget cuts, suitable for business reports, presentations, and articles on market trends or investment risks. Decrease financial trends vectors Financial Decline Bar Chart with Money Bags. An illustrative bar chart depicts a clear financial decline, with five orange bars progressively decreasing in height from left to right. Each bar is topped with a black-outlined money bag containing a dollar sign, symbolizing diminishing wealth, income, or investment. This simple, flat design icon effectively conveys concepts of financial loss, economic downturn, decreasing profits, or budget cuts, suitable for business reports, presentations, and articles on market trends or investment risks.
Free with trial A person in a suit uses a pen and tablet with a holographic house overlayed with graph data. The blue hue gives a futuristic look. The data suggests the person is analyzing real estate trends and making financial decisions or predictions. The image was generated by AI. Decrease financial trends illustrations Real Estate Analytics. A person in a suit uses a pen and tablet with a holographic house overlayed with graph data. The blue hue gives a futuristic look. The data suggests the person is analyzing real estate trends and making financial decisions or predictions. The image was generated by AI.
Free with trial This image visually represents the concept of debt reduction. Stacks of gold coins are shown in a downward trajectory, symbolizing financial decline or the diminishing of debt. A prominent red arrow, pointing downwards, reinforces this idea of decrease and loss. The clean, dark background and sharp focus on the coins and arrow create a professional and impactful visual for financial planning, economic trends, or debt management themes. Decrease financial trends vectors Debt Reduction Concept: Falling Coins and Red Arrow. This image visually represents the concept of debt reduction. Stacks of gold coins are shown in a downward trajectory, symbolizing financial decline or the diminishing of debt. A prominent red arrow, pointing downwards, reinforces this idea of decrease and loss. The clean, dark background and sharp focus on the coins and arrow create a professional and impactful visual for financial planning, economic trends, or debt management themes.
Free with trial A conceptual vector illustration depicting the currency exchange rate between the US Dollar (USD) and the Euro (EUR). The green dollar sign is shown with an upward-pointing arrow and a rising trend line, symbolizing an increase in its value. Conversely, the red Euro sign is accompanied by a downward-pointing arrow and a falling trend line, indicating a decrease in its value. A red checkmark sits between them, emphasizing the shift. This graphic effectively visualizes market fluctuations, forex trading, economic trends, and international finance, suitable for financial news, reports, and presentations. Decrease financial trends vectors USD EUR Currency Exchange Rate Trend and Fluctuation. A conceptual vector illustration depicting the currency exchange rate between the US Dollar (USD) and the Euro (EUR). The green dollar sign is shown with an upward-pointing arrow and a rising trend line, symbolizing an increase in its value. Conversely, the red Euro sign is accompanied by a downward-pointing arrow and a falling trend line, indicating a decrease in its value. A red checkmark sits between them, emphasizing the shift. This graphic effectively visualizes market fluctuations, forex trading, economic trends, and international finance, suitable for financial news, reports, and presentations.
Free with trial Modern black and white vector icons depicting financial trends like rising, falling, and stable graphs, dollar signs, and investment arrows for business presentations and reports. Decrease financial trends vectors Financial trend icons vector illustration showing profit loss growth and investment flat design. Modern black and white vector icons depicting financial trends like rising, falling, and stable graphs, dollar signs, and investment arrows for business presentations and reports.
Free with trial A hand-drawn bar chart shows a downward trend with a line graph indicating a significant decrease in value over time. Decrease financial trends vectors Downturn graph illustrating declining trends and financial loss. A hand-drawn bar chart shows a downward trend with a line graph indicating a significant decrease in value over time
Free with trial Close-up of neatly stacked coins, arranged in an ascending and descending pattern, symbolizing financial growth, savings, and investment progress. The blurred background features a dynamic financial market chart with glowing lines, representing stock market trends, economic data, or cryptocurrency fluctuations. This image effectively illustrates concepts of wealth management, business success, risk, and the fluctuating nature of the global economy. It's ideal for financial articles, presentations, and advertisements related to banking, investment, budgeting, and economic analysis. Decrease financial trends illustrations Financial Growth Concept with Stacks of Coins and Stock Market Chart. Close-up of neatly stacked coins, arranged in an ascending and descending pattern, symbolizing financial growth, savings, and investment progress. The blurred background features a dynamic financial market chart with glowing lines, representing stock market trends, economic data, or cryptocurrency fluctuations. This image effectively illustrates concepts of wealth management, business success, risk, and the fluctuating nature of the global economy. It's ideal for financial articles, presentations, and advertisements related to banking, investment, budgeting, and economic analysis.
Free with trial This visually striking image depicts a futuristic financial concept. Scattered coins on a dark surface are illuminated by glowing neon percentages (1%, 10%, 20%, 30%, 50%, 100%). A subtle network of lines and lights in the background suggests a digital or abstract representation of data and growth. The composition evokes themes of investment, progress, and financial targets, suitable for business, finance, and technology-related content. Decrease financial trends illustrations Digital Growth and Financial Percentages. This visually striking image depicts a futuristic financial concept. Scattered coins on a dark surface are illuminated by glowing neon percentages (1%, 10%, 20%, 30%, 50%, 100%). A subtle network of lines and lights in the background suggests a digital or abstract representation of data and growth. The composition evokes themes of investment, progress, and financial targets, suitable for business, finance, and technology-related content.
Free with trial A flat design vector illustration depicting a financial market data board or stock ticker. The black-bordered display features various stock symbols, numerical values like '$ ,80K', '$ ,22,50', and indicators of market performance. Prominently highlighted in red is the word 'LOSING', accompanied by a red downward arrow signifying a price drop, and a red downward triangle. Conversely, a green upward arrow indicates a price increase. This icon effectively visualizes concepts of financial loss, gain, market volatility, and investment trends, suitable for business, finance, and economic content. Decrease financial trends illustrations Financial Market Data Board Icon with Loss and Gain Indicators. A flat design vector illustration depicting a financial market data board or stock ticker. The black-bordered display features various stock symbols, numerical values like '$ ,80K', '$ ,22,50', and indicators of market performance. Prominently highlighted in red is the word 'LOSING', accompanied by a red downward arrow signifying a price drop, and a red downward triangle. Conversely, a green upward arrow indicates a price increase. This icon effectively visualizes concepts of financial loss, gain, market volatility, and investment trends, suitable for business, finance, and economic content.
Free with trial A prominent 3D metallic US dollar sign stands against a dynamic digital background featuring various financial charts and graphs. The background displays a fluctuating line graph and a colorful bar chart, symbolizing market trends, economic data, and investment performance. This image powerfully conveys concepts of finance, global economy, currency strength, stock market analysis, and wealth management in a modern, digital context. Ideal for illustrating reports, presentations, or articles related to business, banking, and financial growth. Decrease financial trends illustrations US Dollar Symbol with Digital Financial Charts and Market Data. A prominent 3D metallic US dollar sign stands against a dynamic digital background featuring various financial charts and graphs. The background displays a fluctuating line graph and a colorful bar chart, symbolizing market trends, economic data, and investment performance. This image powerfully conveys concepts of finance, global economy, currency strength, stock market analysis, and wealth management in a modern, digital context. Ideal for illustrating reports, presentations, or articles related to business, banking, and financial growth.
Free with trial This image features a minimalist and modern vector icon of a jagged downward trending line graph, sharply declining from left to right, symbolizing financial loss, economic downturn, or market decline, set against a clean and uncluttered white background suitable for use in presentations, reports, infographics, or digital media to visually communicate negative trends or decreasing performance. Decrease financial trends illustrations Sharp downward trending line graph icon isolated on white background representing financial loss or market decline vector. This image features a minimalist and modern vector icon of a jagged downward trending line graph, sharply declining from left to right, symbolizing financial loss, economic downturn, or market decline, set against a clean and uncluttered white background suitable for use in presentations, reports, infographics, or digital media to visually communicate negative trends or decreasing performance
Free with trial A collection of nine simple, solid black icons on a white background, illustrating concepts of decline, loss, and negative trends using various charts like bar graphs, line graphs, and pie charts with downward pointing arrows. Decrease financial trends vectors Set of black icons representing financial decrease and downward trends. A collection of nine simple, solid black icons on a white background, illustrating concepts of decline, loss, and negative trends using various charts like bar graphs, line graphs, and pie charts with downward pointing arrows
Free with trial A magnifying glass rests on gold coins atop a financial chart, generated by AI. This image symbolizes the detailed examination and analysis needed for successful investment strategies in the volatile world of finance. The visual representation highlights the intricate process of studying market tre. Decrease financial trends illustrations Financial Market Analysis. A magnifying glass rests on gold coins atop a financial chart, generated by AI. This image symbolizes the detailed examination and analysis needed for successful investment strategies in the volatile world of finance. The visual representation highlights the intricate process of studying market tre
Free with trial A modern vector illustration of a line graph showing a clear decline, emphasized by a red downtrend arrow. Ideal for financial reports, business presentations, or data visualization projects illustrating negative trends or decreases. This graphic effectively communicates a downward movement in statistics, vector design Generative AI. Decrease financial trends vectors Declining Line Graph with Red Downtrend Arrow, vector design Generative AI. A modern vector illustration of a line graph showing a clear decline, emphasized by a red downtrend arrow. Ideal for financial reports, business presentations, or data visualization projects illustrating negative trends or decreases. This graphic effectively communicates a downward movement in statistics, vector design Generative AI
Free with trial A person in a suit analyzes a financial chart with a pen. The chart displays a red zigzag arrow pointing downward, indicating a decline. Various colorful pie charts and graphs are scattered on the table. The focus is on the financial documents and analysis tools, suggesting an office or business setting. The overall tone conveys economic downturn or negative financial trends. a i generated. Decrease financial trends illustrations A hand analyzes a declining financial chart with a red arrow pointing downward. A person in a suit analyzes a financial chart with a pen. The chart displays a red zigzag arrow pointing downward, indicating a decline. Various colorful pie charts and graphs are scattered on the table. The focus is on the financial documents and analysis tools, suggesting an office or business setting. The overall tone conveys economic downturn or negative financial trends. a i generated
Free with trial A robotic hand extends toward dynamic financial graphs and data in a cosmic setting. This image symbolizes the intersection of technology and finance, showcasing innovation. Scalp. Decrease financial trends illustrations Futuristic robotic hand reaching towards digital financial graphs and data visualizations in a cosmic background with. A robotic hand extends toward dynamic financial graphs and data in a cosmic setting. This image symbolizes the intersection of technology and finance, showcasing innovation. Scalp
Free with trial A red downward-trending arrow overlays a background of financial documents featuring colorful charts and graphs. A person in a suit is writing on one of the pages, indicating analysis or note-taking. The setting suggests a focus on market trends, possibly within a corporate or financial context. The grid pattern across the image adds a conceptual element of data analysis. a i generated. Decrease financial trends illustrations Declining market trends analysis with a downward trending red arrow overlay. A red downward-trending arrow overlays a background of financial documents featuring colorful charts and graphs. A person in a suit is writing on one of the pages, indicating analysis or note-taking. The setting suggests a focus on market trends, possibly within a corporate or financial context. The grid pattern across the image adds a conceptual element of data analysis. a i generated
Free with trial Business Meeting on Real Estate Market Analysis with Charts, Graphs, and Digital House Icon Showing Trends in Property Value Changes Sigmoid. Decrease financial trends illustrations Professionals discuss real estate market trends using data and analytics. A digital house icon symbolizes value changes. Business Meeting on Real Estate Market Analysis with Charts, Graphs, and Digital House Icon Showing Trends in Property Value Changes Sigmoid
Free with trial Wooden blocks spelling COST sit atop stacks of coins, with white arrows pointing downwards, signifying cost reduction or savings. Decrease financial trends illustrations Reducing costs with financial growth and downward trends. Wooden blocks spelling COST sit atop stacks of coins, with white arrows pointing downwards, signifying cost reduction or savings
Free with trial Downward arrow, magnifying glass, dollar sign indicate declining trends, financial analysis, revenue downturn. Ideal for business, finance, investment, market trends loss economic study simple. Decrease financial trends vectors Declining Trends in Business Revenue with Analysis and Financial Focus. Downward arrow, magnifying glass, dollar sign indicate declining trends, financial analysis, revenue downturn. Ideal for business, finance, investment, market trends loss economic study simple
Free with trial 3D bar chart with red arrows pointing upwards, reflecting off a shiny, blue surface. The clean, minimalist design symbolizes financial growth, business success, and positive market trends. Ideal for use in presentations, financial reports, and marketing materials related to investment, stock market, and economic progress. Decrease financial trends illustrations Financial Growth 3D Bar Chart with Red Arrows. 3D bar chart with red arrows pointing upwards, reflecting off a shiny, blue surface. The clean, minimalist design symbolizes financial growth, business success, and positive market trends. Ideal for use in presentations, financial reports, and marketing materials related to investment, stock market, and economic progress
Free with trial 3D bar chart with red arrows pointing upwards, reflecting off a shiny, blue surface. The clean, minimalist design symbolizes financial growth, business success, and positive market trends. Ideal for use in presentations, financial reports, and marketing materials related to investment, stock market, and economic progress. Decrease financial trends illustrations Financial Growth 3D Bar Chart with Red Arrows. 3D bar chart with red arrows pointing upwards, reflecting off a shiny, blue surface. The clean, minimalist design symbolizes financial growth, business success, and positive market trends. Ideal for use in presentations, financial reports, and marketing materials related to investment, stock market, and economic progress
Free with trial 3D bar chart with red arrows pointing upwards, reflecting off a shiny, blue surface. The clean, minimalist design symbolizes financial growth, business success, and positive market trends. Ideal for use in presentations, financial reports, and marketing materials related to investment, stock market, and economic progress. Decrease financial trends illustrations Financial Growth 3D Bar Chart with Red Arrows. 3D bar chart with red arrows pointing upwards, reflecting off a shiny, blue surface. The clean, minimalist design symbolizes financial growth, business success, and positive market trends. Ideal for use in presentations, financial reports, and marketing materials related to investment, stock market, and economic progress