Free with trial A cheerful 3D-rendered cartoon businessman sits confidently beside a rising bar graph, holding a pie chart, symbolizing successful business growth and financial planning. He appears relaxed and optimistic, suggesting achievement and future prosperity. Decrease financial trends illustrations Smiling 3D Cartoon Businessman Analyzing Financial Growth Charts. A cheerful 3D-rendered cartoon businessman sits confidently beside a rising bar graph, holding a pie chart, symbolizing successful business growth and financial planning. He appears relaxed and optimistic, suggesting achievement and future prosperity.
Free with trial Simple vector illustration of a green up arrow and a red down arrow icon for financial charts and analysis. Decrease financial trends illustrations Green up arrow and red down arrow symbols representing growth and decline trends. Simple vector illustration of a green up arrow and a red down arrow icon for. Simple vector illustration of a green up arrow and a red down arrow icon for financial charts and analysis
Free with trial The image features a bold, red arrow that forms a downward curve, resembling the shape of a downward-facing 'U'. This symbol is often used to represent a downward trend, reversal, or decrease in various contexts such as finance, sports, or general trends. Decrease financial trends illustrations A bold red arrow in a downward curve shape, symbolizing a downward trend or reversal. The image features a bold, red arrow that forms a downward curve, resembling the shape of a downward-facing 'U'. This symbol is often used to represent a downward trend, reversal, or decrease in various contexts such as finance, sports, or general trends
Free with trial A collection of nine simple, solid black icons on a white background, illustrating concepts of decline, loss, and negative trends using various charts like bar graphs, line graphs, and pie charts with downward pointing arrows. Decrease financial trends vectors Set of black icons representing financial decrease and downward trends. A collection of nine simple, solid black icons on a white background, illustrating concepts of decline, loss, and negative trends using various charts like bar graphs, line graphs, and pie charts with downward pointing arrows
Free with trial The image features various financial data visualizations, including declining bar charts, pie charts, and downward trend graphs, which collectively illustrate a decrease in financial performance metrics. These elements serve as effective tools for analyzing business statistics and presenting reports. The visuals are designed to convey a clear message about trends and losses in the economy. This composition is made with AI. Decrease financial trends vectors Declining Bar Charts Pie Chart and Downward Trend Graphs for Financial Data Analysis and Business Reports. The image features various financial data visualizations, including declining bar charts, pie charts, and downward trend graphs, which collectively illustrate a decrease in financial performance metrics. These elements serve as effective tools for analyzing business statistics and presenting reports. The visuals are designed to convey a clear message about trends and losses in the economy. This composition is made with AI.
Free with trial A detailed financial analysis scene featuring a whiteboard calculator, a magnifying glass hovering over pie charts, and gold coins scattered on documents with bar graphs. This overhead shot on a wooden desk conveys concepts of auditing, investment, and financial planning. This image was generated with the assistance of artificial intelligence. Decrease financial trends illustrations Financial Analysis Calculator, Magnifying Glass, Charts, and Coins on Desk. A detailed financial analysis scene featuring a whiteboard calculator, a magnifying glass hovering over pie charts, and gold coins scattered on documents with bar graphs. This overhead shot on a wooden desk conveys concepts of auditing, investment, and financial planning.This image was generated with the assistance of artificial intelligence.
Free with trial A person in a blue shirt is analyzing cost reduction strategies using a laptop computer A financial chart highlights decreasing costs symbolized by a downward trending red line and green bars indicating financial performance The image conveys themes of business success financial efficiency and strategic cost management in a digital age The focus on technology and financial analysis is evident. Decrease financial trends illustrations Analyzing Cost Reduction Strategy with Laptop and Financial Chart Showing Decreasing Costs for Business Success and Efficiency. A person in a blue shirt is analyzing cost reduction strategies using a laptop computer A financial chart highlights decreasing costs symbolized by a downward trending red line and green bars indicating financial performance The image conveys themes of business success financial efficiency and strategic cost management in a digital age The focus on technology and financial analysis is evident
Free with trial Decreasing graph icon Business chart with downward arrow Financial loss symbol. Decrease financial trends vectors Decreasing graph icon Business chart with downward arrow Financial loss symbol
Free with trial This abstract digital artwork features a blue and gray bar graph with data points highlighting growth trends on a dark background, ideal for business and analytics themes Generative AI. Decrease financial trends illustrations Blue and Gray Bar Graph with Data Points Representing Growth Trends and Statistical Analysis in Digital Format on Dark Background. This abstract digital artwork features a blue and gray bar graph with data points highlighting growth trends on a dark background, ideal for business and analytics themes Generative AI
Free with trial A vibrant 3D rendered blue arrow points downwards, signifying a decrease or decline. Attached to the arrow is a pink circular emblem featuring a white percentage sign. This graphic is isolated on a white background, making it suitable for representing concepts like price drops, sales, economic downturns, or negative trends. Decrease financial trends illustrations 3D Blue Downward Arrow with a Pink Percentage Sign Emblem decrease decline. A vibrant 3D rendered blue arrow points downwards, signifying a decrease or decline. Attached to the arrow is a pink circular emblem featuring a white percentage sign. This graphic is isolated on a white background, making it suitable for representing concepts like price drops, sales, economic downturns, or negative trends
Free with trial A detailed illustration of a business growth chart with multiple lines, representing profit, trend, and loss, along with various financial indicators and icons. Decrease financial trends vectors Business growth chart with multiple lines and various financial indicators. A detailed illustration of a business growth chart with multiple lines, representing profit, trend, and loss, along with various financial indicators and icons
Free with trial The image shows a set of colorful blocks stacked in descending height from purple to blue, accompanied by a red arrow that initially trends upward and then sharply downward, symbolizing a rise followed by a decline in performance or values. This visual metaphor is often used to represent business cycles, market trends, or financial fluctuations. Decrease financial trends illustrations Colorful blocks and arrow illustrating fluctuating business or market trends. The image shows a set of colorful blocks stacked in descending height from purple to blue, accompanied by a red arrow that initially trends upward and then sharply downward, symbolizing a rise followed by a decline in performance or values. This visual metaphor is often used to represent business cycles, market trends, or financial fluctuations
Free with trial The image depicts a large red downward-pointing arrow made up of scattered poker chips, with red and grey chips falling around it. This visual metaphorically represents a significant financial drop, loss, or decline in value, often used to illustrate economic downturns or negative trends in business contexts. Decrease financial trends illustrations Downward cascade of poker chips symbolizing financial decline or loss. The image depicts a large red downward-pointing arrow made up of scattered poker chips, with red and grey chips falling around it. This visual metaphorically represents a significant financial drop, loss, or decline in value, often used to illustrate economic downturns or negative trends in business contexts
Free with trial The image depicts a stack of green coins with a downward sloping red arrow, symbolizing a decline or reduction in financial growth or economic value. The visual metaphor suggests a decrease in profitability or market performance, often used in business and economic contexts to illustrate negative trends. Decrease financial trends illustrations Declining financial growth represented by falling coins and downward arrow. The image depicts a stack of green coins with a downward sloping red arrow, symbolizing a decline or reduction in financial growth or economic value. The visual metaphor suggests a decrease in profitability or market performance, often used in business and economic contexts to illustrate negative trends
Free with trial This is an detailed collection of financial growth charts and market volatility icons in a clean minimal style. Decrease financial trends vectors Financial line icons showing stock market trends with bull and bear symbols. This is an detailed collection of financial growth charts and market volatility icons in a clean minimal style
Free with trial The image features a dollar sign symbol in the center, with a red downward arrow pointing to the left and a green upward arrow pointing to the right, symbolizing a decline and rise in financial values or trends. The design is minimalistic and uses contrasting colors to emphasize the opposing directions. Decrease financial trends vectors Dollar sign symbol with upward and downward arrows indicating financial trends. The image features a dollar sign symbol in the center, with a red downward arrow pointing to the left and a green upward arrow pointing to the right, symbolizing a decline and rise in financial values or trends. The design is minimalistic and uses contrasting colors to emphasize the opposing directions
Free with trial The image depicts a three-dimensional dollar sign with two opposing arrows, one red pointing downward and one green pointing upward, symbolizing financial fluctuations, growth, and economic trends. The visual metaphor emphasizes both gains and losses in financial contexts, often used to illustrate market dynamics or economic cycles. Decrease financial trends illustrations Financial growth symbolized by upward and downward arrows around a dollar sign. The image depicts a three-dimensional dollar sign with two opposing arrows, one red pointing downward and one green pointing upward, symbolizing financial fluctuations, growth, and economic trends. The visual metaphor emphasizes both gains and losses in financial contexts, often used to illustrate market dynamics or economic cycles
Free with trial Minimalist black and white graphic illustrating opposing directions, ideal for financial reports, business presentations, and decision-making concepts in marketing materials. Decrease financial trends vectors Up and down arrows on horizontal bar symbolizing market trends and decision making. Minimalist black and white graphic illustrating opposing directions, ideal for financial reports, business presentations, and decision-making concepts in marketing materials
Free with trial The image features a three-dimensional golden dollar sign symbolizing currency. Two arrows are attached: a green upward arrow pointing to the left and a red downward arrow pointing to the right, representing positive and negative financial movements or economic trends. The design is clean and modern, suitable for financial or economic discussions and presentations. Decrease financial trends illustrations Golden dollar sign with upward and downward arrows indicating financial trends. The image features a three-dimensional golden dollar sign symbolizing currency. Two arrows are attached: a green upward arrow pointing to the left and a red downward arrow pointing to the right, representing positive and negative financial movements or economic trends. The design is clean and modern, suitable for financial or economic discussions and presentations
Free with trial A financial graph displays growth using stacked segments made from black tire treads. The graph is on a dark, textured surface that enhances the design. Decrease financial trends illustrations Financial graph made of black rubber tire treads shows growth trend on a dark surface. A financial graph displays growth using stacked segments made from black tire treads. The graph is on a dark, textured surface that enhances the design
Free with trial An image showcasing four different graphical representations of financial trends using arrows and lines on grid backgrounds. Decrease financial trends illustrations Graphical representation of financial trends isolated on transparent background. An image showcasing four different graphical representations of financial trends using arrows and lines on grid backgrounds
Free with trial The image depicts a series of ascending wooden blocks forming a staircase, with a red upward-sloping arrow indicating growth. Following this, a downward red arrow suggests a subsequent decline, symbolizing a rise and fall trend often seen in market trends, business cycles, or performance metrics. Decrease financial trends illustrations Visual representation of growth and decline in a business or financial context. The image depicts a series of ascending wooden blocks forming a staircase, with a red upward-sloping arrow indicating growth. Following this, a downward red arrow suggests a subsequent decline, symbolizing a rise and fall trend often seen in market trends, business cycles, or performance metrics
Free with trial The image features declining business graphs illustrated with pie charts and falling arrow indicators, representing financial analysis and reports on downward trends, decreases in performance metrics, and economic risks. It effectively visualizes key data related to investment and marketing losses. This representation has been created using AI. Decrease financial trends vectors Declining Business Graphs Falling Arrow Chart and Pie Chart for Financial Analysis and Reports. The image features declining business graphs illustrated with pie charts and falling arrow indicators, representing financial analysis and reports on downward trends, decreases in performance metrics, and economic risks. It effectively visualizes key data related to investment and marketing losses. This representation has been created using AI.
Free with trial Colorful business charts and graphs showing financial growth, data analysis, and stock market trends, ideal for corporate presentations and reports. Decrease financial trends illustrations Business data analysis charts graphs financial growth stock market trend generative ai. colorful business charts and graphs showing financial growth, data analysis, and stock market trends, ideal for corporate presentations and reports.
Free with trial Person analyzes growth chart, market trends, financial data, stock exchange, investment portfolio,Generative AI. Decrease financial trends illustrations Business person analyzes growth charts, market trends, and financial data on an interactive screen. Person analyzes growth chart, market trends, financial data, stock exchange, investment portfolio,Generative AI
Free with trial The image shows a bar chart with three bars of decreasing height in blue, representing a downward trend. A red diagonal arrow overlays the bars, emphasizing a sharp decline, often used to symbolize financial downturns, reduced performance, or negative market trends. Decrease financial trends illustrations Graphic illustrating a decline in performance or market trend with bar and arrow chart. The image shows a bar chart with three bars of decreasing height in blue, representing a downward trend. A red diagonal arrow overlays the bars, emphasizing a sharp decline, often used to symbolize financial downturns, reduced performance, or negative market trends
Free with trial This is an detailed collection of financial icons depicting various stock market trends, growth curves, and data analysis patterns. Decrease financial trends vectors Financial data and stock market trend line icons set showing growth and volatility curves. This is an detailed collection of financial icons depicting various stock market trends, growth curves, and data analysis patterns
Free with trial This 3D illustration features a downward arrow with a dollar sign, symbolizing financial decline or decrease. The image is set against a transparent background, making it versatile for various design projects. The clean, modern design is perfect for presentations, websites, or any visual content requiring a clear, impactful symbol of economic trends. Decrease financial trends vectors A 3d illustration of a downward arrow with a dollar sign, isolated on transparent background. This 3D illustration features a downward arrow with a dollar sign, symbolizing financial decline or decrease. The image is set against a transparent background, making it versatile for various design projects. The clean, modern design is perfect for presentations, websites, or any visual content requiring a clear, impactful symbol of economic trends.
Free with trial Decreasing Bar Chart with Arrow: Business Decline, Negative Trend, Financial Loss and Downturn. Decrease financial trends vectors Decreasing Bar Chart with Arrow: Business Decline, Negative Trend, Financial Loss and Downturn
Free with trial A close-up shot reveals a vibrant red line graph sharply declining on a dark blue screen depicting a negative trend in the stock market The image represents financial loss investment risk and market downturn Ideal for illustrating economic instability. Decrease financial trends illustrations Close up Red Stock Market Graph Showing Decline Financial Loss Investment Risk AI generated. A close-up shot reveals a vibrant red line graph sharply declining on a dark blue screen depicting a negative trend in the stock market The image represents financial loss investment risk and market downturn Ideal for illustrating economic instability
Free with trial A striking image depicting a large red arrow pointing downwards dramatically superimposed on a stack of financial reports and charts This powerful visual metaphor represents a market downturn or economic crisis Ideal for illustrating articles or presentations on financial instability. Decrease financial trends illustrations Financial Crisis Concept Red Arrow Falling on Stock Market Reports and Charts AI generated. A striking image depicting a large red arrow pointing downwards dramatically superimposed on a stack of financial reports and charts This powerful visual metaphor represents a market downturn or economic crisis Ideal for illustrating articles or presentations on financial instability
Free with trial A dynamic visual representation showcases interest rate volatility, featuring fluctuating lines, percentage symbols, and financial data analysis. The display creates a sense of market flux and economic shifts. Ideal for illustrating financial news, investment strategies, economic forecasts, and mark. Decrease financial trends illustrations Interest Rate Volatility Display Showing Financial Data Trends and Fluctuations for Market Analysis. A dynamic visual representation showcases interest rate volatility, featuring fluctuating lines, percentage symbols, and financial data analysis. The display creates a sense of market flux and economic shifts. Ideal for illustrating financial news, investment strategies, economic forecasts, and mark
Free with trial San Francisco skyline with a financial chart overlay showing red downward trends, glowing data, and buildings in the background, symbolizing market crisis. Decrease financial trends illustrations Double exposure of San Francisco skyline and financial stock market chart with red downward trend, glowing data points, and. San Francisco skyline with a financial chart overlay showing red downward trends, glowing data, and buildings in the background, symbolizing market crisis
Free with trial Different coins background with negative trends arrows. Decrease financial trends illustrations Different coins with negative trends arrows. Different coins background with negative trends arrows
Free with trial This dramatic AI-generated visualization features a prominent 3D red decline arrow falling sharply against a shadowed, professional gray backdrop. Perfect for business professionals and marketers seeking to illustrate financial loss, negative trends, or economic recession data with a powerful, metaphorical image. Decrease financial trends illustrations Curved 3D red arrow pointing downward on a dark background showing financial or economic decline. This dramatic AI-generated visualization features a prominent 3D red decline arrow falling sharply against a shadowed, professional gray backdrop. Perfect for business professionals and marketers seeking to illustrate financial loss, negative trends, or economic recession data with a powerful, metaphorical image.
Free with trial Minimalist 3D of pastel geometric shapes symbolizing financial growth, investment, profit, success, and progress. Great for illustrating your unique designs or attracting customer attention. Clear area for showcasing your products, copy space, banner, marketing. This AI image graphic representation. Generative AI. Decrease financial trends illustrations Pastel Geometric Financial Growth Minimalist Marketing Minimalist 3D of pastel geometric shapes symbolizing financial growth. Minimalist 3D of pastel geometric shapes symbolizing financial growth, investment, profit, success, and progress. Great for illustrating your unique designs or attracting customer attention. Clear area for showcasing your products, copy space, banner, marketing. This AI image graphic representation. Generative AI
Free with trial A modern graphic illustration of cryptocurrency coins and market trends. this image shows a fluctuating line graph representing the ups and downs of digital currency trading and financial investment concepts. Decrease financial trends vectors Modern graphic illustration of cryptocurrency coins with a fluctuating financial market line graph. a modern graphic illustration of cryptocurrency coins and market trends. this image shows a fluctuating line graph representing the ups and downs of digital currency trading and financial investment concepts
Free with trial A close-up image depicting a red arrow pointing downwards positioned on a stack of documents and charts This represents a financial downturn or business decline illustrating concepts such as market crisis or economic loss A laptop is visible in the background. Decrease financial trends illustrations Financial Decline Red Arrow on Stack of Documents and Charts Showing Business Downturn AI generated. A close-up image depicting a red arrow pointing downwards positioned on a stack of documents and charts This represents a financial downturn or business decline illustrating concepts such as market crisis or economic loss A laptop is visible in the background
Free with trial City skyline with financial chart overlay showing downward trends, sunset backdrop, double exposure style, concept of market crash and business loss. Decrease financial trends illustrations Financial crisis and market downturn graph overlay on city skyline with sunset backdrop, emphasizing commercial property and real. City skyline with financial chart overlay showing downward trends, sunset backdrop, double exposure style, concept of market crash and business loss
Free with trial Vibrant financial chart with colorful bars stands out against a soft focus background of city lights, embodying modern analytics and market trends. Decrease financial trends illustrations Abstract Financial Analysis with Colorful Chart Bars Overlaid on Blurred City Lights in Night Setting. Vibrant financial chart with colorful bars stands out against a soft focus background of city lights, embodying modern analytics and market trends
Free with trial A businessman analyzing mortgage rates on his phone. the image shows a house symbol with a percentage sign inside, with downward arrows indicating decreasing rates. smart financial decisions are key. Decrease financial trends illustrations Understand current mortgage rates and home loan interest rates with mobile app for smart financial decisions. a businessman analyzing mortgage rates on his phone. the image shows a house symbol with a percentage sign inside, with downward arrows indicating decreasing rates. smart financial decisions are key.
Free with trial Declining graph with downward arrow illustrating economic recession and financial loss over time for business. Decrease financial trends vectors Declining graph with downward arrow illustrating economic recession and financial loss over time for business
Free with trial Financial Capability Month Colorful graphs and charts representing financial data analysis on desk. Decrease financial trends illustrations Financial Capability Month Colorful graphs and charts representing financial data analysis on desk
Free with trial Visualizing india's economic downturn with a stock market crash chart. the red graph highlights financial recession, data analysis, and downward trends on the map, indicating a crisis situation. Decrease financial trends illustrations India economic crisis stock market crash concept financial recession chart graph down trend analysis data map. visualizing india's economic downturn with a stock market crash chart. the red graph highlights financial recession, data analysis, and downward trends on the map, indicating a crisis situation.
Free with trial Three dimensional blue arrows and plus sign representing growth, progress, increase, decrease, statistics, data analysis, business, finance, charts, and trends. Decrease financial trends vectors Three dimensional blue arrows and plus sign symbolizing growth progress increase decrease statistics data analysis. Three dimensional blue arrows and plus sign representing growth, progress, increase, decrease, statistics, data analysis, business, finance, charts, and trends
Free with trial Visualize the global financial downturn with this striking image featuring a red-toned world map and dollar icons, highlighted by descending 3D arrows. Decrease financial trends illustrations Downward Financial Trends Indicated by Red 3D Arrows on World Map. Visualize the global financial downturn with this striking image featuring a red-toned world map and dollar icons, highlighted by descending 3D arrows.
Free with trial A professional set of icons depicting various data chart types, including exponential growth, volatility, and linear trends for business analytics and reporting. Decrease financial trends illustrations Collection of professional data graph icons illustrating different growth patterns and financial statistics trends. a professional set of icons depicting various data chart types, including exponential growth, volatility, and linear trends for business analytics and reporting
Free with trial A close up view of golden digital currency coins on a financial candlestick chart. this image represents the volatility and trading patterns of the modern cryptocurrency market and global economy. Decrease financial trends vectors Golden digital currency coins placed over a financial candlestick chart showing market volatility and trading trends. a close up view of golden digital currency coins on a financial candlestick chart. this image represents the volatility and trading patterns of the modern cryptocurrency market and global economy
Free with trial A prominent red arrow dramatically descends diagonally across a textured gray backdrop, visually representing a sharp decline in market performance, economic downturn, or financial losses. Decrease financial trends illustrations Sharp red downward arrow graph symbolizing financial decline and economic recession trends. A prominent red arrow dramatically descends diagonally across a textured gray backdrop, visually representing a sharp decline in market performance, economic downturn, or financial losses
Free with trial The image showcases a collection of 3D graphical elements representing different business and market performance metrics. It includes growth percentages, market share gains, pie charts, bar graphs, and target indicators. Each element highlights positive and negative trends, market shares, and growth rates, useful for illustrating financial reports, business presentations, or performance analyses. Decrease financial trends illustrations Visual representation of various business performance metrics and market growth indicators isolated on white background. The image showcases a collection of 3D graphical elements representing different business and market performance metrics. It includes growth percentages, market share gains, pie charts, bar graphs, and target indicators. Each element highlights positive and negative trends, market shares, and growth rates, useful for illustrating financial reports, business presentations, or performance analyses.
Free with trial A glowing red zigzag arrow points downward, representing a decline on a digital financial chart. The surface is gridded and dark, highlighting the red of the arrow. The arrow has a neon-like appearance and reflects off the glossy surface, signaling a decrease in value. The surrounding chart includes descending graphical elements indicating fluctuating data, conveying a downturn in financial performance or market trends. Decrease financial trends illustrations A large red arrow points downwards over a gridded financial chart showing a sharp decline in value. A glowing red zigzag arrow points downward, representing a decline on a digital financial chart. The surface is gridded and dark, highlighting the red of the arrow. The arrow has a neon-like appearance and reflects off the glossy surface, signaling a decrease in value. The surrounding chart includes descending graphical elements indicating fluctuating data, conveying a downturn in financial performance or market trends.
Free with trial A glowing red zigzag arrow points downward, representing a decline on a digital financial chart. The surface is gridded and dark, highlighting the red of the arrow. The arrow has a neon-like appearance and reflects off the glossy surface, signaling a decrease in value. The surrounding chart includes descending graphical elements indicating fluctuating data, conveying a downturn in financial performance or market trends. Decrease financial trends illustrations A large red arrow points downwards over a gridded financial chart showing a sharp decline in value. A glowing red zigzag arrow points downward, representing a decline on a digital financial chart. The surface is gridded and dark, highlighting the red of the arrow. The arrow has a neon-like appearance and reflects off the glossy surface, signaling a decrease in value. The surrounding chart includes descending graphical elements indicating fluctuating data, conveying a downturn in financial performance or market trends.
Free with trial A glowing red zigzag arrow points downward, representing a decline on a digital financial chart. The surface is gridded and dark, highlighting the red of the arrow. The arrow has a neon-like appearance and reflects off the glossy surface, signaling a decrease in value. The surrounding chart includes descending graphical elements indicating fluctuating data, conveying a downturn in financial performance or market trends. Decrease financial trends illustrations A large red arrow points downwards over a gridded financial chart showing a sharp decline in value. A glowing red zigzag arrow points downward, representing a decline on a digital financial chart. The surface is gridded and dark, highlighting the red of the arrow. The arrow has a neon-like appearance and reflects off the glossy surface, signaling a decrease in value. The surrounding chart includes descending graphical elements indicating fluctuating data, conveying a downturn in financial performance or market trends.
Free with trial The image showcases a collection of 3D graphical elements representing different business and market performance metrics. It includes growth percentages, market share gains, pie charts, bar graphs, and target indicators. Each element highlights positive and negative trends, market shares, and growth rates, useful for illustrating financial reports, business presentations, or performance analyses. Decrease financial trends illustrations Visual representation of various business performance metrics and market growth indicators isolated on white background. The image showcases a collection of 3D graphical elements representing different business and market performance metrics. It includes growth percentages, market share gains, pie charts, bar graphs, and target indicators. Each element highlights positive and negative trends, market shares, and growth rates, useful for illustrating financial reports, business presentations, or performance analyses.
Free with trial Decreasing Bar Chart with Arrow: Economic Decline Visualization, Business Graph, Financial Performance Overview, Downward Trend Graphic. Decrease financial trends vectors Decreasing Bar Chart with Arrow: Economic Decline Visualization, Business Graph, Financial Performance Overview, Downward Trend
Free with trial Trend down graph icon. stock icon on white background. flat style. financial market crash icon for your web site design, logo, app, UI. graph chart downtrend symbol. chart going down sign. Decrease financial trends vectors Trend down graph icon. stock icon on white background. flat style. financial market crash icon for your web site design, logo, app
Free with trial Business analytics, data visualization, market research, financial reports, and growth strategies are symbolized in this image. Elegant empty space crafted for branding, ads, and product presentations. Suitable for marketing campaigns and creative displays. . Generative AI. Decrease financial trends illustrations Colorful Data Charts and Graphs on White Background Business analytics data visualization market research financial reports. Business analytics, data visualization, market research, financial reports, and growth strategies are symbolized in this image. Elegant empty space crafted for branding, ads, and product presentations. Suitable for marketing campaigns and creative displays. . Generative AI
Free with trial Blue stacked arrows illustrate financial growth, market trends. Graphic displays upward, downward movement, signifying progress, decline in business economy. Represents strategy,. Decrease financial trends illustrations Blue stacked arrows illustrate financial growth, market trends. Graphic displays upward, downward movement, signifying progress
Free with trial Curved red down arrow and green up arrow icons for visualizing growth, decline, trends, performance metrics, charts, and financial data. Decrease financial trends vectors Curved red down and green up arrows for growth and decline indicators. Curved red down arrow and green up arrow icons for visualizing growth, decline, trends, performance metrics, charts, and financial data
Free with trial The visual depicts a financial bar chart in a minimalist style, showcasing a decline with bars in gradient hues, creating a striking contrast against a dark background. Decrease financial trends illustrations A minimalist representation of a collapsing financial bar chart with vibrant colors. The visual depicts a financial bar chart in a minimalist style, showcasing a decline with bars in gradient hues, creating a striking contrast against a dark background.
Free with trial A businessman stands with arms outstretched holding 'Buy' and 'Sell' signs, visually representing market trends and investment decisions for use in financial illustrations. Decrease financial trends illustrations Buy Sell Indicator for Stock Trader. A businessman stands with arms outstretched holding 'Buy' and 'Sell' signs, visually representing market trends and investment decisions for use in financial illustrations
Free with trial Financial success and investment strategy depicted through Gross Domestic Product GDP, stock market analysis, currency fluctuations, banking, and accounting. Decrease financial trends illustrations Gross Domestic Product GDP concept displaying economic analysis, stock market trends, and financial growth for intelligent invest. Financial success and investment strategy depicted through Gross Domestic Product GDP, stock market analysis, currency fluctuations, banking, and accounting
Free with trial Metallic financial fluctuation concept with dollar symbol, green arrow pointing up indicating growth, and red arrow pointing down for decrease. Market trends and investment. Economy changes. Decrease financial trends illustrations Metallic Dollar Sign With Green Up Arrow And Red Down Arrow Representing Financial Fluctuation. Metallic financial fluctuation concept with dollar symbol, green arrow pointing up indicating growth, and red arrow pointing down for decrease. Market trends and investment. Economy changes
Free with trial A clean, minimalist bar chart displays a gradual decline in financial performance, with rising bars depicted in soft blue against a serene teal background. Decrease financial trends illustrations Minimalist financial bar chart illustrating gradual decline in economic performance. A clean, minimalist bar chart displays a gradual decline in financial performance, with rising bars depicted in soft blue against a serene teal background.
Free with trial Description: This abstract image depicts a financial stock market trading chart with a gold arrow pointing downwards on a blue background. The downtrend of the arrow symbolizes a decrease in stock prices or market performance. The contrasting colors and geometric shapes convey a sense of complexity and volatility in the financial market. This image can be used to represent concepts such as market analysis, investment strategies, and economic trends. Decrease financial trends illustrations Abstract Financial Stock Market Trading Chart with Gold Arrow Downtrend on Blue Background. Description: This abstract image depicts a financial stock market trading chart with a gold arrow pointing downwards on a blue background. The downtrend of the arrow symbolizes a decrease in stock prices or market performance. The contrasting colors and geometric shapes convey a sense of complexity and volatility in the financial market. This image can be used to represent concepts such as market analysis, investment strategies, and economic trends.
Free with trial This abstract financial stock market trading chart with a gold arrow downtrend on a blue background conveys the concept of market volatility and uncertainty. The downward trend of the gold arrow symbolizes a decrease in stock prices or economic instability. The blue background may represent calmness or trust in the financial system despite the fluctuations. This image captures the essence of the dynamic nature of the stock market and the importance of monitoring trends for successful trading strategies. Decrease financial trends illustrations Abstract Financial Stock Market Trading Chart with Gold Arrow Downtrend on Blue Background. This abstract financial stock market trading chart with a gold arrow downtrend on a blue background conveys the concept of market volatility and uncertainty. The downward trend of the gold arrow symbolizes a decrease in stock prices or economic instability. The blue background may represent calmness or trust in the financial system despite the fluctuations. This image captures the essence of the dynamic nature of the stock market and the importance of monitoring trends for successful trading strategies.
Free with trial These clean, isolated upward and downward green and red arrows are ideal for illustrating various data visualization concepts. Perfect for presentations, reports, infographics, and marketing materials, they effectively communicate growth and decline trends in business, finance, or any field requiring visual representation of progress. The simple, modern design ensures the focus remains on the. Decrease financial trends illustrations Simple Green and Red Arrows Isolated Vector Graphics for Visualizing Growth and Decline Trends in Business Data. These clean, isolated upward and downward green and red arrows are ideal for illustrating various data visualization concepts. Perfect for presentations, reports, infographics, and marketing materials, they effectively communicate growth and decline trends in business, finance, or any field requiring visual representation of progress. The simple, modern design ensures the focus remains on the
Free with trial This abstract artwork illustrates financial market dynamics with intricate lines and colors, representing stock price movements and trading patterns artistically. Decrease financial trends illustrations Abstract financial market analysis with intricate lines depicting stock price movements and trading patterns in shades of black. This abstract artwork illustrates financial market dynamics with intricate lines and colors, representing stock price movements and trading patterns artistically
Free with trial The visualization displays a collapsing financial bar chart, illustrating a significant decrease in financial metrics with a clean, minimalist aesthetic. Decrease financial trends illustrations Visual representation of financial decline using a collapsing bar chart in a modern design. The visualization displays a collapsing financial bar chart, illustrating a significant decrease in financial metrics with a clean, minimalist aesthetic.
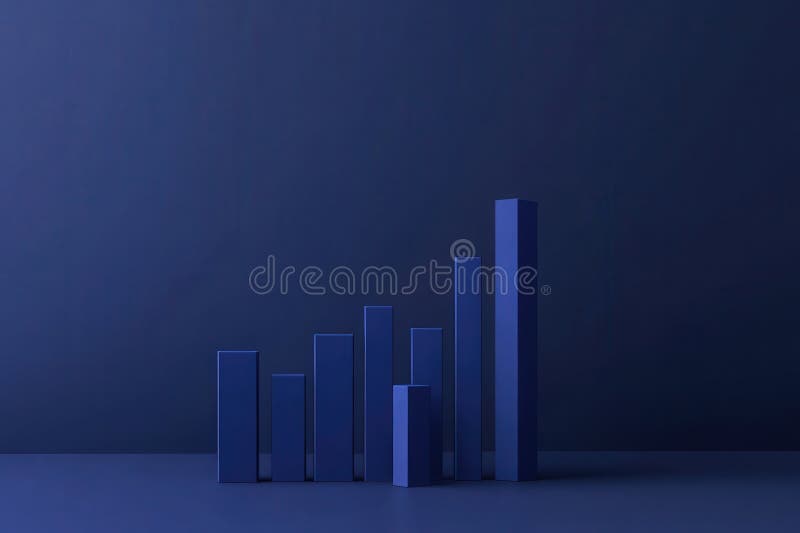
Free with trial The visual displays a clean and minimalist bar chart, illustrating a notable decrease in financial performance over a recent quarter, with a focus on dark blue tones to enhance impact. Decrease financial trends illustrations Minimalist financial bar chart showing significant decline in earnings over the past quarter. The visual displays a clean and minimalist bar chart, illustrating a notable decrease in financial performance over a recent quarter, with a focus on dark blue tones to enhance impact.
Free with trial Risk Minimization spotlighted. Professionals navigate financial charts, with rising arrows denoting growth. Compass points to reduced risk. Safety and strategy emphasized. Flat vector illustration. Decrease financial trends vectors Risk Minimization spotlighted. Professionals navigate financial charts
Free with trial Market trend icon in flat style. Decline arrow with magnifier vector illustration on white isolated background. Decrease business concept. Decrease financial trends vectors Market trend icon in flat style. Decline arrow with magnifier vector illustration on white isolated background. Decrease business
Free with trial Image displaying stock market chart, rising or falling trends Generative AI. Decrease financial trends illustrations Image displaying stock market chart, rising or falling trends
Free with trial Mix race traders analyzing falling down stock market trading graph candlestick chart financial investment economy trends concept horizontal copy space vector illustration. Decrease financial trends vectors Mix race traders analyzing falling down stock market trading graph candlestick chart financial investment
Free with trial Mix race traders hands analyzig falling down stock market trading graph candlestick chart financial investment economy trends concept horizontal vector illustration. Decrease financial trends vectors Mix race traders hands analyzig falling down stock market trading graph candlestick chart financial investment
Free with trial Trader hand analyzing falling down stock market trading graph candlestick chart on smartphone screen financial investment economy trends concept horizontal vector illustration. Decrease financial trends vectors Trader hand analyzing falling down stock market trading graph candlestick chart on smartphone screen financial
Free with trial Trader hand analyzing falling down stock market trading graph candlestick chart on smartphone screen financial investment economy trends concept vertical vector illustration. Decrease financial trends vectors Trader hand analyzing falling down stock market trading graph candlestick chart on smartphone screen financial