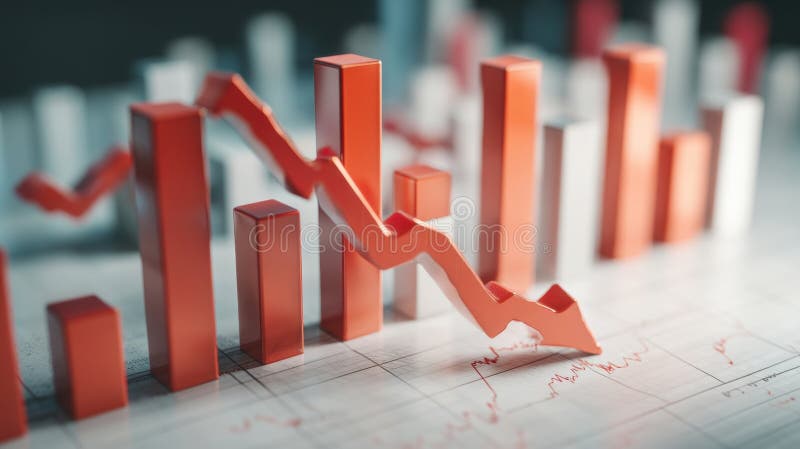
Free with trial Photo Interest rate and mortgage rates rise, financial growth concept Vertical Mobile Wallpaper. Decrease financial trends illustrations Photo Interest rate and mortgage rates rise, financial growth concept
Free with trial Bag labeled Inflation beside red upward graph, indicating financial trends For Social Media Post Size. Decrease financial trends illustrations Bag labeled Inflation beside red upward graph, indicating financial trends
Free with trial A collection of minimalist outline icons depicting economic recession, financial crisis, and downturn related concepts. Perfect for illustrating articles, presentations, or websites focused on economic issues and market trends. Decrease financial trends vectors Minimalist Outline Economic Recession And Financial Crisis Icon Set Illustration. A collection of minimalist outline icons depicting economic recession, financial crisis, and downturn related concepts. Perfect for illustrating articles, presentations, or websites focused on economic issues and market trends.
Free with trial Photo Interest rate and mortgage rates rise, financial growth concept For Social Media Post Size. Decrease financial trends illustrations Photo Interest rate and mortgage rates rise, financial growth concept
Free with trial Photo Interest rate and mortgage rates rise, financial growth concept Vertical Mobile Wallpaper. Decrease financial trends illustrations Photo Interest rate and mortgage rates rise, financial growth concept
Free with trial Photo Interest rate and mortgage rates rise, financial growth concept Vertical Mobile Wallpaper. Decrease financial trends illustrations Photo Interest rate and mortgage rates rise, financial growth concept
Free with trial Photo Interest rate and mortgage rates rise, financial growth concept Generative AI. Decrease financial trends illustrations Photo Interest rate and mortgage rates rise, financial growth concept
Free with trial Photo Interest rate and mortgage rates rise, financial growth concept Generative AI. Decrease financial trends illustrations Photo Interest rate and mortgage rates rise, financial growth concept
Free with trial Risk Minimization spotlighted dark or night mode web, landing. Professionals navigate financial charts, with rising arrows denoting growth. Compass points to reduced risk. Flat vector illustration. Decrease financial trends vectors Risk Minimization spotlighted. Professionals navigate financial charts. Risk Minimization spotlighted dark or night mode web, landing. Professionals navigate financial charts, with rising arrows denoting growth. Compass points to reduced risk. Flat vector illustration.
Free with trial A 3D rendering showing stacks of coins under a magnifying glass focusing on a bar graph, generated by AI. This image symbolizes financial analysis, investment, and wealth management. It's perfect for illustrating articles or presentations related to economic trends and monetary growth. Decrease financial trends illustrations Financial Analysis Magnifier. A 3D rendering showing stacks of coins under a magnifying glass focusing on a bar graph, generated by AI. This image symbolizes financial analysis, investment, and wealth management. It's perfect for illustrating articles or presentations related to economic trends and monetary growth.
Free with trial Close-up of a digital stock market ticker showing share symbols, prices, percentage changes, and market index performance. The display features rising and falling stocks, market fluctuations, and trading data. Ideal for financial concepts, investment visuals, stock exchange, market trends, trading platforms, finance news, economic reports, and financial presentations. Decrease financial trends illustrations Stock Market Ticker Display – Financial Data, Shares, and Index Performance. Close-up of a digital stock market ticker showing share symbols, prices, percentage changes, and market index performance. The display features rising and falling stocks, market fluctuations, and trading data. Ideal for financial concepts, investment visuals, stock exchange, market trends, trading platforms, finance news, economic reports, and financial presentations.
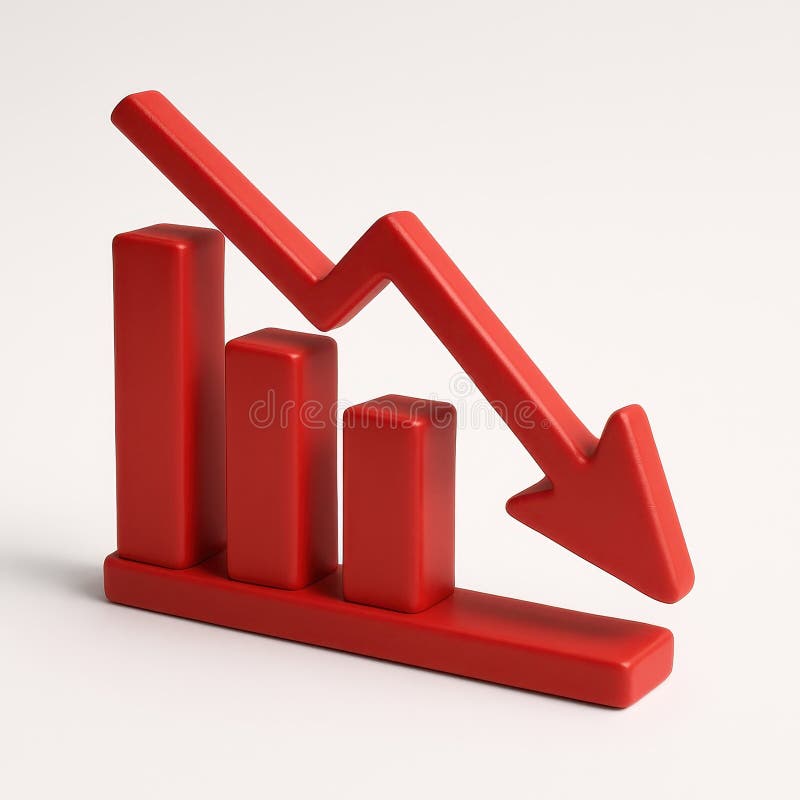
Free with trial This image depicts a 3D rendering of a downward trending graph, generated by AI, showcasing a clear visual representation of market decline or economic downturn. The red bars and arrow emphasize the severity of the fall, suggesting potential financial instability or crisis. Decrease financial trends illustrations Declining Market Trends. This image depicts a 3D rendering of a downward trending graph, generated by AI, showcasing a clear visual representation of market decline or economic downturn. The red bars and arrow emphasize the severity of the fall, suggesting potential financial instability or crisis.
Free with trial This image shows a whiteboard displaying a bar graph with a downward trend, generated by AI. The graph illustrates a clear decline in performance over time, potentially indicating financial losses or market setbacks. The simple, clean presentation highlights the severity of the decrease. Decrease financial trends illustrations Declining Business Graph. This image shows a whiteboard displaying a bar graph with a downward trend, generated by AI. The graph illustrates a clear decline in performance over time, potentially indicating financial losses or market setbacks. The simple, clean presentation highlights the severity of the decrease.
Free with trial Vector icon of a downward arrow or falling graph, symbolizing financial decline, loss trends, market crash, and negative economic performance. Ideal for finance apps, investment platforms, business reports, stock market analysis, and economic infographics. Clean, impactful, and scalable for both digital and print use. Decrease financial trends vectors Financial Decline Trend Loss Graph Icon. Vector icon of a downward arrow or falling graph, symbolizing financial decline, loss trends, market crash, and negative economic performance. Ideal for finance apps, investment platforms, business reports, stock market analysis, and economic infographics. Clean, impactful, and scalable for both digital and print use.
Free with trial A close-up view of a laptop displaying a stock market chart with fluctuating trends, illustrating concepts of financial volatility and market analysis - generated AI. Decrease financial trends illustrations Stock market crash concept with graph on laptop screen. A close-up view of a laptop displaying a stock market chart with fluctuating trends, illustrating concepts of financial volatility and market analysis - generated AI
Free with trial A modern flat design icon representing financial data analysis and market trends. This vector illustration features a combination of a green bar chart and a dark grey line graph, showing fluctuations in performance. An upward arrow indicates initial growth, followed by a volatile trend line symbolizing concepts like market instability, economic changes, profit and loss, or business analytics. This versatile graphic is perfect for infographics, financial reports, presentations, websites, and applications related to business, finance, statistics, and economics. Isolated on a white background for easy use. Decrease financial trends vectors Financial Market Fluctuation Graph Icon. A modern flat design icon representing financial data analysis and market trends. This vector illustration features a combination of a green bar chart and a dark grey line graph, showing fluctuations in performance. An upward arrow indicates initial growth, followed by a volatile trend line symbolizing concepts like market instability, economic changes, profit and loss, or business analytics. This versatile graphic is perfect for infographics, financial reports, presentations, websites, and applications related to business, finance, statistics, and economics. Isolated on a white background for easy use.
Free with trial A close-up shot of a hand interacting with a digital stock market chart. The chart displays candlestick patterns and percentage changes, representing fluctuating market values. The image conveys concepts of financial analysis, investment strategy, and data-driven decision making in the stock market. Suitable for illustrating articles or presentations related to finance, trading, and economic trends. Decrease financial trends illustrations Analyzing Stock Market Trends. A close-up shot of a hand interacting with a digital stock market chart. The chart displays candlestick patterns and percentage changes, representing fluctuating market values. The image conveys concepts of financial analysis, investment strategy, and data-driven decision making in the stock market. Suitable for illustrating articles or presentations related to finance, trading, and economic trends.
Free with trial A powerful graphic illustration captures the essence of a financial bear market. A formidable bear stands against a red backdrop as a sharp arrow trends downwards, symbolizing economic recession, stock market downturns, and the inherent risks of investment. This modern and stylized design is perfect for concepts related to financial crisis, economic challenges, and trading. Decrease financial trends illustrations Bear Market Trend Financial Illustration. A powerful graphic illustration captures the essence of a financial bear market. A formidable bear stands against a red backdrop as a sharp arrow trends downwards, symbolizing economic recession, stock market downturns, and the inherent risks of investment. This modern and stylized design is perfect for concepts related to financial crisis, economic challenges, and trading
Free with trial Close-up of various financial charts and graphs displayed on a dark screen, with blue and orange color schemes. Image. Decrease financial trends illustrations Financial Data Charts and Graphs on Screen. Close-up of various financial charts and graphs displayed on a dark screen, with blue and orange color schemes. Image
Free with trial A pair of hands gently cradles four small, wooden house models against a backdrop of financial charts and graphs. The image evokes concepts of real estate investment, market analysis, and the security of owning property. The wooden houses symbolize homes and the charts represent market trends, making it suitable for illustrating financial articles, investment advice, or real estate services. Decrease financial trends illustrations Real Estate Market Analysis and Investment. A pair of hands gently cradles four small, wooden house models against a backdrop of financial charts and graphs. The image evokes concepts of real estate investment, market analysis, and the security of owning property. The wooden houses symbolize homes and the charts represent market trends, making it suitable for illustrating financial articles, investment advice, or real estate services.
Free with trial Abstract digital illustration of a financial chart. A glowing white line graph rises and falls against a blue background with a grid pattern made of dots. The image conveys concepts of market trends, stock analysis, investment, and economic fluctuations. Suitable for illustrating financial reports, business presentations, and technology-related articles. Decrease financial trends illustrations Abstract Financial Chart with Glowing Line. Abstract digital illustration of a financial chart. A glowing white line graph rises and falls against a blue background with a grid pattern made of dots. The image conveys concepts of market trends, stock analysis, investment, and economic fluctuations. Suitable for illustrating financial reports, business presentations, and technology-related articles.
Free with trial 3D rendering of a dynamic presentation stand showcasing financial data. Colorful, geometric shapes and infographics present market statistics, including percentages, dollar amounts, and bar graphs. Stacks of coins and various data elements are displayed on a dark blue platform with orange accents. Suitable for illustrating financial reports, market analysis, investment strategies, or business presentations. Decrease financial trends illustrations Modern Financial Data Visualization Display. 3D rendering of a dynamic presentation stand showcasing financial data. Colorful, geometric shapes and infographics present market statistics, including percentages, dollar amounts, and bar graphs. Stacks of coins and various data elements are displayed on a dark blue platform with orange accents. Suitable for illustrating financial reports, market analysis, investment strategies, or business presentations.
Free with trial A red line graph trends downward against a dark background, suggesting a decline or negative trend, which can be used in business presentations or financial reports. Decrease financial trends illustrations Decreasing Red Line Graph on Black Background. A red line graph trends downward against a dark background, suggesting a decline or negative trend, which can be used in business presentations or financial reports
Free with trial A hand-drawn illustration depicting a presentation on data trends. A stick figure presenter, holding a microphone, points to a chart on a screen labeled "DATA TRENDS. " The chart displays a line graph and bar graphs, suggesting growth and analysis. This image is suitable for illustrating business concepts, data analysis, presentations, and financial reports. It conveys a sense of information, communication, and progress. Decrease financial trends vectors Data Presentation: Business Trends and Analysis. A hand-drawn illustration depicting a presentation on data trends. A stick figure presenter, holding a microphone, points to a chart on a screen labeled "DATA TRENDS." The chart displays a line graph and bar graphs, suggesting growth and analysis. This image is suitable for illustrating business concepts, data analysis, presentations, and financial reports. It conveys a sense of information, communication, and progress.
Free with trial A 3D illustration of a downwards statistic chart, isolated on white background, symbolizing decline, loss, or decrease in trends. Decrease financial trends illustrations Statistic down 3D illustration isolated on white background. A 3D illustration of a downwards statistic chart, isolated on white background, symbolizing decline, loss, or decrease in trends
Free with trial A 3D illustration of a downwards statistic chart, isolated on white background, symbolizing decline, loss, or decrease in trends. Decrease financial trends illustrations Statistic down 3D illustration isolated on white background. A 3D illustration of a downwards statistic chart, isolated on white background, symbolizing decline, loss, or decrease in trends
Free with trial Wooden block with the time to fix the system symbol. The process of solving complex problems. Resolving the company's declining financial issues. Marketing Trends concept. Set Trend Modern vector flat illustration. Decrease financial trends vectors The process of solving complex problems.
Free with trial 3D illustration of stacked gold coins with a red downward arrow, symbolizing financial loss, market decline, or economic downturn. Perfect for finance presentations, investment reports, economic analysis, and business-related visuals showing negative trends. Decrease financial trends illustrations 3D Gold Coins with Red Down Arrow – Financial Decline Concept. 3D illustration of stacked gold coins with a red downward arrow, symbolizing financial loss, market decline, or economic downturn. Perfect for finance presentations, investment reports, economic analysis, and business-related visuals showing negative trends.
Free with trial Cheerful cartoon businessman reviewing positive financial data upward trending graph. Decrease financial trends illustrations Happy Businessman Analyzing Financial Growth Charts. Cheerful cartoon businessman reviewing positive financial data upward trending graph.
Free with trial This abstract 3D rendered image showcases three prominent white candlestick-like objects, symbolizing financial growth and market trends. Positioned against a dark, gridded background, a subtle financial chart with smaller red and white candlesticks and wicks extends into the distance, reinforcing the theme of data analysis and investment. The clean, modern aesthetic makes it ideal for illustrating concepts related to stock market performance, cryptocurrency trading, economic growth, financial planning, and digital business strategies. It effectively conveys ideas of progress, success, and the dynamic nature of global markets. Decrease financial trends illustrations 3D Financial Candlestick Chart Representing Market Growth. This abstract 3D rendered image showcases three prominent white candlestick-like objects, symbolizing financial growth and market trends. Positioned against a dark, gridded background, a subtle financial chart with smaller red and white candlesticks and wicks extends into the distance, reinforcing the theme of data analysis and investment. The clean, modern aesthetic makes it ideal for illustrating concepts related to stock market performance, cryptocurrency trading, economic growth, financial planning, and digital business strategies. It effectively conveys ideas of progress, success, and the dynamic nature of global markets.
Free with trial Laptop displaying a graph, visualizing data analysis and market trends for business decisions ,Generative ai. Decrease financial trends illustrations Laptop with graph, data analysis for market trends and business decisions. Laptop displaying a graph, visualizing data analysis and market trends for business decisions ,Generative ai
Free with trial A vibrant, modern icon depicting a financial growth chart, representing investment and market analysis. The design features ascending lines and bars, suggesting positive trends. This graphic was generated by AI for illustrative purposes. A representation of financial success. Decrease financial trends illustrations Financial Growth Chart Icon - Business Investment Concept. A vibrant, modern icon depicting a financial growth chart, representing investment and market analysis. The design features ascending lines and bars, suggesting positive trends. This graphic was generated by AI for illustrative purposes. A representation of financial success.
Free with trial A series of black bar graphs are shown with downward-pointing arrows. Some arrows are green, indicating a slight decline, while others are red, signifying a more significant drop. The visual represents financial or data trends of decrease. Decrease financial trends illustrations Bar Graphs with Downward Arrows in Green and Red downward trend. A series of black bar graphs are shown with downward-pointing arrows. Some arrows are green, indicating a slight decline, while others are red, signifying a more significant drop. The visual represents financial or data trends of decrease
Free with trial 3D colorful bar chart, pie chart, rising arrow, dollar sign, and stacks of coins illustrate financial growth and success. Perfect for business, finance, and investment presentations. Decrease financial trends illustrations Financial Growth Chart with Dollar Sign and Coin Stacks. 3D colorful bar chart, pie chart, rising arrow, dollar sign, and stacks of coins illustrate financial growth and success. Perfect for business, finance, and investment presentations.
Free with trial A collection of twelve black and white vector icons representing various financial concepts. The set includes bar charts and line graphs illustrating growth and trends, a piggy bank for savings, bank buildings symbolizing financial institutions, a safe for security, currency symbols (dollar, euro, yen), and credit debit cards for payments. These icons are ideal for websites, presentations, and applications related to finance, economics, business, and personal money management. Decrease financial trends vectors Financial Icons Set: Growth, Savings, Banking, and Payments. A collection of twelve black and white vector icons representing various financial concepts. The set includes bar charts and line graphs illustrating growth and trends, a piggy bank for savings, bank buildings symbolizing financial institutions, a safe for security, currency symbols (dollar, euro, yen), and credit debit cards for payments. These icons are ideal for websites, presentations, and applications related to finance, economics, business, and personal money management.
Free with trial A wooden block with a dollar sign on top of a stack of coins with a red down arrow. This image symbolizes a decline in value and can be used to illustrate financial trends, economic recession, or other concepts related to money and investment. Decrease financial trends illustrations Dollar Sign on Wooden Block on Stack of Coins with Down Arrow. A wooden block with a dollar sign on top of a stack of coins with a red down arrow. This image symbolizes a decline in value and can be used to illustrate financial trends, economic recession, or other concepts related to money and investment
Free with trial 3D bar chart with red arrows pointing upwards, reflecting off a shiny, blue surface. The clean, minimalist design symbolizes financial growth, business success, and positive market trends. Ideal for use in presentations, financial reports, and marketing materials related to investment, stock market, and economic progress. Decrease financial trends illustrations Financial Growth 3D Bar Chart with Red Arrows. 3D bar chart with red arrows pointing upwards, reflecting off a shiny, blue surface. The clean, minimalist design symbolizes financial growth, business success, and positive market trends. Ideal for use in presentations, financial reports, and marketing materials related to investment, stock market, and economic progress
Free with trial 3D bar chart with red arrows pointing upwards, reflecting off a shiny, blue surface. The clean, minimalist design symbolizes financial growth, business success, and positive market trends. Ideal for use in presentations, financial reports, and marketing materials related to investment, stock market, and economic progress. Decrease financial trends illustrations Financial Growth 3D Bar Chart with Red Arrows. 3D bar chart with red arrows pointing upwards, reflecting off a shiny, blue surface. The clean, minimalist design symbolizes financial growth, business success, and positive market trends. Ideal for use in presentations, financial reports, and marketing materials related to investment, stock market, and economic progress
Free with trial 3D coins decrease front isolated on transparent background. Decrease financial trends illustrations 3D coins decrease front isolated on transparent background
Free with trial Calculator alongside arrows indicating increase and decrease, and a line graph with fluctuations. Ideal for finance, budgeting, economics, analysis, statistics, decision-making, simple flat metaphor. Decrease financial trends illustrations Calculator with Arrows and Graph Representing Financial Analysis and Data Trends. Calculator alongside arrows indicating increase and decrease, and a line graph with fluctuations. Ideal for finance, budgeting, economics, analysis, statistics, decision-making, simple flat metaphor
Free with trial A striking visual depicting a golden coin with intricate patterns standing upright against a dark, reflective background. A vibrant, glowing red arrow dramatically points downwards towards the coin, symbolizing financial decline, market downturn, or a significant loss in value. This powerful image effectively conveys concepts like investment risk, economic crisis, depreciation of assets, and falling prices. Ideal for illustrating articles, reports, or presentations on financial challenges, stock market crashes, investment warnings, and economic trends. Decrease financial trends illustrations Golden Coin and Red Downward Arrow: Financial Decline Concept. A striking visual depicting a golden coin with intricate patterns standing upright against a dark, reflective background. A vibrant, glowing red arrow dramatically points downwards towards the coin, symbolizing financial decline, market downturn, or a significant loss in value. This powerful image effectively conveys concepts like investment risk, economic crisis, depreciation of assets, and falling prices. Ideal for illustrating articles, reports, or presentations on financial challenges, stock market crashes, investment warnings, and economic trends.
Free with trial This dynamic 3D render visualizes financial growth and market trends. A series of green bars represents increasing values, overlaid by a prominent green arrow pointing upwards, symbolizing success and positive performance. Contrasting this, a red arrow also indicates a trend, though its path suggests volatility or a different metric. Below, a complex network graph with interconnected nodes and lines adds a layer of data analysis and interconnectedness, suitable for concepts like investment, analytics, and economic forecasting. Decrease financial trends illustrations Upward Trend: Green and Red Arrows Over Bar Chart and Network Graph. This dynamic 3D render visualizes financial growth and market trends. A series of green bars represents increasing values, overlaid by a prominent green arrow pointing upwards, symbolizing success and positive performance. Contrasting this, a red arrow also indicates a trend, though its path suggests volatility or a different metric. Below, a complex network graph with interconnected nodes and lines adds a layer of data analysis and interconnectedness, suitable for concepts like investment, analytics, and economic forecasting.
Free with trial This image shows colorful financial charts and graphs, generated by AI, illustrating various data points and percentages. The overlaid arrows suggest a downward trend, potentially indicating a negative market shift or economic decline. The visual representation aids in quick understanding of compl. Decrease financial trends illustrations Financial Data Analysis. This image shows colorful financial charts and graphs, generated by AI, illustrating various data points and percentages. The overlaid arrows suggest a downward trend, potentially indicating a negative market shift or economic decline. The visual representation aids in quick understanding of compl
Free with trial Three miniature apartment building models are shown against a backdrop of a stock market graph illustrating real estate trends. Decrease financial trends illustrations Apartment Building Models Illustrate Real Estate Market Trends. Three miniature apartment building models are shown against a backdrop of a stock market graph illustrating real estate trends
Free with trial A digital dashboard displaying financial data and market analytics on a desk with potted plants and greenery accents showcasing a modern technology driven workspace for business economics. Decrease financial trends illustrations Financial Data Analytics Display with Greenery Accents on Office Desk. A digital dashboard displaying financial data and market analytics on a desk with potted plants and greenery accents showcasing a modern technology driven workspace for business economics
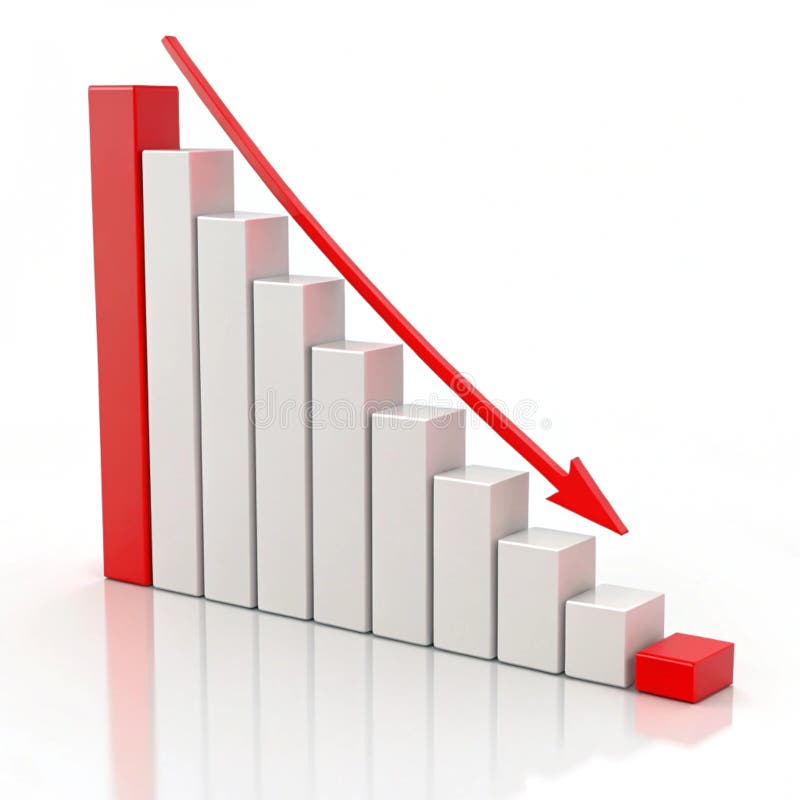
Free with trial A striking 3D render visualizes economic decline with a vibrant red bar graph against a clean white background. This impactful image vividly represents a financial crisis and recession, showcasing a clear downward trend through its falling bars and an implied arrow. It symbolizes loss, failure, and potential bankruptcy within the business and finance sectors. Ideal for illustrating articles on the. Decrease financial trends illustrations Red economic decline bar graph depicting financial downfall and negative trends on white background. A striking 3D render visualizes economic decline with a vibrant red bar graph against a clean white background. This impactful image vividly represents a financial crisis and recession, showcasing a clear downward trend through its falling bars and an implied arrow. It symbolizes loss, failure, and potential bankruptcy within the business and finance sectors. Ideal for illustrating articles on the
Free with trial This image depicts a vibrant and modern representation of financial success, featuring 3D bar graphs, pie charts, and a calculator, all set against a clean white background. The upward-trending graph showcases growth and progress. Decrease financial trends illustrations Colorful 3D Financial Charts and Calculator Showing Business Growth. This image depicts a vibrant and modern representation of financial success, featuring 3D bar graphs, pie charts, and a calculator, all set against a clean white background. The upward-trending graph showcases growth and progress.
Free with trial Red financial chart with a sharp downward trend indicating a market crash or economic decline. The graph features jagged, descending lines with timestamps labeled on the x-axis as 06 231 and 08 231. The dark background enhances the focus on the bright red line, making the steep drop in value evident. Occasional data points are highlighted with small glowing dots, emphasizing key moments. The overall design conveys a sense of urgency and loss in financial markets. Decrease financial trends illustrations Dramatic downward trend financial chart illustrating market crash, economic decline, and losses. Red financial chart with a sharp downward trend indicating a market crash or economic decline. The graph features jagged, descending lines with timestamps labeled on the x-axis as 06 231 and 08 231. The dark background enhances the focus on the bright red line, making the steep drop in value evident. Occasional data points are highlighted with small glowing dots, emphasizing key moments. The overall design conveys a sense of urgency and loss in financial markets.
Free with trial Declining Financial Performance Depicted by Falling Arrows and Coins. Decrease financial trends vectors Declining Financial Performance Depicted by Falling Arrows and Coins
Free with trial This vibrant 3D rendering displays a dynamic bar chart alongside a detailed pie chart, illustrating impressive business growth and financial success. The colorful segments and bars clearly present data, making it perfect for presentations or reports. Decrease financial trends illustrations Colorful 3D Bar and Pie Chart Showing Business Growth and Financial Success. This vibrant 3D rendering displays a dynamic bar chart alongside a detailed pie chart, illustrating impressive business growth and financial success. The colorful segments and bars clearly present data, making it perfect for presentations or reports.
Free with trial This image shows a downward trending stock market graph generated by AI, illustrating a period of significant decline. The detailed chart provides a visual representation of financial instability and potential losses. This AI-generated visualization is useful for understanding market trends and vol. Decrease financial trends illustrations AI-Generated Stock Market Decline. This image shows a downward trending stock market graph generated by AI, illustrating a period of significant decline. The detailed chart provides a visual representation of financial instability and potential losses. This AI-generated visualization is useful for understanding market trends and vol
Free with trial A detailed blue candlestick chart depicting stock market price fluctuations and trends over time Ideal for illustrating financial concepts market analysis and investment strategies The graphic is clean modern and visually engaging. Decrease financial trends illustrations Blue Financial Chart Candlestick Graph Showing Stock Market Trend Analysis. A detailed blue candlestick chart depicting stock market price fluctuations and trends over time Ideal for illustrating financial concepts market analysis and investment strategies The graphic is clean modern and visually engaging
Free with trial This 3D rendering showcases a vibrant bar graph and pie chart, ideal for visualizing business growth, financial reports, and data analysis. The colorful design makes it visually engaging and easy to understand. Decrease financial trends illustrations Colorful 3D Bar and Pie Chart Illustrating Business Growth and Financial Data. This 3D rendering showcases a vibrant bar graph and pie chart, ideal for visualizing business growth, financial reports, and data analysis. The colorful design makes it visually engaging and easy to understand.
Free with trial Stock market chart displaying investment trends with red and blue candlesticks on a dark background. The chart features a timeline labeled by months at the top and numbers at the bottom, illustrating dynamic financial data. Candlesticks show market fluctuations, with red indicating a decrease and blue an increase in value. A faint blue line overlays the candles, representing the moving average. The scene is likely within a financial or trading setting, emphasizing the analysis of market activity. Decrease financial trends illustrations Dynamic stock market chart with vibrant red and blue candles showing investment trends and financial data. Stock market chart displaying investment trends with red and blue candlesticks on a dark background. The chart features a timeline labeled by months at the top and numbers at the bottom, illustrating dynamic financial data. Candlesticks show market fluctuations, with red indicating a decrease and blue an increase in value. A faint blue line overlays the candles, representing the moving average. The scene is likely within a financial or trading setting, emphasizing the analysis of market activity.
Free with trial A 3D rendered blue arrow points downwards, symbolizing a decrease or decline. Attached to the arrow is a pink circular tag with a white percentage symbol, indicating a discount or sale. The graphic is presented on a white background, conveying concepts of price reduction and financial trends. Decrease financial trends illustrations Blue Downward Arrow with Pink Percentage Discount Tag on White Background sale. A 3D rendered blue arrow points downwards, symbolizing a decrease or decline. Attached to the arrow is a pink circular tag with a white percentage symbol, indicating a discount or sale. The graphic is presented on a white background, conveying concepts of price reduction and financial trends
Free with trial Candlestick chart on a dark blue background illustrating stock market trends. Light blue and white candlesticks represent price fluctuations, with wicks indicating high and low values. The chart shows an upward trend, suggesting potential financial growth or investment opportunities. Candlestick charts are commonly used in financial analysis to depict market movements, assisting in forecasting stock behaviors for strategic decision-making. Decrease financial trends illustrations Rising stock market analysis chart for smart investment decisions and financial growth in modern business. Candlestick chart on a dark blue background. Candlestick chart on a dark blue background illustrating stock market trends. Light blue and white candlesticks represent price fluctuations, with wicks indicating high and low values. The chart shows an upward trend, suggesting potential financial growth or investment opportunities. Candlestick charts are commonly used in financial analysis to depict market movements, assisting in forecasting stock behaviors for strategic decision-making.
Free with trial This 3D rendering showcases colorful bar graphs, pie charts, and a calculator, vividly illustrating concepts of business growth, financial success, and data analysis. The upward-trending arrow emphasizes positive progress. Decrease financial trends illustrations Colorful 3D Charts and Calculator Illustrating Business Growth and Financial Success. This 3D rendering showcases colorful bar graphs, pie charts, and a calculator, vividly illustrating concepts of business growth, financial success, and data analysis. The upward-trending arrow emphasizes positive progress.
Free with trial Colorful bar chart on a blue background illustrating data trends ,Generative ai. Decrease financial trends illustrations Vibrant bar chart on blue background, visualizing data trends and insights colorful. Colorful bar chart on a blue background illustrating data trends ,Generative ai
Free with trial A 3D rendered blue arrow points downwards, signifying a decrease or reduction. Attached to the top of the arrow is a bright pink circular icon containing a white percent sign. The entire graphic is isolated on a clean white background, making it suitable for use in presentations, websites, or marketing materials related to sales, discounts, or negative financial trends. Decrease financial trends illustrations 3D Blue Downward Arrow with Pink Circle and White Percent Sign Isolated on White image. A 3D rendered blue arrow points downwards, signifying a decrease or reduction. Attached to the top of the arrow is a bright pink circular icon containing a white percent sign. The entire graphic is isolated on a clean white background, making it suitable for use in presentations, websites, or marketing materials related to sales, discounts, or negative financial trends
Free with trial An isolated red downward arrow dramatically crashes through, conveying a sense of loss or decline in performance metrics. This represents bearish market behavior or negative trends. Decrease financial trends illustrations A red downward arrow symbolizes a significant decline in market trends or performance. An isolated red downward arrow dramatically crashes through, conveying a sense of loss or decline in performance metrics. This represents bearish market behavior or negative trends.
Free with trial Illustration shows a stock market decline with candlestick charts and downward trending arrow. The design features a light blue background and a simple layout. Useful for financial articles, reports, or any material illustrating loss, recession, or negative trends in commercial sector. Decrease financial trends illustrations Falling stock market chart showing economic downturn and financial loss. Illustration shows a stock market decline with candlestick charts and downward trending arrow. The design features a light blue background and a simple layout. Useful for financial articles, reports, or any material illustrating loss, recession, or negative trends in commercial sector
Free with trial A red financial graph illustrates a stock market decline, showcasing a bearish trend with a downward arrow, indicating loss and a downturn in the market. Decrease financial trends illustrations Red Financial Graph Displaying a Stock Market Downturn with Bearish Trends and Decline. A red financial graph illustrates a stock market decline, showcasing a bearish trend with a downward arrow, indicating loss and a downturn in the market
Free with trial A red stock market decline is shown with a bar chart against a dark background. The image conveys a sense of financial crisis and economic downturn, visually representing negative trends. Decrease financial trends illustrations Red Stock Market Decline Graphic Bar Chart Financial Crisis Concept on Dark Background. A red stock market decline is shown with a bar chart against a dark background. The image conveys a sense of financial crisis and economic downturn, visually representing negative trends
Free with trial A close-up view of a hand holding a magnifying glass over a business graph, emphasizing the analysis of data trends and performance insights. Decrease financial trends illustrations Analysis of Data Trends with Magnifying Glass on Business Graph for Detailed Observation. A close-up view of a hand holding a magnifying glass over a business graph, emphasizing the analysis of data trends and performance insights
Free with trial Vibrant Digital Financial Analysis With Colorful Graphs And Data Visualization On Screen. Generative AI. Decrease financial trends illustrations Vibrant Digital Financial Analysis With Colorful Graphs And Data Visualization On Screen
Free with trial This illustration depicts upward and downward trending arrows on a grid, symbolizing market fluctuations, business trends, and financial performance analysis. Decrease financial trends vectors Illustration of upward and downward trending arrows on a grid isolated on white background. This illustration depicts upward and downward trending arrows on a grid, symbolizing market fluctuations, business trends, and financial performance analysis
Free with trial A 3D rendered blue arrow is pointing downwards, indicating a decrease or decline. Attached to the curve of the arrow is a pink circular badge with a white percentage symbol (%) in the center. The icon is set against a clean white background, suggesting a concept related to price reduction, sales, or negative financial trends. Decrease financial trends illustrations Blue Downward Arrow with Pink Percentage Sign Icon on White Background decrease decline. A 3D rendered blue arrow is pointing downwards, indicating a decrease or decline. Attached to the curve of the arrow is a pink circular badge with a white percentage symbol (%) in the center. The icon is set against a clean white background, suggesting a concept related to price reduction, sales, or negative financial trends
Free with trial A stylized 3D business growth chart depicted against a light blue background. The chart features a blue mountain-like shape representing a peak, with two intersecting lines. One line, marked with pink nodes, shows fluctuations, while another line with green nodes indicates a general upward trend. This visual metaphor conveys concepts of business performance, market trends, and financial analysis. Decrease financial trends illustrations 3D Stylized Business Growth Chart with Red and Green Nodes on Blue Background graph data. A stylized 3D business growth chart depicted against a light blue background. The chart features a blue mountain-like shape representing a peak, with two intersecting lines. One line, marked with pink nodes, shows fluctuations, while another line with green nodes indicates a general upward trend. This visual metaphor conveys concepts of business performance, market trends, and financial analysis
Free with trial This 3D render depicts coin stacks and fluctuating arrows against a blue background, visually representing financial growth and market volatility. Ideal for illustrating investment strategy, economic trends, and business profit, the image clearly conveys concepts of wealth, savings, and currency fluctuation. Use this compelling illustration to enhance finance-related content, presentations, or. Decrease financial trends illustrations 3d render of coin stacks and fluctuating arrows representing financial growth and volatility. This 3D render depicts coin stacks and fluctuating arrows against a blue background, visually representing financial growth and market volatility. Ideal for illustrating investment strategy, economic trends, and business profit, the image clearly conveys concepts of wealth, savings, and currency fluctuation. Use this compelling illustration to enhance finance-related content, presentations, or
Free with trial A visual representation of market fluctuations and business performance, with a red downward arrow indicating a decrease and a green upward arrow signifying growth and positive trends. Decrease financial trends illustrations Red down arrow and green up arrow symbols representing financial market trends and business growth. A visual representation of market fluctuations and business performance, with a red downward arrow indicating a decrease and a green upward arrow signifying growth and positive trends
Free with trial Financial chart displaying a series of candlestick patterns on a digital screen, used for stock data analysis. The chart features vertical bars in orange against a blue background with grid lines. Each candlestick represents price movements within a specific time frame, showcasing market trends. The background includes a blurred assortment of lights and other graphical elements, indicating a financial data interface, likely used for investment portfolio analysis and trading activities. Decrease financial trends illustrations Financial Chart And Stock Data Analysis For Investment Portfolio. Candle Stick Graph For Trade. Financial chart displaying a series of candlestick patterns on a digital screen, used for stock data analysis. The chart features vertical bars in orange against a blue background with grid lines. Each candlestick represents price movements within a specific time frame, showcasing market trends. The background includes a blurred assortment of lights and other graphical elements, indicating a financial data interface, likely used for investment portfolio analysis and trading activities.
Free with trial Declining bar chart with arrow pointing down depicts business loss, failure, negative trends. Decrease financial trends vectors Declining bar chart with arrow pointing down depicts business loss, failure, negative trends
Free with trial Red textured arrows depict market fluctuations and business trends against a textured background symbolizes economic ups and downs, financial analysis, and investment opportunities with market statistics. Decrease financial trends illustrations Red arrows symbolizing fluctuations representing business trends on a textured background. red textured arrows depict market fluctuations and business trends against a textured background symbolizes economic ups and downs, financial analysis, and investment opportunities with market statistics
Free with trial Bar chart with decreasing orange bars and a downward red arrow illustrating financial decline. Decrease financial trends vectors Bar chart with decreasing orange bars and a downward red arrow illustrating financial decline
Free with trial Illustration shows a worried businesswoman in front of a falling financial chart with red and green lines depicting economic decline, serious mood. Generative AI. Decrease financial trends vectors Businesswoman with declining financial graph showing economic downturn and loss trends vector illustration. Illustration shows a worried businesswoman in front of a falling financial chart with red and green lines depicting economic decline, serious mood. Generative AI
Free with trial Red bar chart displays a stock market decline against a dark background, representing a financial crisis or economic downturn. This image highlights negative trends and losses in the market. Decrease financial trends illustrations Red Bar Chart Displaying Stock Market Decline on Dark Background for Financial Crisis Concept. Red bar chart displays a stock market decline against a dark background, representing a financial crisis or economic downturn. This image highlights negative trends and losses in the market
Free with trial Stacks of gold coins sit before a fluctuating red arrow graph illustrating concepts of financial growth market trends investment risk and economic change The image depicts uncertainty and the potential for both profit and loss. Decrease financial trends illustrations Financial Growth Stock Market Coins Red Arrow Investment Business Economy Finance Money Success. Stacks of gold coins sit before a fluctuating red arrow graph illustrating concepts of financial growth market trends investment risk and economic change The image depicts uncertainty and the potential for both profit and loss
Free with trial A close-up, angled view of a digital stock market ticker board. The screen displays rows of numbers in vibrant red and green LED lights against a dark background. Red numbers typically indicate a price decrease or negative performance, while green signifies an increase or positive performance. The display shows various financial data, including stock prices, trading volumes, and potentially chart lines, creating a dynamic and abstract representation of financial markets and trading. Decrease financial trends illustrations Stock Market Ticker Display with Red and Green Numbers. A close-up, angled view of a digital stock market ticker board. The screen displays rows of numbers in vibrant red and green LED lights against a dark background. Red numbers typically indicate a price decrease or negative performance, while green signifies an increase or positive performance. The display shows various financial data, including stock prices, trading volumes, and potentially chart lines, creating a dynamic and abstract representation of financial markets and trading.
Free with trial Colorful bar graph showing data and trends, perfect for business, finance, or analytics presentations. EPS 10. Decrease financial trends vectors Colorful bar graph showing data and trends, perfect for business, finance, or analytics presentations.