Free with trial Detailed outline icons for financial market trends, cloud communication, and data flow. Decrease financial trends vectors Financial market trends and cloud communication network outline icons. detailed outline icons for financial market trends, cloud communication, and data flow
Free with trial Financial chart illustrating stock price trends with candlestick patterns. Vertical and horizontal axes display price and time, respectively. A prominent green upward arrow indicates profit, while a red 'Put tag suggests a potential decrease. Blue and red candlestick bars detail price movements. Curved lines highlight trend directions. Labels like Profit add contextual information. The overall theme suggests a focus on cryptocurrency or stock market analysis. Decrease financial trends illustrations Option Trading Chart AI generated. Financial chart illustrating stock price trends with candlestick patterns. Vertical and horizontal axes display price and time, respectively. A prominent green upward arrow indicates profit, while a red 'Put tag suggests a potential decrease. Blue and red candlestick bars detail price movements. Curved lines highlight trend directions. Labels like Profit add contextual information. The overall theme suggests a focus on cryptocurrency or stock market analysis.
Free with trial A colored outline vector icon of a line graph showing a downward trend, indicating a decrease or decline. Represents financial trends, statistics, losses, or negative performance. Useful for finance, business reports, or data visualization showing reduction. Illustrates a declining value over time, vector design Generative AI. Decrease financial trends vectors Decreasing Trend Stock Market Graph Vector, vector design Generative AI. A colored outline vector icon of a line graph showing a downward trend, indicating a decrease or decline. Represents financial trends, statistics, losses, or negative performance. Useful for finance, business reports, or data visualization showing reduction. Illustrates a declining value over time, vector design Generative AI
Free with trial The image shows a magnifying glass closely inspecting a section of a document that contains financial charts and bar graphs. The charts likely represent data trends, possibly related to market analysis or financial performance. The background includes additional graphs and handwritten notes, suggesting a detailed examination of financial information or research. Decrease financial trends illustrations Magnifying glass examining financial data and bar charts on documents. The image shows a magnifying glass closely inspecting a section of a document that contains financial charts and bar graphs. The charts likely represent data trends, possibly related to market analysis or financial performance. The background includes additional graphs and handwritten notes, suggesting a detailed examination of financial information or research
Free with trial The image depicts a downward red arrow intersecting with a green house icon and a euro symbol, symbolizing a decrease in housing prices or mortgage rates in the European economic context. The percentage sign emphasizes the financial aspect of the decline, suggesting economic trends or market downturns affecting real estate costs. Decrease financial trends illustrations Graphic illustrating a decline in housing prices and interest rates in euros. The image depicts a downward red arrow intersecting with a green house icon and a euro symbol, symbolizing a decrease in housing prices or mortgage rates in the European economic context. The percentage sign emphasizes the financial aspect of the decline, suggesting economic trends or market downturns affecting real estate costs
Free with trial Minimalist graphic depicting the Euro currency falling in value, ideal for financial news, business reports, and economic analysis on market trends. Decrease financial trends illustrations Euro currency symbol with downward red arrow indicating financial decline. Minimalist graphic depicting the Euro currency falling in value, ideal for financial news, business reports, and economic analysis on market trends
Free with trial Coins showing a decrease in value, symbolizing loss, reduction, and economic trends, isolated on a white background. Decrease financial trends illustrations Coins decrease isolated on white background. Coins showing a decrease in value, symbolizing loss, reduction, and economic trends, isolated on a white background
Free with trial The image shows two large arrows pointing in opposite directions, one red arrow pointing downward with a percent symbol indicating a decrease, and one green arrow pointing upward with a percent symbol indicating an increase. This visual metaphor is often used to represent contrasting financial or statistical trends, such as growth versus decline. Decrease financial trends vectors Graphic illustration of opposing percentage trends with directional arrows. The image shows two large arrows pointing in opposite directions, one red arrow pointing downward with a percent symbol indicating a decrease, and one green arrow pointing upward with a percent symbol indicating an increase. This visual metaphor is often used to represent contrasting financial or statistical trends, such as growth versus decline
Free with trial The image shows a stack of three shiny golden coins placed on a black rectangular platform. Behind the coins, there is a downward-pointing arrow, indicating a decline or drop, often used to symbolize a decrease in price or value in financial contexts. The overall composition suggests themes related to economics, finance, or market trends. Decrease financial trends illustrations Stacked golden coins with a downward price trend arrow on a black platform. The image shows a stack of three shiny golden coins placed on a black rectangular platform. Behind the coins, there is a downward-pointing arrow, indicating a decline or drop, often used to symbolize a decrease in price or value in financial contexts. The overall composition suggests themes related to economics, finance, or market trends
Free with trial Vibrant Business Data Visualization Highlighting Market Trends and Financial Metrics. Generative AI. Decrease financial trends illustrations Vibrant Business Data Visualization Highlighting Market Trends and Financial Metrics
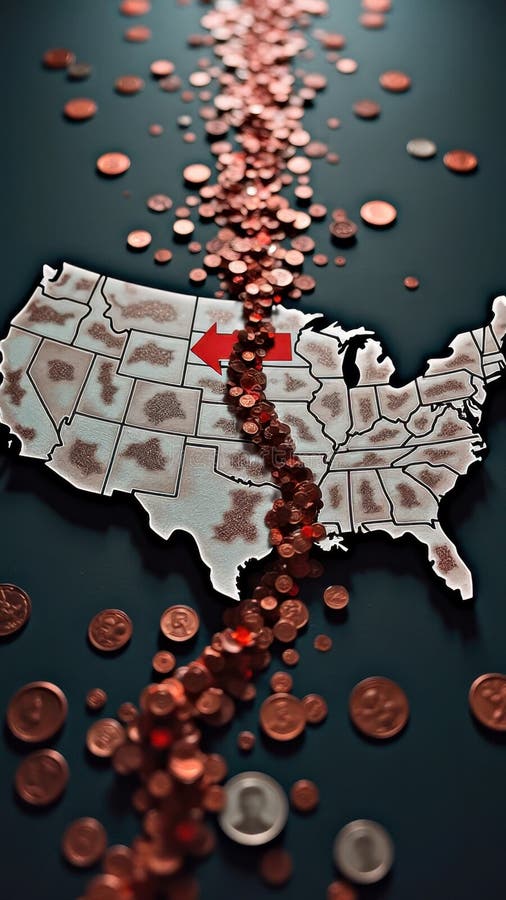
Free with trial That the image is generated using AI. Flow of coins across usa map indicating economic distribution and financial trends. Decrease financial trends illustrations Flow of coins across usa map indicating economic distribution and financial trends
Free with trial The image depicts an open vault door with a prominent dollar sign inside. There are two large arrows, one green pointing upward and one red pointing downward, indicating rising and falling financial trends or market volatility. Decrease financial trends illustrations Financial fluctuations illustrated by an open vault with dollar sign symbol. The image depicts an open vault door with a prominent dollar sign inside. There are two large arrows, one green pointing upward and one red pointing downward, indicating rising and falling financial trends or market volatility
Free with trial The image shows an easel holding a white poster with a blue bar and line chart. The chart depicts a series of vertical bars that gradually decrease in height, accompanied by a line graph that rises initially and then declines. The easel is positioned on a plain, light-colored background, emphasizing the visual data presentation on the poster. Decrease financial trends illustrations Easel displaying a bar and line chart illustrating financial or data trends. The image shows an easel holding a white poster with a blue bar and line chart. The chart depicts a series of vertical bars that gradually decrease in height, accompanied by a line graph that rises initially and then declines. The easel is positioned on a plain, light-colored background, emphasizing the visual data presentation on the poster
Free with trial The image shows a central upward-pointing red arrow with a percent sign, indicating an increase, flanked by two downward-pointing red arrows on either side, symbolizing decreases or fluctuations in percentage values. This visual metaphor is often used to represent changes in metrics, financial trends, or statistical variations. Decrease financial trends illustrations Graphic illustrating percentage increase and decrease with directional arrows. The image shows a central upward-pointing red arrow with a percent sign, indicating an increase, flanked by two downward-pointing red arrows on either side, symbolizing decreases or fluctuations in percentage values. This visual metaphor is often used to represent changes in metrics, financial trends, or statistical variations
Free with trial A 3D rendering of a vibrant red arrow pointing upwards and a bright green arrow pointing downwards, representing market fluctuations, economic changes, and data trends. Decrease financial trends illustrations Red up arrow and green down arrow symbolizing financial market trends growth decline. A 3D rendering of a vibrant red arrow pointing upwards and a bright green arrow pointing downwards, representing market fluctuations, economic changes, and data trends
Free with trial The image depicts a golden dollar sign with a green upward-pointing arrow and a red downward-pointing arrow intersecting it, suggesting themes of financial growth, economic fluctuations, and investment trends. Decrease financial trends illustrations Financial growth symbolized by upward and downward arrows around a dollar sign. The image depicts a golden dollar sign with a green upward-pointing arrow and a red downward-pointing arrow intersecting it, suggesting themes of financial growth, economic fluctuations, and investment trends
Free with trial A stark visual representation of fluctuating interest rates and housing market dynamics. A red arrow points downward, symbolizing a decrease, while a green house features a percentage symbol suggesting a change. Decrease financial trends illustrations Red down arrow and green house with percentage symbols indicating financial trends. A stark visual representation of fluctuating interest rates and housing market dynamics. A red arrow points downward, symbolizing a decrease, while a green house features a percentage symbol suggesting a change
Free with trial A businessman in a blue shirt sits at a desk with a laptop, analyzing financial data with a mix of increasing and decreasing graphs and charts, indicating market trends. Decrease financial trends illustrations Businessman analyzing financial data on laptop with increasing and decreasing graph. A businessman in a blue shirt sits at a desk with a laptop, analyzing financial data with a mix of increasing and decreasing graphs and charts, indicating market trends
Free with trial A white paper receipt floats with a green upward arrow and a red downward arrow, symbolizing financial changes. Decrease financial trends illustrations 3D Rendered Receipt with Up and Down Arrows Indicating Financial Trends bill invoice. A white paper receipt floats with a green upward arrow and a red downward arrow, symbolizing financial changes
Free with trial Abstract layered paper cut illustration of a downward arrow representing financial loss, decline and negative market trends. Decrease financial trends illustrations AI generated Layered paper cut downward arrow icon, financial decline and loss concept. Abstract layered paper cut illustration of a downward arrow representing financial loss, decline and negative market trends
Free with trial This image depicts a large dollar sign symbol with two arrows attached to it. One green arrow points upwards, indicating growth or increase, while a red arrow points downwards and to the left, symbolizing decline or decrease. The visual metaphor emphasizes the dual nature of financial movements, highlighting both positive and negative trends in economic contexts. Decrease financial trends illustrations The dual direction of financial growth and decline represented by dollar signs and arrows. This image depicts a large dollar sign symbol with two arrows attached to it. One green arrow points upwards, indicating growth or increase, while a red arrow points downwards and to the left, symbolizing decline or decrease. The visual metaphor emphasizes the dual nature of financial movements, highlighting both positive and negative trends in economic contexts
Free with trial A businessman is shown analyzing financial documents and data on a laptop, with a prominent overlay indicating a -18. 5 MARKET CRASH RECESSION ALERT and downward-pointing arrows, symbolizing economic downturn and market instability. Decrease financial trends illustrations Market Crash Recession Alert - Businessman Analyzing Financial Data with Downward Trends. A businessman is shown analyzing financial documents and data on a laptop, with a prominent overlay indicating a -18.5 MARKET CRASH RECESSION ALERT and downward-pointing arrows, symbolizing economic downturn and market instability
Free with trial The image shows two contrasting line graphs: one with a green upward-sloping line indicating growth or positive performance, and another with a red downward-sloping line representing decline or negative performance. Both lines are jagged, suggesting volatility or fluctuating trends in data, commonly used in financial, business, or economic contexts to depict market movements or performance changes. Decrease financial trends illustrations Contrasting upward and downward trends in a financial or performance chart illustration. The image shows two contrasting line graphs: one with a green upward-sloping line indicating growth or positive performance, and another with a red downward-sloping line representing decline or negative performance. Both lines are jagged, suggesting volatility or fluctuating trends in data, commonly used in financial, business, or economic contexts to depict market movements or performance changes
Free with trial A 3D render of several red and green Japanese candlestick chart bars arranged in a staggered pattern against a white background. The red bars represent a decrease in value, while the green bars indicate an increase. This visual metaphor is commonly used in financial markets to depict price movements and trading trends. Decrease financial trends illustrations Red and Green Japanese Candlestick Chart Bars Representing Financial Market Trends stock market. A 3D render of several red and green Japanese candlestick chart bars arranged in a staggered pattern against a white background. The red bars represent a decrease in value, while the green bars indicate an increase. This visual metaphor is commonly used in financial markets to depict price movements and trading trends
Free with trial Stock market chart with falling trends and financial metrics displayed on a digital screen, depicting a financial crisis and recession. 3D Rendering. Decrease financial trends illustrations Stock market chart showing declining trends and financial crisis on a digital screen. 3D Rendering. Stock market chart with falling trends and financial metrics displayed on a digital screen, depicting a financial crisis and recession. 3D Rendering
Free with trial The image shows a three-dimensional bar chart with alternating red and green bars, each varying in height. The bars are arranged on a green circular base, suggesting a comparison of data points, possibly financial metrics like stock prices, market performance, or growth analysis. The red bars indicate a decline or negative value, while the green bars suggest an increase or positive value. Decrease financial trends illustrations Colorful 3d bar chart illustration depicting financial market trends or growth metrics. The image shows a three-dimensional bar chart with alternating red and green bars, each varying in height. The bars are arranged on a green circular base, suggesting a comparison of data points, possibly financial metrics like stock prices, market performance, or growth analysis. The red bars indicate a decline or negative value, while the green bars suggest an increase or positive value
Free with trial A stark, minimalist graphic illustration of a vibrant red arrow with a jagged, saw-toothed edge. The arrow is oriented diagonally, pointing from the upper left toward the lower right, symbolizing a sharp decrease, financial loss, economic downturn, or negative trajectory. The background is solid white, emphasizing the bold, aggressive shape of the downward-trending indicator. Decrease financial trends illustrations A jagged red arrow pointing downwards representing decline or negative financial market trends. A stark, minimalist graphic illustration of a vibrant red arrow with a jagged, saw-toothed edge. The arrow is oriented diagonally, pointing from the upper left toward the lower right, symbolizing a sharp decrease, financial loss, economic downturn, or negative trajectory. The background is solid white, emphasizing the bold, aggressive shape of the downward-trending indicator
Free with trial A stark, minimalist graphic illustration of a vibrant red arrow with a jagged, saw-toothed edge. The arrow is oriented diagonally, pointing from the upper left toward the lower right, symbolizing a sharp decrease, financial loss, economic downturn, or negative trajectory. The background is solid white, emphasizing the bold, aggressive shape of the downward-trending indicator. Decrease financial trends illustrations A jagged red arrow pointing downwards representing decline or negative financial market trends. A stark, minimalist graphic illustration of a vibrant red arrow with a jagged, saw-toothed edge. The arrow is oriented diagonally, pointing from the upper left toward the lower right, symbolizing a sharp decrease, financial loss, economic downturn, or negative trajectory. The background is solid white, emphasizing the bold, aggressive shape of the downward-trending indicator
Free with trial A striking red downward arrow is prominently placed on a chart highlighting a notable decrease in financial metrics over time suggesting a troubling trend in market analysis. Decrease financial trends illustrations A striking red downward arrow is prominently placed on a chart highlighting a notable decrease in financial metrics over time
Free with trial Iconographic display of economic downturn and business challenges. A black bar graph accompanied by a descending arrow, representing loss, decrease, and negative market trends. Useful for financial reports and risk analysis. Decrease financial trends illustrations Black bar chart with downward arrow signifying financial decline and negative market performance. Iconographic display of economic downturn and business challenges. A black bar graph accompanied by a descending arrow, representing loss, decrease, and negative market trends. Useful for financial reports and risk analysis
Free with trial Comprehensive Financial Business Stock Data Indicator Charts for Analyzing Market Trends Effectively, Generated by AI. Decrease financial trends illustrations Comprehensive Financial Business Stock Data Indicator Charts for Analyzing Market Trends Effectively. Generated by AI
Free with trial This image depicts various financial concepts using graphical icons on mobile devices. It includes illustrations of rising and falling trends, balanced scales, growth, and investment themes, possibly representing market analysis, stock performance, investment growth, and financial balance. Decrease financial trends illustrations Financial trends and investment concepts illustrated with modern icons isolated on white background. This image depicts various financial concepts using graphical icons on mobile devices. It includes illustrations of rising and falling trends, balanced scales, growth, and investment themes, possibly representing market analysis, stock performance, investment growth, and financial balance
Free with trial Vibrant financial chart illustrates stock market trends and trading activity. Showcasing investment dynamics with percentage values command signals and statistic data display. Decrease financial trends illustrations Vibrant financial chart illustrates stock market trends and trading activity. Showcasing investment dynamics with percentage
Free with trial This captivating abstract image showcases a glowing digital graph illustrating financial trends and statistical patterns, ideal for technology and business themes. Decrease financial trends illustrations Abstract Digital Financial Graph with Glowing Lines and Data Points Representing Statistics and Market Trends. This captivating abstract image showcases a glowing digital graph illustrating financial trends and statistical patterns, ideal for technology and business themes
Free with trial Hand drawn line art illustration of financial analysis depicting growth and market trends for business strategy. Decrease financial trends vectors Hand drawn line art illustration of financial analysis depicting growth and market trends for business strategy
Free with trial Bold illustration of financial market trends depicting monetary growth and decline for business and investment concepts. Decrease financial trends vectors Bold illustration of financial market trends depicting monetary growth and decline for business and investment concepts
Free with trial This image depicts a bold red zigzag arrow pointing downward, enclosed within a circular outline. The downward direction of the arrow suggests a trend of decline, reduction, or decrease, often used in contexts such as financial markets, performance metrics, or general downward trends. The circular boundary emphasizes containment or focus on the downward movement itself. Decrease financial trends illustrations Downward zigzag arrow inside a circular boundary indicating decline or reduction isolated on white background. This image depicts a bold red zigzag arrow pointing downward, enclosed within a circular outline. The downward direction of the arrow suggests a trend of decline, reduction, or decrease, often used in contexts such as financial markets, performance metrics, or general downward trends. The circular boundary emphasizes containment or focus on the downward movement itself
Free with trial This image illustrates market trends with arrows and graphs. It represents economic instability, showing both growth and decline, crucial for financial analysis. Decrease financial trends vectors Vector art of illustration depicting fluctuating market trends with upward and downward arrows and bar graphs, , conveying. This image illustrates market trends with arrows and graphs. It represents economic instability, showing both growth and decline, crucial for financial analysis
Free with trial Three coin stacks on yellow background represent decline. Stacks reduce in size indicating financial loss or decreasing trends. Concept of budget crisis economic, downturn visualized. Decrease financial trends illustrations Three coin stacks on yellow background represent decline. Stacks reduce in size indicating financial loss or decreasing trends.
Free with trial Visualizing market downturn, financial decline, and recession with a blue abstract illustration. Analyzing business trends and economic shifts. Decrease financial trends illustrations Glass Chart: Market Downturn, Financial Decline, Recession Visualization, Blue Abstract Illustration, Business Trends, Economic. Visualizing market downturn, financial decline, and recession with a blue abstract illustration. Analyzing business trends and economic shifts
Free with trial A graphic illustration depicting the fluctuating value of digital currency, shown with a price performance chart and coins. this visual represents market ups and downs and financial trends. Decrease financial trends vectors Stylized illustration showing digital currency market volatility and virtual coin price trends on financial growth chart. a graphic illustration depicting the fluctuating value of digital currency, shown with a price performance chart and coins. this visual represents market ups and downs and financial trends
Free with trial Seamless pattern featuring colorful financial arrows pointing up and down representing market trends isolated on a bright white. Generative AI Illustration. Decrease financial trends illustrations Seamless pattern featuring colorful financial arrows pointing up and down representing market trends isolated on a bright white
Free with trial Seamless pattern featuring colorful financial arrows pointing up and down representing market trends isolated on a bright white. Generative AI Illustration. Decrease financial trends illustrations Seamless pattern featuring colorful financial arrows pointing up and down representing market trends isolated on a bright white
Free with trial Seamless pattern featuring colorful financial arrows pointing up and down representing market trends isolated on a bright white. Generative AI Illustrations. Decrease financial trends illustrations Seamless pattern featuring colorful financial arrows pointing up and down representing market trends isolated on a bright white
Free with trial Seamless pattern featuring colorful financial arrows pointing up and down representing market trends isolated on a bright white. Generative AI Illustration. Decrease financial trends illustrations Seamless pattern featuring colorful financial arrows pointing up and down representing market trends isolated on a bright white
Free with trial Colorful bar chart with a line graph presenting trends and data growth over time, ideal for business analysis, marketing presentations, and financial reports. Decrease financial trends illustrations Colorful Bar Chart with Line Graph Illustrating Trends and Data Growth over Time For Business, Marketing, Finance and Analysis Use. Colorful bar chart with a line graph presenting trends and data growth over time, ideal for business analysis, marketing presentations, and financial reports
Free with trial Elevate your financial presentations and data visualizations with these captivating vintage-style arrow graphics. Perfect for illustrating price fluctuations, interest rate movements, and market trends, these retro-inspired up and down arrow designs are a visually engaging way to convey complex information. The sepia tone and textured background add a touch of vintage charm, bringing a classic. Decrease financial trends illustrations Vintage-Inspired Arrow Graphics for Illustrating Price & Interest Rate Trends: A Retro Style Design Element. Elevate your financial presentations and data visualizations with these captivating vintage-style arrow graphics. Perfect for illustrating price fluctuations, interest rate movements, and market trends, these retro-inspired up and down arrow designs are a visually engaging way to convey complex information. The sepia tone and textured background add a touch of vintage charm, bringing a classic
Free with trial This graphic illustrates stable bank withdrawals alongside a rising financial trend with coins and bars, Bank withdrawals are currently stable and not showing any significant increase or decrease. Decrease financial trends vectors This graphic illustrates stable bank withdrawals alongside a rising financial trend with coins and bars, Bank withdrawals are
Free with trial A glowing digital bull surrounded by stock market data, representing financial growth and bullish market trends. Decrease financial trends illustrations A glowing digital bull surrounded by stock market data, representing financial growth and bullish market trends
Free with trial Stacks of golden coins arranged in ascending order, representing financial growth and investment. The background features a blurred stock market graph, symbolizing market trends and investment opportunities. The image conveys concepts of wealth accumulation, financial planning, and economic prosperity. Suitable for illustrating articles, presentations, or advertisements related to finance, investment, and business. Decrease financial trends illustrations Financial Growth and Investment
Free with trial A human hand points downward against a bright red background. A jagged red arrow follows the finger's direction, descending diagonally across the frame, symbolizing a decline or decrease. The image conveys a sense of decreasing values or falling trends, commonly associated with financial or economic downturns. Decrease financial trends illustrations A human hand points downward against a bright red background. A jagged red arrow
Free with trial Candlestick chart showing a series of red and green bars representing price fluctuations over time. Each rectangular bar displays financial data, with green indicating an increase and red indicating a decrease. Thin vertical lines extend above and below the bars, illustrating price range. Numerical values such as 20. 800 and 213. 500 label specific points on the chart, judging stock or currency performance. Horizontal lines suggest moving averages, highlighting trends in the data. Decrease financial trends illustrations Candlestick chart showing a series of red and green bars representing price
Free with trial Red 3D arrows pointing downward with white percentage signs (%) on each. The arrows vary in size, creating a dynamic visual suggesting a reduction or decrease, commonly associated with price drops, discounts, or economic decline. The background is plain white, emphasizing the bold, glossy red of the arrows, which have a smooth texture and a reflective surface. This imagery is frequently used in financial or marketing contexts to indicate downward trends or sales promotions. Decrease financial trends illustrations Red 3D arrows pointing downward with white percentage signs (%) on each. The
Free with trial The image displays a candlestick chart, commonly used in financial markets to represent price movements of an asset over time. the chart features red and green candlesticks, where green indicates a price increase and red indicates a price decrease. a yellow line overlays the candlesticks, likely representing a moving average, which is a common technical indicator used to smooth out price data and identify trends. the chart is set against a dark blue background with grid lines, and time intervals are marked along the x-axis. a scale on the right side shows the price values. the overall impression is that of a tool used for technical analysis in trading or investment. Decrease financial trends illustrations Stock market candlestick chart with moving average. the image displays a candlestick chart, commonly used in financial markets to represent price movements of an asset over time. the chart features red and green candlesticks, where green indicates a price increase and red indicates a price decrease. a yellow line overlays the candlesticks, likely representing a moving average, which is a common technical indicator used to smooth out price data and identify trends. the chart is set against a dark blue background with grid lines, and time intervals are marked along the x-axis. a scale on the right side shows the price values. the overall impression is that of a tool used for technical analysis in trading or investment.
Free with trial A 3D illustration features a dejected male figure in a black suit leaning against a large, red, downward-pointing arrow. The arrow zigzags dramatically, indicating a decline or decrease. The man appears sad, with his head lowered, conveying a sense of loss or failure. The white background emphasizes the starkness of the situation. The scene represents concepts like financial loss, downturns, or negative trends. Decrease financial trends illustrations A 3D illustration features a dejected male figure in a black suit leaning against a
Free with trial Illustration features two stylized documents with checkmarks, symbolizing tasks or data lists. Adjacent to the papers are a green upward arrow and a red downward arrow, each marked with a percentage sign, indicating increase and decrease in values. The background is light blue, enhancing the contrast. The graphic suggests concepts of data analysis, financial trends, or statistical reports. Decrease financial trends vectors Duplicate or update thin line document. Illustration features two stylized documents with checkmarks, symbolizing tasks or data lists. Adjacent to the papers are a green upward arrow and a red downward arrow, each marked with a percentage sign, indicating increase and decrease in values. The background is light blue, enhancing the contrast. The graphic suggests concepts of data analysis, financial trends, or statistical reports.
Free with trial Multiple line charts showing data trends over months on a grid background. Concept of data analysis and financial growth. 3D Rendering. Decrease financial trends illustrations Multiple line charts showing data trends over months on grid background. 3D Rendering. Multiple line charts showing data trends over months on a grid background. Concept of data analysis and financial growth. 3D Rendering
Free with trial Visualize financial concepts with this dynamic illustration showcasing currency exchange rates and market trends. Perfect for business presentations, financial reports, and investment strategies. Showcasing global market volatility and opportunities. Decrease financial trends vectors Dollar and Euro currency exchange rate with upward and downward trends. Visualize financial concepts with this dynamic illustration showcasing currency exchange rates and market trends. Perfect for business presentations, financial reports, and investment strategies. Showcasing global market volatility and opportunities
Free with trial Explore the dynamic world of crypto trading with insights on market trends and financial strategies. Discover how fluctuations can impact investment decisions. Decrease financial trends illustrations Crypto Trading Trends and Future Perspectives. Explore the dynamic world of crypto trading with insights on market trends and financial strategies. Discover how fluctuations can impact investment decisions
Free with trial A hand in a black suit sleeve points downward against a red background. The hand is prominently featured in the foreground, emphasizing direction. Behind it, a red zigzag line graph with an arrow points downward, symbolizing decline or reduction. The red background accentuates the theme of loss or decrease, commonly associated with financial or performance downturns. The image combines elements of business attire with graphical data representation, conveying a message of falling trends or negative outcomes. Decrease financial trends illustrations A hand in a black suit sleeve points downward against a red background. The hand
Free with trial A turquoise moon hovers above a stock market graph with rising and falling arrows indicating market trends, useful for illustrating financial concepts. Decrease financial trends illustrations Stock Market Graph with Moon and Arrow Trends. A turquoise moon hovers above a stock market graph with rising and falling arrows indicating market trends, useful for illustrating financial concepts
Free with trial A collection of financial chart icons, showcasing data analysis and business growth concepts. The image features multiple variations of a line graph and bar chart combination, presented in both grayscale and beige color schemes. These icons are ideal for illustrating financial reports, business presentations, market trends, and data visualization projects. The clean, modern design makes them suitable for a wide range of applications. Decrease financial trends vectors Financial Chart Icons: Business and Data Analysis. A collection of financial chart icons, showcasing data analysis and business growth concepts. The image features multiple variations of a line graph and bar chart combination, presented in both grayscale and beige color schemes. These icons are ideal for illustrating financial reports, business presentations, market trends, and data visualization projects. The clean, modern design makes them suitable for a wide range of applications.
Free with trial A stark vector illustration of a bar chart showing a sharp decrease, indicated by a downward-pointing red arrow. This icon effectively represents economic downturns, financial losses, declining trends, or negative performance metrics. Ideal for business reports, financial analysis, or news graphics, vector design Generative AI. Decrease financial trends vectors . A stark vector illustration of a bar chart showing a sharp decrease, indicated by a downward-pointing red arrow. This icon effectively represents economic downturns, financial losses, declining trends, or negative performance metrics. Ideal for business reports, financial analysis, or news graphics, vector design Generative AI
Free with trial A collection of eight black and white, hand-drawn or doodle style icons. Each square icon features a different line graph, representing data, analytics, statistics, or financial trends. Decrease financial trends illustrations Set of hand drawn financial chart line graph icons isolated on white. A collection of eight black and white, hand-drawn or doodle style icons. Each square icon features a different line graph, representing data, analytics, statistics, or financial trends
Free with trial A collection of eight black and white, hand-drawn or doodle style icons. Each square icon features a different line graph, representing data, analytics, statistics, or financial trends. Decrease financial trends illustrations Set of hand drawn financial chart line graph icons isolated on white. A collection of eight black and white, hand-drawn or doodle style icons. Each square icon features a different line graph, representing data, analytics, statistics, or financial trends
Free with trial Coins showing a decrease in value, symbolizing loss, reduction, and economic trends, isolated on a white background. Decrease financial trends illustrations Coins decrease isolated on white background. Coins showing a decrease in value, symbolizing loss, reduction, and economic trends, isolated on a white background
Free with trial A detailed financial chart is presented with numerous vertical bars and multiple overlapping line graphs in blue, white, and orange. Red and green arrows indicate downward and upward movements, respectively, with specific numerical data points displayed. The overall trend shows fluctuations but a general upward trajectory towards the right. Decrease financial trends illustrations Detailed Financial Chart with Upward and Downward Trends. A detailed financial chart is presented with numerous vertical bars and multiple overlapping line graphs in blue, white, and orange. Red and green arrows indicate downward and upward movements, respectively, with specific numerical data points displayed. The overall trend shows fluctuations but a general upward trajectory towards the right
Free with trial A symbolic illustration of a person with a downward-pointing arrow, representing decline, reduction, or negative trends. Ideal for financial reports, statistical analyses, or problem identification. This visual effectively communicates a downturn or decrease in various metrics. vector design Generative AI. Decrease financial trends vectors Person with Down Arrow, Decline, Downtrend & Reduced Growth, vector design Generative AI. A symbolic illustration of a person with a downward-pointing arrow, representing decline, reduction, or negative trends. Ideal for financial reports, statistical analyses, or problem identification. This visual effectively communicates a downturn or decrease in various metrics. vector design Generative AI
Free with trial Black and white bitcoin coin with a blue downward arrow indicating a decrease in value. Ideal for economic trends, cryptocurrency market analysis, financial decline, forex trading, money management. Decrease financial trends vectors Bitcoin Price Drop Representation with Blue Downward Arrow and Coin Illustration. Black and white bitcoin coin with a blue downward arrow indicating a decrease in value. Ideal for economic trends, cryptocurrency market analysis, financial decline, forex trading, money management
Free with trial A financial market graph on a blue background illustrating investment trends, this is a visual representation of market fluctuations and volume, reflecting economic movements, investment strategies and business performance analysis. Generative AI. Decrease financial trends illustrations Financial markets graph on a blue background showing investment trends. A financial market graph on a blue background illustrating investment trends, this is a visual representation of market fluctuations and volume, reflecting economic movements, investment strategies and business performance analysis. Generative AI
Free with trial A 3D bar chart with red and green bars representing financial data trends, isolated on white background. Decrease financial trends illustrations 3d bar chart showing financial data trends isolated on white background. A 3D bar chart with red and green bars representing financial data trends, isolated on white background
Free with trial A bold red zigzag arrow points downward, visually representing a significant decrease in value, market downturn, or financial crisis. This symbol conveys negative trends and losses. Decrease financial trends illustrations Red downward arrow trend symbolizing financial decline stock market crash. A bold red zigzag arrow points downward, visually representing a significant decrease in value, market downturn, or financial crisis. This symbol conveys negative trends and losses
Free with trial A vector icon of a line graph showing a downward trend with a red arrow. Represents decline, loss, negative performance, or decreasing statistics. Useful for financial reports, business analytics, or illustrating unfavorable trends. Clear visual for decrease, vector design Generative AI. Decrease financial trends vectors Downward Trend Line Graph Vector Icon for Decline Loss, vector design Generative AI. A vector icon of a line graph showing a downward trend with a red arrow. Represents decline, loss, negative performance, or decreasing statistics. Useful for financial reports, business analytics, or illustrating unfavorable trends. Clear visual for decrease, vector design Generative AI
Free with trial A stark visual representation of a financial downturn with a bold red arrow pointing downwards. This graphic captures market decline and economic recession trends, ideal for financial analysis and reporting. Decrease financial trends illustrations Financial downturn visualized red arrow chart showing decline candlestick graph indicating market drop economic recession trend. A stark visual representation of a financial downturn with a bold red arrow pointing downwards. This graphic captures market decline and economic recession trends, ideal for financial analysis and reporting
Free with trial An abstract digital rendering of a financial market chart with a prominent red line indicating fluctuations in a stock market or trading scenario, set against a background of data streams and numerical information. It can be used for visualizing economic trends or for representing financial analytics. Decrease financial trends illustrations Abstract financial chart depicting market trends and data analysis interface. An abstract digital rendering of a financial market chart with a prominent red line indicating fluctuations in a stock market or trading scenario, set against a background of data streams and numerical information. It can be used for visualizing economic trends or for representing financial analytics
Free with trial A striking red downward arrow breaks through charts and data, symbolizing a sharp decrease in market values or performance metrics during a financial analysis session. Decrease financial trends illustrations Red downward arrow indicates a sudden decline in market performance and trends. A striking red downward arrow breaks through charts and data, symbolizing a sharp decrease in market values or performance metrics during a financial analysis session.
Free with trial A 3D rendering of a vibrant red arrow pointing upwards and a bright green arrow pointing downwards, representing market fluctuations, economic changes, and data trends. Decrease financial trends illustrations Red up arrow and green down arrow symbolizing financial market trends growth decline. A 3D rendering of a vibrant red arrow pointing upwards and a bright green arrow pointing downwards, representing market fluctuations, economic changes, and data trends