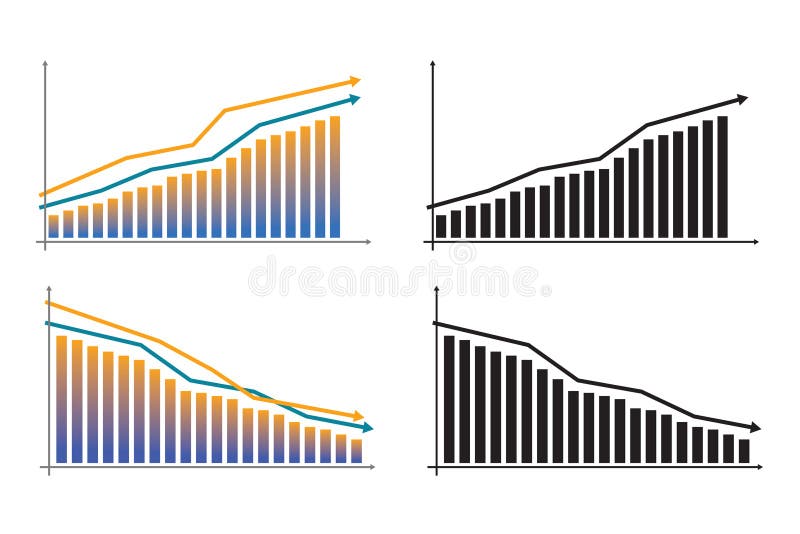
Free with trial Up and down graph chart icon. Growth increase and decrease sign. Graph or diagram with arrow going up and down. Vector illustration. Income decrease graph vectors Up and down graph chart icon. Growth increase and decrease sign. Graph or diagram with arrow going up and down. Vector
Free with trial Wooden blocks with percent signs sit on stacks of coins. A red graph trending downwards is in the, background indicating financial loss and economic recession. Income decrease graph illustrations Wooden blocks with percent signs sit on stacks of coins. A red graph trending downwards is in the background indicating financial. Wooden blocks with percent signs sit on stacks of coins. A red graph trending downwards is in the, background indicating financial loss and economic recession.
Free with trial Up and down graph chart icon. Growth increase and decrease sign. Graph or diagram with arrow going up and down. Vector illustration. Income decrease graph illustrations Up and down graph chart icon. Growth increase and decrease sign. Graph or diagram with arrow going up and down. Vector
Free with trial Up and down graph chart icon. Growth increase and decrease sign. Graph or diagram with arrow going up and down. Vector illustration. Income decrease graph vectors Up and down graph chart icon. Growth increase and decrease sign. Graph or diagram with arrow going up and down. Vector
Free with trial Dropping graphic arrow. Profit reduction schedule, financial debt graph and income loss 3D arrow vector illustration. Business downturn, company income decline. Decreasing stock market trend forecast. Income decrease graph vectors Dropping graphic arrow. Profit reduction schedule, financial debt graph and income loss 3D arrow vector illustration
Free with trial 3d bar graph illustrating financial growth with upward green arrow and downward red arrows indicating trends. Income decrease graph vectors Bar graph rising with arrows showing increase decrease. 3d bar graph illustrating financial growth with upward green arrow and downward red arrows indicating trends
Free with trial Financial debt increase, investment fund loss, unexpected market drop, income decrease, lower revenue, asset bad performance, portfolio devaluation, descending chart, money wast, vector icon. Income decrease graph vectors Descending chart, financial debt, investment fund loss, unexpected market drop, income decrease, asset bad performance. Financial debt increase, investment fund loss, unexpected market drop, income decrease, lower revenue, asset bad performance, portfolio devaluation, descending chart, money wast, vector icon
Free with trial A colorful graph with the words Net Income written below it. The graph is made up of many different colored lines and dots. Income decrease graph illustrations A colorful graph with the words Net Income written below it
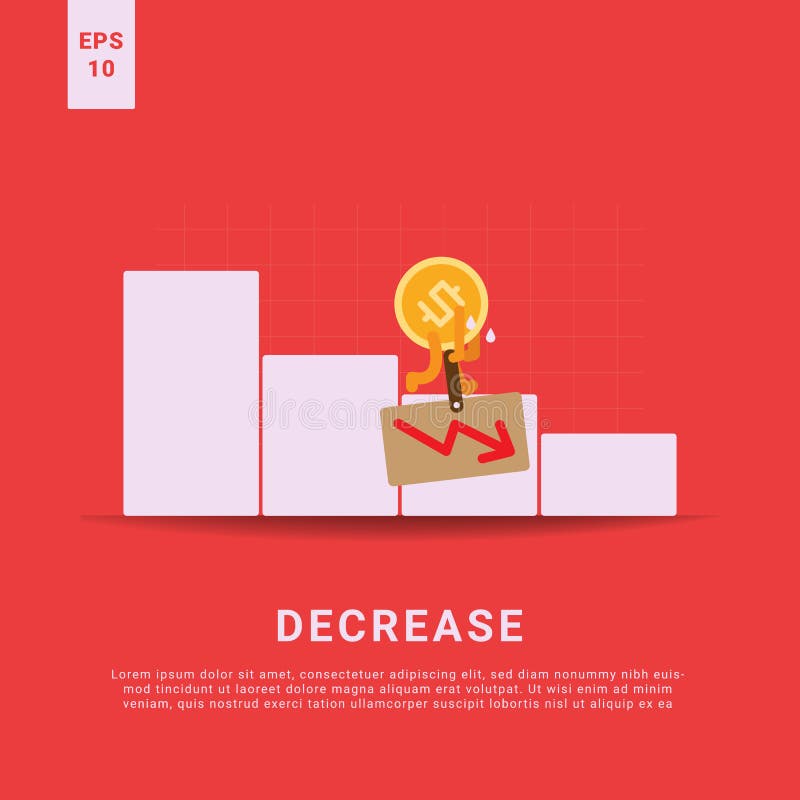
Free with trial Laptop financial loss. Screen dollar decrease. Business decline graph. Vector economy illustration. EPS 10. Income decrease graph vectors Laptop financial loss. Screen dollar decrease. Business decline graph. Vector economy illustration.
Free with trial A black bar graph shows two bars labeled COST and REVENUE on a white background. Clear details and vibrant col. Income decrease graph illustrations Black bar graph with COST and REVENUE labels on white background cost revenue. A black bar graph shows two bars labeled COST and REVENUE on a white background. Clear details and vibrant col
Free with trial Graph reduction with arrow down, line chart icon. Financial fall, decrease, fail. Statistics and analytics. Vector flat illustration. Income decrease graph vectors Graph reduction with arrow down, line chart icon. Financial fall, decrease, fail. Statistics and analytics. Vector illustration
Free with trial Graph growth with arrow up and reduction with arrow down, line chart icon. Financial invest, fall, increase and decrease. Statistics and analytics. Vector flat illustration. Income decrease graph vectors Graph growth with arrow up and reduction with arrow down, line chart icon. Financial invest, fall, increase and decrease
Free with trial Graph growth with arrow up and reduction with arrow down, line chart icon. Financial invest, fall, increase and decrease. Statistics and analytics. Vector flat illustration. Income decrease graph vectors Graph growth with arrow up and reduction with arrow down, line chart icon. Financial invest, fall, increase and decrease
Free with trial Illustration of cost saving graph with coins, arrows, and text on a light blue background. Income decrease graph illustrations Cost saving graph with coins and arrows on light blue background. illustration of cost saving graph with coins, arrows, and text on a light blue background
Free with trial Financial growth chart with trend line graph. Growth bar chart of economy. Financial decline. Economic crisis, decrease graph. Profit down. Vector illustration isolated on white background. Income decrease graph vectors Financial growth chart with trend line graph. Growth bar chart of economy. Financial decline. Economic crisis, decrease graph.
Free with trial Illustration of financial line graph showing growth. Upward trending arrow, chart, bar chart, income, finance, business, statistics development. Visual representation of success. Income decrease graph illustrations Illustration of financial line graph showing growth. Upward trending arrow, chart, bar chart, income, finance, business
Free with trial Decrease in men income. decay circuit. flat vector illustration isolated on white background. Income decrease graph vectors Decrease in men income. decay circuit.
Free with trial A businessman is shown from an elevated perspective, diligently typing on a laptop. Beside him, a 3D bar graph illustrates a downward trend, accompanied by a prominent green arrow and a COST sign, symbolizing cost reduction and financial efficiency. Income decrease graph illustrations Businessman working on laptop with decreasing cost graph and arrow. A businessman is shown from an elevated perspective, diligently typing on a laptop. Beside him, a 3D bar graph illustrates a downward trend, accompanied by a prominent green arrow and a COST sign, symbolizing cost reduction and financial efficiency
Free with trial Decrease rate and lost income, iconic money bring board walking tired, finance crisis and backrupt concept, flat vector illustration. Income decrease graph vectors Decrease rate and lost income flat vector. Decrease rate and lost income, iconic money bring board walking tired, finance crisis and backrupt concept, flat vector illustration
Free with trial Graph showing decrease of bitcoin value. Cryptocurrency decline graph in vector. Colourful graph paper. Income decrease graph illustrations Graph showing decrease of bitcoin value
Free with trial Regression income icon on white background. graph decreases sign. graph with down arrow symbol. flat style. Income decrease graph vectors Regression income icon on white background. graph decreases sign. graph with down arrow symbol. flat style
Free with trial This image depicts a financial graph illustrating net worth over time, featuring a teal shaded area and a line graph with data points. The graph is presented on a clean white background, making it easy to read and understand. The image is suitable for use in financial reports, presentations, and marketing materials, providing a clear and concise visual representation of financial data. The graph's design is simple, yet effective, allowing viewers to quickly grasp the trend and pattern of net worth changes over time. Income decrease graph vectors A financial graph showing net worth over time with a teal shaded area. This image depicts a financial graph illustrating net worth over time, featuring a teal shaded area and a line graph with data points. The graph is presented on a clean white background, making it easy to read and understand. The image is suitable for use in financial reports, presentations, and marketing materials, providing a clear and concise visual representation of financial data. The graph's design is simple, yet effective, allowing viewers to quickly grasp the trend and pattern of net worth changes over time.
Free with trial Decline stage online service or platform. Finance crisis with falling down graph and income decrease. flat vector modern illustration. Income decrease graph vectors Decline stage online service or platform. Finance crisis with falling down graph and income decrease.
Free with trial Graph chart, Certificate and Column chart line icons set. Timeline process infograph. Income money sign. Growth report, Certified file, Financial graph. Savings. Education set. Vector. Income decrease graph vectors Graph chart, Certificate and Column chart icons set. Income money sign. Vector. Graph chart, Certificate and Column chart line icons set. Timeline process infograph. Income money sign. Growth report, Certified file, Financial graph. Savings. Education set. Vector
Free with trial Business finance crisis concept with alert exclamation mark. money graph fall down symbol. arrow decrease economy stretching rising drop. lost bankrupt declining. cost reduction. loss of income bankruptcy capital chart crash currency decline decreasing dollar economic element failure financial flat graphic icon investment lower market modern price pricing profit rate recession risk shape simple stock cut design diagram exchange falling illustration vector budget global inflation world. Income decrease graph vectors Business finance crisis concept with alert exclamation mark. money graph fall down symbol. arrow decrease economy stretching
Free with trial A businessman in a suit is drawing a downward sloping graph illustrating the decline of profits against the rise of costs the image represents financial challenges business downturns and the need for cost reduction strategies for improved profitability. Income decrease graph illustrations Business person drawing a graph representing financial decline and reduced profits due to cost. A businessman in a suit is drawing a downward sloping graph illustrating the decline of profits against the rise of costs the image represents financial challenges business downturns and the need for cost reduction strategies for improved profitability
Free with trial Coin is placed in a graph showing a decrease in interest. and inflation has declined worldwide. stock investment concept wealth stock market volatility Inflation decreases,investor wealth decreases. Income decrease graph illustrations Coin is placed in a graph showing a decrease in interest. and inflation has declined worldwide. stock investment concept wealth
Free with trial Economy finance crisis low investment graph arrow down background. money loss bankrupt decrease. vector illustration fantastic technology. Income decrease graph vectors Economy finance crisis low investment graph arrow down background. money loss bankrupt decrease. vector illustration fantastic
Free with trial Business investment graph up and down symbol on white background. stock market trend increase and decrease. vector illustration flat design. Income decrease graph vectors Business investment graph up and down symbol on white background. stock market trend increase and decrease. vector illustration
Free with trial A man's hand holds a glowing blue bar graph with a white arrow pointing down indicating cost reduction. Income decrease graph illustrations Man holding glowing cost reduction graph with downward arrow chart financial 1. A man's hand holds a glowing blue bar graph with a white arrow pointing down indicating cost reduction
Free with trial Business finance crisis concept with alert exclamation mark. money graph fall down symbol. arrow decrease economy stretching rising drop. lost bankrupt declining. cost reduction. loss of income bankruptcy capital chart crash currency decline decreasing dollar economic element failure financial flat graphic icon investment lower market modern price pricing profit rate recession risk shape simple stock cut design diagram exchange falling illustration vector budget global inflation world. Income decrease graph vectors Business finance crisis concept with alert exclamation mark. money graph fall down symbol. arrow decrease economy stretching
Free with trial Money increase, decrease arrow icons. Financial profit graph icon set. Currency growth. EPS 10. Income decrease graph vectors Money increase, decrease arrow icons. Financial profit graph icon set. Currency growth
Free with trial Line graph of income growth, timeline, arrows indicate the direction of the graph, vector, white background. Income decrease graph illustrations Line graph of income growth, timeline, arrows indicate the direction of the graph, vector
Free with trial Black line graph showing a downward trend with an arrow on a white background Clear details and vibrant colors. Income decrease graph illustrations Black line graph showing a downward trend with arrow on white background Keywords: graph, chart. Black line graph showing a downward trend with an arrow on a white background Clear details and vibrant colors
Free with trial Line graph of income growth, timeline, arrows indicate the direction of the graph, vector, black background. Income decrease graph illustrations Line graph of income growth, timeline, arrows indicate the direction of the graph, vector
Free with trial Line graph of income growth, timeline, arrows indicate the direction of the graph, vector, black background. Income decrease graph illustrations Line graph of income growth, timeline, arrows indicate the direction of the graph, vector
Free with trial Line graph of income growth, timeline, arrows indicate the direction of the graph, vector, white background. Income decrease graph illustrations Line graph of income growth, timeline, arrows indicate the direction of the graph, vector
Free with trial An illustration of a bar graph showing a decline with descending arrow indicating business downturn and financial loss using flat style. Income decrease graph vectors Financial decline graph with a descending arrow showing losses and market downturns. An illustration of a bar graph showing a decline with descending arrow indicating business downturn and financial loss using flat style
Free with trial Line graph of income growth, timeline, arrows indicate the direction of the graph, vector, black background. Income decrease graph illustrations Line graph of income growth, timeline, arrows indicate the direction of the graph, vector
Free with trial Line graph of income growth, timeline, arrows indicate the direction of the graph, vector, white background. Income decrease graph illustrations Line graph of income growth, timeline, arrows indicate the direction of the graph, vector
Free with trial Business finance crisis concept. cost reduction management. arrow line decrease money graph fall down symbol. economy stretching rising drop. lost bankrupt declining. loss of income capital chart crash currency cut decline decreasing design diagram dollar economic failure falling financial flat global graphic illustration inflation low lower market price pricing profit rate recession risk vector background account calculator cash efficiency improve reduce. Income decrease graph vectors Business finance crisis concept. cost reduction management. arrow line decrease money graph fall down symbol. economy stretching
Free with trial This vector illustration shows business icons representing time management, financial growth, investment, profit increase and decrease with simple human figures in black. Professional mood. Generative AI. Income decrease graph vectors Business icons time management financial growth investment profit increase decrease vector illustration. This vector illustration shows business icons representing time management, financial growth, investment, profit increase and decrease with simple human figures in black. Professional mood. Generative AI
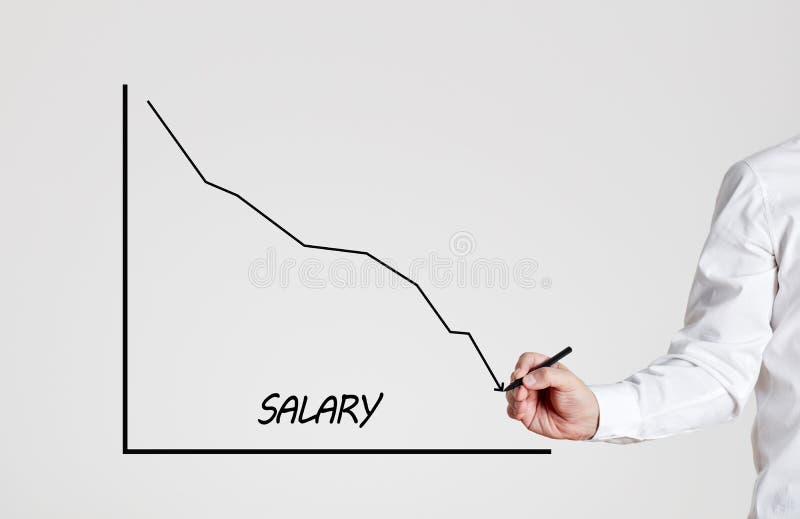
Free with trial Businessman draws a declining line graph with the word salary. Decrease in salaries concept. Income decrease graph illustrations Businessman draws a declining line graph with the word salary. Decrease in salaries
Free with trial Graph of of decreasing level of income, taxes. Vector illustration in schedule schematic style. Concept of world crisis, inflation, oil problems, business failure, economic recession. Income decrease graph vectors Graph of of decreasing level of income, taxes. Vector illustration in schedule schematic style
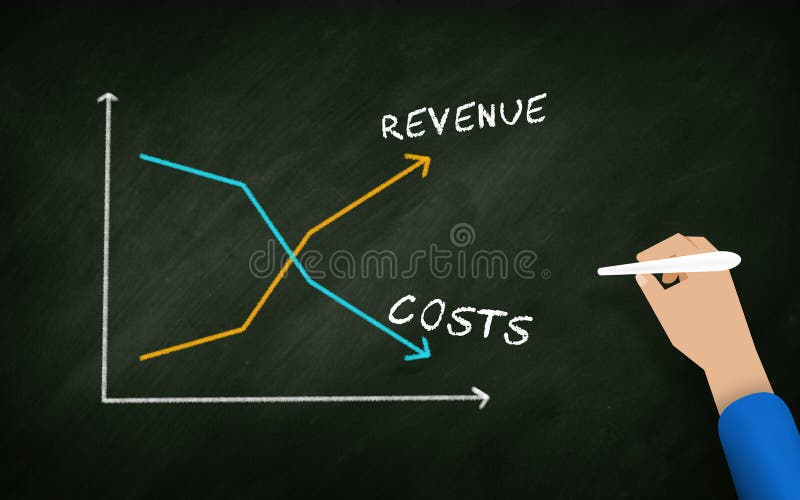
Free with trial Revenue Costs Graph on blackboard. Revenue Increase and Cost decrease. drawing In chalk board by businessman Hand. Income decrease graph illustrations Revenue Costs Graph on blackboard. Revenue Increase and Cost decrease. drawing In chalk board by businessman Hand
Free with trial Green line graph on a pink background with a downward arrow. Business trend showing decline and fall. Financial analysis and performance concept. Income decrease graph illustrations Green line graph on a pink background with a downward arrow. Business trend showing decline and fall
Free with trial Financial arrows up and down. Vector graph with green and red arrows. Chart with increase, decrease. Vector 10 EPS. Income decrease graph vectors Financial arrows up and down. Vector graph with green and red arrows. Chart with increase, decrease.
Free with trial Business finance crisis concept. cost reduction management. arrow line decrease money graph fall down symbol. economy stretching rising drop. lost bankrupt declining. loss of income capital chart crash currency cut decline decreasing design diagram dollar economic failure falling financial flat global graphic illustration inflation low lower market price pricing profit rate recession risk vector background account calculator cash efficiency improve reduce. Income decrease graph vectors Business finance crisis concept. cost reduction management. arrow line decrease money graph fall down symbol. economy stretching
Free with trial Profit rise and fall graph. Infographic with up and down arrow. Increase and decrease in amount money. Banknotes heap. Financial success. Economy crisis and recession. Statistics chart. Vector concept. Income decrease graph vectors Profit rise and fall graph. Infographic with up and down arrow. Increase and decrease in amount money. Banknotes heap. Financial
Free with trial Iconographic display of economic downturn and business challenges. A black bar graph accompanied by a descending arrow, representing loss, decrease, and negative market trends. Useful for financial reports and risk analysis. Income decrease graph illustrations Black bar chart with downward arrow signifying financial decline and negative market performance. Iconographic display of economic downturn and business challenges. A black bar graph accompanied by a descending arrow, representing loss, decrease, and negative market trends. Useful for financial reports and risk analysis
Free with trial Businessman runs and holds coins on a red arrow graph decrease on a stack of coins to coin slot. Business Down, wealth create, financial, investment goal, corporate develop, economic, profit and loss. Income decrease graph vectors Businessman runs and holds coins on a red arrow graph decrease on a stack of coins to coin slot. Business Down, wealth create
Free with trial Financial chart graphic with coins, blue bar graph, blurred orange line chart. Business profit, income growth, investment, financial analysis, marketing, economic saving money concept. Income decrease graph illustrations Financial chart graphic with coins, blue bar graph, blurred orange line chart. Business profit, income growth, investment
Free with trial The bank icon depicts a picture of a dollar interest rate cut. Money symbol with arrow stretched down, profit decrease, income, economy and income, icons for business concepts. generative ai. Income decrease graph illustrations The bank icon depicts a picture of a dollar interest rate cut. Money symbol with arrow stretched down, profit decrease, income
Free with trial Businessman throwing red line graph arrow to target on falling gold coins bar graph for investment rebalancing and gold market risk management crisis concept. Income decrease graph vectors Businessman throwing red line graph arrow to target on falling gold coins bar graph for investment rebalancing and gold market
Free with trial The bank icon depicts a picture of a dollar interest rate cut. Money symbol with arrow stretched down, profit decrease, income, economy and income, icons for business concepts. generative ai. Income decrease graph illustrations The bank icon depicts a picture of a dollar interest rate cut. Money symbol with arrow stretched down, profit decrease, income
Free with trial The bank icon depicts a picture of a dollar interest rate cut. Money symbol with arrow stretched down, profit decrease, income, economy and income, icons for business concepts. generative ai. Income decrease graph illustrations The bank icon depicts a picture of a dollar interest rate cut. Money symbol with arrow stretched down, profit decrease, income
Free with trial The bank icon depicts a picture of a dollar interest rate cut. Money symbol with arrow stretched down, profit decrease, income, economy and income, icons for business concepts. generative ai. Income decrease graph illustrations The bank icon depicts a picture of a dollar interest rate cut. Money symbol with arrow stretched down, profit decrease, income
Free with trial Businessman throwing red line graph arrow to target on falling gold bars bar graph for precious metal investment rebalancing and risk management during market crash. Income decrease graph vectors Businessman throwing red line graph arrow to target on falling gold bars bar graph for precious metal investment rebalancing and
Free with trial The bank icon depicts a picture of a dollar interest rate cut. Money symbol with arrow stretched down, profit decrease, income, economy and income, icons for business concepts. generative ai. Income decrease graph illustrations The bank icon depicts a picture of a dollar interest rate cut. Money symbol with arrow stretched down, profit decrease, income
Free with trial The bank icon depicts a picture of a dollar interest rate cut. Money symbol with arrow stretched down, profit decrease, income, economy and income, icons for business concepts. generative ai. Income decrease graph illustrations The bank icon depicts a picture of a dollar interest rate cut. Money symbol with arrow stretched down, profit decrease, income
Free with trial The bank icon depicts a picture of a dollar interest rate cut. Money symbol with arrow stretched down, profit decrease, income, economy and income, icons for business concepts. generative ai. Income decrease graph illustrations The bank icon depicts a picture of a dollar interest rate cut. Money symbol with arrow stretched down, profit decrease, income
Free with trial Businessman throwing red line graph arrow to target on falling banknotes bar graph for risk management investment rebalancing and financial loss prevention concept. Income decrease graph vectors Businessman throwing red line graph arrow to target on falling banknotes bar graph for risk management investment rebalancing and. Financial loss prevention
Free with trial Decreasing graph and income word on blueprint background. Income decrease graph vectors Income Down Blueprint. Decreasing graph and income word on blueprint background
Free with trial Businessman sets a goal about business development and income growth, man strives forward and upward on the growing graph to the piggy bank, banner. Flat vector illustration. Income decrease graph vectors Businessman sets a goal about business development and income growth, man strives forward and upward on the growing
Free with trial Percent decrease arrow vector icon. GDP market business profit percent arrow down graph. Income decrease graph vectors Percent decrease arrow vector icon. GDP market business percent arrow down. Percent decrease arrow vector icon. GDP market business profit percent arrow down graph
Free with trial Financial decrease concept with stacked gold coins and a red arrow pointing down, clearly labeled with word decrease. Represents falling value, investment loss, and economic downturn. Decline of wealth. Income decrease graph illustrations Stack Of Gold Coins With Red Down Arrow Indicating Decrease In Financial Value. Financial decrease concept with stacked gold coins and a red arrow pointing down, clearly labeled with word decrease. Represents falling value, investment loss, and economic downturn. Decline of wealth
Free with trial Money loss. Economic crisis or bankruptcy. Cartoon bag with gold coins and bundles of banknotes. Graph of falling financial indicators. Illiquid investment and income decline, vector illustration. Income decrease graph illustrations Money loss. Economic crisis or bankruptcy. Bag with coins and bundles of banknotes. Graph of falling financial. Money loss. Economic crisis or bankruptcy. Cartoon bag with gold coins and bundles of banknotes. Graph of falling financial indicators. Illiquid investment and income decline, vector illustration
Free with trial Budget deficit, finance shrinkage, income decrease, business devaluation, corporate expenses, financial burden, negative trend, vector icon, flat illustration. Income decrease graph vectors Financial shrinkage, business devaluation, budget deficit, corporate expenses, income lowering, vector icon. Budget deficit, finance shrinkage, income decrease, business devaluation, corporate expenses, financial burden, negative trend, vector icon, flat illustration
Free with trial Budget deficit, finance shrinkage, income decrease, business devaluation, corporate expenses, financial burden, negative trend, vector icon, flat illustration. Income decrease graph vectors Financial shrinkage, business devaluation, budget deficit, corporate expenses, income lowering, vector icon. Budget deficit, finance shrinkage, income decrease, business devaluation, corporate expenses, financial burden, negative trend, vector icon, flat illustration
Free with trial Businessman riding piggy bank jumping down on falling money banknotes bar graph staircase escaping red arrow spear during stock market crash and financial investment loss. Income decrease graph vectors Businessman riding piggy bank jumping down on falling money banknotes bar graph staircase escaping red arrow spear during stock
Free with trial Vector illustration of dollar rate decrease icon. Money symbol with stretching arrow down. Decrease profit, salary, income, cost, price, economy and revenue. Icon for business concept. Income decrease graph vectors Vector illustration of dollar rate decrease icon. Money symbol with stretching arrow down. Decrease profit, salary, income, cost
Free with trial Gold bars on graph and arrow up, growth, chart gold with increase and decrease, gold profit and loss concept. Income decrease graph vectors Gold bars on graph and arrow up, growth, chart gold with increase and decrease, gold profit and loss concept
Free with trial Bar graph showing a downward trend, business decline, economic decrease, market analysis, financial chart. Income decrease graph vectors Bar chart with downward trend arrow business decline graph. Bar graph showing a downward trend, business decline, economic decrease, market analysis, financial chart
Free with trial Businessman riding piggy bank jumping down on falling gold bars bar graph staircase escaping red arrow spear during stock market crash and precious metal investment loss. Income decrease graph vectors Businessman riding piggy bank jumping down on falling gold bars bar graph staircase escaping red arrow spear during stock market
Free with trial Sad man holds declining chart symbolizing beginning of crisis and financial recession affecting income. Upset guy with red down arrow reports decrease in number of clients or decrease in wages. Income decrease graph vectors Sad man holds declining chart symbolizing beginning crisis and financial recession affecting income. Sad man holds declining chart symbolizing beginning of crisis and financial recession affecting income. Upset guy with red down arrow reports decrease in number of clients or decrease in wages
Free with trial Red 3D pole graph showing stable increase, or decrease if flipped. 3D render. Income decrease graph illustrations Red 3D pole graph showing stable increase. Red 3D pole graph showing stable increase, or decrease if flipped. 3D render.
Free with trial Budget deficit, finance shrinkage, income decrease, business devaluation, corporate expenses, financial burden, negative trend, vector icon, flat illustration. Income decrease graph vectors Financial shrinkage, business devaluation, budget deficit, corporate expenses, income lowering, vector icon. Budget deficit, finance shrinkage, income decrease, business devaluation, corporate expenses, financial burden, negative trend, vector icon, flat illustration
Free with trial Blue calculator and gold coins near downward trending blue graph. Financial loss and budget, calculation concept. Business analytics data. Economic recession illustration. Digital accounting. Income decrease graph illustrations Blue calculator and gold coins near downward trending blue graph. Financial loss and budget calculation concept. Business. Blue calculator and gold coins near downward trending blue graph. Financial loss and budget, calculation concept. Business analytics data. Economic recession illustration. Digital accounting
Free with trial Decline stage concept. Finance crisis with falling down graph and income decrease. Idea of bancruptcy and business risk. Money loss. Isolated flat vector illustration. Income decrease graph vectors Decline stage concept. Finance crisis with falling down graph
Free with trial Red arrow going down stock icon on white background. Decrease, Bankruptcy, financial market crash icon for your web site design, logo, app, UI. graph chart downtrend symbol. chart going down sign. Income decrease graph vectors Red arrow going down stock icon on white background. Decrease, Bankruptcy, financial market crash icon