Free with trial Graph showing decrease in profits or earnings in 3D. Income decrease graph illustrations Column graph 3d. Graph showing decrease in profits or earnings in 3D
Free with trial Market trader or businessman frustrated by falling financial graph, economy, profit or crisis, vector cartoon stick figure or character illustration. Income decrease graph vectors Businessman or Trader Is Frustrated by Falling Financial Graph, Vector Cartoon Stick Figure Illustration. Market trader or businessman frustrated by falling financial graph, economy, profit or crisis, vector cartoon stick figure or character illustration.
Free with trial Business Graph Up and Down, Financial Green arrow up and red arrow down. Stock exchange concept show about profit and loss trading. Vector Illustration. Income decrease graph vectors Business Graph Up and Down, Financial Green arrow up and red arrow down, Stock market concept. Vector illustration. Business Graph Up and Down, Financial Green arrow up and red arrow down. Stock exchange concept show about profit and loss trading. Vector Illustration
Free with trial 3d economic crisis bar graph chart with red arrow going down bankruptcy financial stock market crash downtrend symbol chart going down sign on green blue mint pastel color background 3D rendering. Income decrease graph illustrations 3d economic crisis bar graph chart with red arrow going down bankruptcy financial stock market crash downtrend symbol chart going
Free with trial Increase, recession, growth, decline, success business flat concept illustration. Graph arrows depict increase, decrease business. Vector template element for infographic, web, presentation, networks. Income decrease graph vectors Increase, recession, growth, decline, success business arrows. F. Increase, recession, growth, decline, success business flat concept illustration. Graph arrows depict increase, decrease business. Vector template element for infographic, web, presentation, networks.
Free with trial Bad finance graph. Loss of financial savings, inflation schedule and money loss. Bankruptcy, financial investment loss or market debt crisis. Low finance business isolated vector illustration. Income decrease graph vectors Bad finance graph. Loss of financial savings, inflation schedule and money loss. Bankruptcy vector illustration. Bad finance graph. Loss of financial savings, inflation schedule and money loss. Bankruptcy, financial investment loss or market debt crisis. Low finance business isolated vector illustration
Free with trial 3D stock chart. Invest trade market. Forex candlestick graph of economy data exchange. Digital business technology. Investment infographic render arrow buttons. Profit rate motion. Vector background. Income decrease graph vectors 3D stock chart. Invest trade market. Forex candlestick graph of economy data exchange. Business technology. Investment infographic. 3D stock chart. Invest trade market. Forex candlestick graph of economy data exchange. Digital business technology. Investment infographic render arrow buttons. Profit rate motion. Vector background
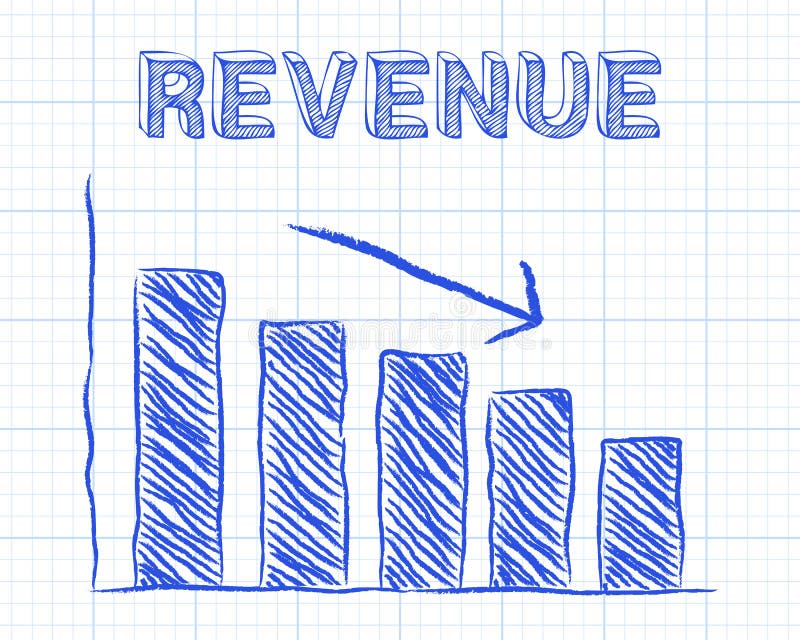
Free with trial Decreasing graph and revenue word on graph paper background. Income decrease graph vectors Revenue Down Graph Paper. Decreasing graph and revenue word on graph paper background
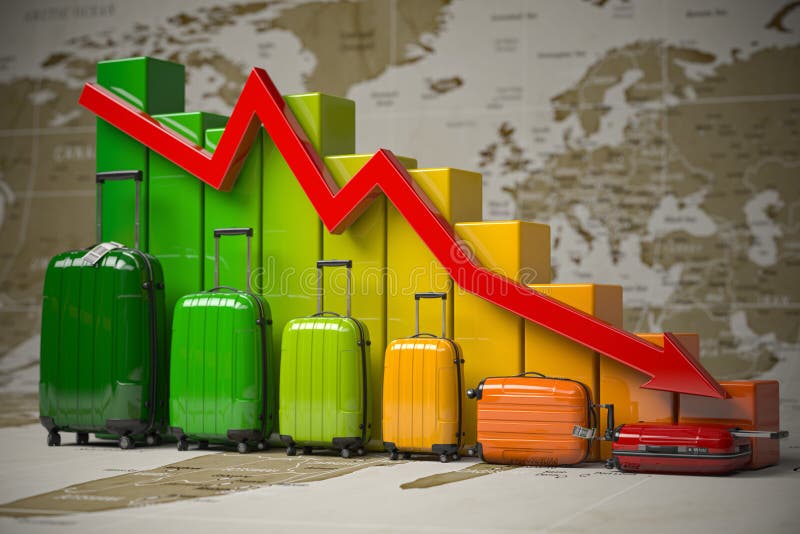
Free with trial Crisis in travel and tourism industry. Graph and diagram from suitcases on the map of world. 3d illustration. Income decrease graph illustrations Crisis in travel and tourism industry. Graph and diagram from suitcases on the map of world
Free with trial Decline graph line outline icon isolated on white. Vector illustration. Income decrease graph vectors Decline graph line outline icon
Free with trial Crisis finance graph down arrow business chart recession economy investment concept on red global inflation 3d background with loss financial stock price growth economic bankruptcy. Income decrease graph illustrations Crisis finance graph down arrow business chart recession economy investment concept on red global inflation 3d background with
Free with trial Business finance crisis concept, low sales. Money fall down symbol. Arrow decrease economy stretching rising drop. Lost crisis bankrupt declining. Cost reduction. Loss of income. vector illustration. Income decrease graph vectors Business finance crisis concept, low sales. Money fall down symbol. Arrow decrease economy stretching rising drop. Lost crisis
Free with trial 3D render of declaning bar graph with Decline text on top of the bars. Income decrease graph illustrations Gray Decline bar graph. 3D render of declaning bar graph with Decline text on top of the bars
Free with trial Money icon with arrows, capital decrease and increase, dollar rate increase, investment concept – stock vector. Income decrease graph illustrations Money icon with arrows, capital decrease and increase, dollar rate increase, investment concept – vector
Free with trial Sketched pictures, graph and chart of revenue. Income decrease graph vectors Revenue Income chart. Sketched pictures, graph and chart of revenue
Free with trial GDP decrease fall, red arrow and percent icon. Vector GDP, investment profit loss arrow down symbol. Income decrease graph vectors GDP decrease fall, red arrow percent icon. Vector GDP, investment profit loss arrow down symbol
Free with trial Graph going down and up sign with green and red arrows vector. Bar chart symbol icon with arrow moving down and sales bar chart with arrow moving up. Income decrease graph vectors Graph going down and up sign with green and red arrows vector. Bar chart symbol icon with arrow moving down and sales bar chart
Free with trial Decreasing graph and pension word on graph paper background. Income decrease graph vectors Pension Down Graph Paper. Decreasing graph and pension word on graph paper background
Free with trial Money loss vector illustration cash with down arrow stocks graph. Bad finance graph. Financial crisis, investment expenses, economic depression bankruptcy business. Cash loss graph. Income decrease graph vectors Money loss vector illustration cash with down arrow stocks graph. Bad finance graph. Financial crisis, investment
Free with trial Economic recession. The decline of the stock market. The bear market graph. Risk of business investing. Financial crisis. Prospects of the economic downturn. GDP falls. Income decrease graph vectors Economic recession graph. Economic recession. The decline of the stock market. The bear market graph. Risk of business investing. Financial crisis. Prospects of the economic downturn. GDP falls
Free with trial Falling euro currency business graph illustration. Income decrease graph illustrations Falling euro currency business graph
Free with trial Falling British pound currency business graph illustration. Income decrease graph illustrations Falling british pound currency business graph
Free with trial Tax Graph Down : A Tax Graph Down represents a decrease in tax revenue or a financial decline. Income decrease graph vectors Tax Graph Down
Free with trial Money icon with arrows, capital decrease and increase, dollar rate increase, investment concept – stock vector. Income decrease graph illustrations Money icon with arrows, capital decrease and increase, dollar rate increase, investment concept – vector
Free with trial Vector cartoon stick figure drawing conceptual illustration of man or businessman falling down along the graph arrow. Business metaphor of crisis. Income decrease graph vectors Vector Cartoon of Man or Businessman Falling Down Along the Graph Arrow. Vector cartoon stick figure drawing conceptual illustration of man or businessman falling down along the graph arrow. Business metaphor of crisis.
Free with trial Amortization accounting technique to periodically lower decrease the book value of a loan or intangible asset over time vector. Income decrease graph vectors Amortization accounting technique to periodically lower decrease the book value of a loan or intangible asset over time
Free with trial Business man crying and looking at down arrow feeling stressed about losing money or investment. Falling red graph is metaphor for financial crisis and decreasing income from investments in startup. Income decrease graph vectors Business man crying and looking at down arrow feeling stressed about losing money or investment
Free with trial Economic downturn, financial stress, investment failure, business loss, market decline, risk. Line graph shows downward trend. Financial stress and economic downturn. Income decrease graph illustrations Financial Loss Concept with Declining Line Graph, Sad Face, and Coin Symbol. Economic downturn, financial stress, investment failure, business loss, market. Economic downturn, financial stress, investment failure, business loss, market decline, risk. Line graph shows downward trend. Financial stress and economic downturn
Free with trial Revenue Income Costs Chart with sketched charts. Income decrease graph vectors Revenue Income Costs
Free with trial Increase, recession, growth, decline, success business flat concept illustration. Graph arrows depict steps of increase and decrease business. Vector elements for infographic, presentation, networks. Income decrease graph vectors Increase, recession, growth, decline, step business arrows. Flat. Increase, recession, growth, decline, success business flat concept illustration. Graph arrows depict steps of increase and decrease business. Vector elements for infographic, presentation, networks.
Free with trial 3D rendering of metallic letters spelling DEBT word placed on red rising bar graph sheet. Income decrease graph illustrations 3D debt word from metallic letters placed on bar graph sheet. 3D rendering of metallic letters spelling DEBT word placed on red rising bar graph sheet
Free with trial Economy negative prognosis, financial loss, low business performance, revenue decrease, more debt forecast, bad budget, imbalance account, vector flat illustration. Income decrease graph vectors Economy negative prognosis, financial loss, low business performance, revenue decrease
Free with trial Financial problem color line icon with money and recession graph. Vector economic crisis, bankruptcy, money loss and poverty outline symbol with decline chart arrow, dollar currency bill and coins. Income decrease graph vectors Financial problem color line icon, money and graph. Financial problem color line icon with money and recession graph. Vector economic crisis, bankruptcy, money loss and poverty outline symbol with decline chart arrow, dollar currency bill and coins
Free with trial Decline and decrease of GDP Gross domestic product - failure and breakdown of economy and finances leading to financial crisis and trouble. Vector illustration of graph, chart and diagram. Income decrease graph vectors Decline of GDP. Decline and decrease of GDP Gross domestic product - failure and breakdown of economy and finances leading to financial crisis and trouble. Vector illustration of graph, chart and diagram
Free with trial Business finance crisis concept. Money fall down symbol. Arrow decrease economy stretching rising drop. Cost reduction. Loss of income. Vector illustration on blue background. Income decrease graph vectors Business finance crisis concept. Money fall down symbol. Arrow decrease economy stretching rising drop. Cost reduction. Loss of
Free with trial This illustration depicts a financial concept with a bar graph showing a downward trend, alternating between green (profit) and red (loss) bars. A red line graph with an arrow indicates a significant decline. To the right, a stack of documents represents a profit and loss statement, with 'Profit' and 'Loss' clearly labeled. This visual is ideal for representing financial performance, business challenges, economic downturns, or the need for strategic adjustments. Income decrease graph vectors Declining Profit and Loss Statement with Downward Trend Graph. This illustration depicts a financial concept with a bar graph showing a downward trend, alternating between green (profit) and red (loss) bars. A red line graph with an arrow indicates a significant decline. To the right, a stack of documents represents a profit and loss statement, with 'Profit' and 'Loss' clearly labeled. This visual is ideal for representing financial performance, business challenges, economic downturns, or the need for strategic adjustments.
Free with trial A dollar bill connected to a bar graph resembling a sound wave with an arrow. Clear details and vibrant colors. Income decrease graph illustrations Dollar Bill and Sound Wave Bar Graph with Arrow money finance. A dollar bill connected to a bar graph resembling a sound wave with an arrow. Clear details and vibrant colors
Free with trial A 3D rendered icon depicting a blue document with a raised bar graph. The bar graph features alternating blue, orange, and yellow bars of varying heights. White lines and a circular orange and white element are also present on the blue document surface. The icon is isolated on a white background. Income decrease graph vectors 3 D blue document icon with orange and blue bar graph and white lines image. A 3D rendered icon depicting a blue document with a raised bar graph. The bar graph features alternating blue, orange, and yellow bars of varying heights. White lines and a circular orange and white element are also present on the blue document surface. The icon is isolated on a white background
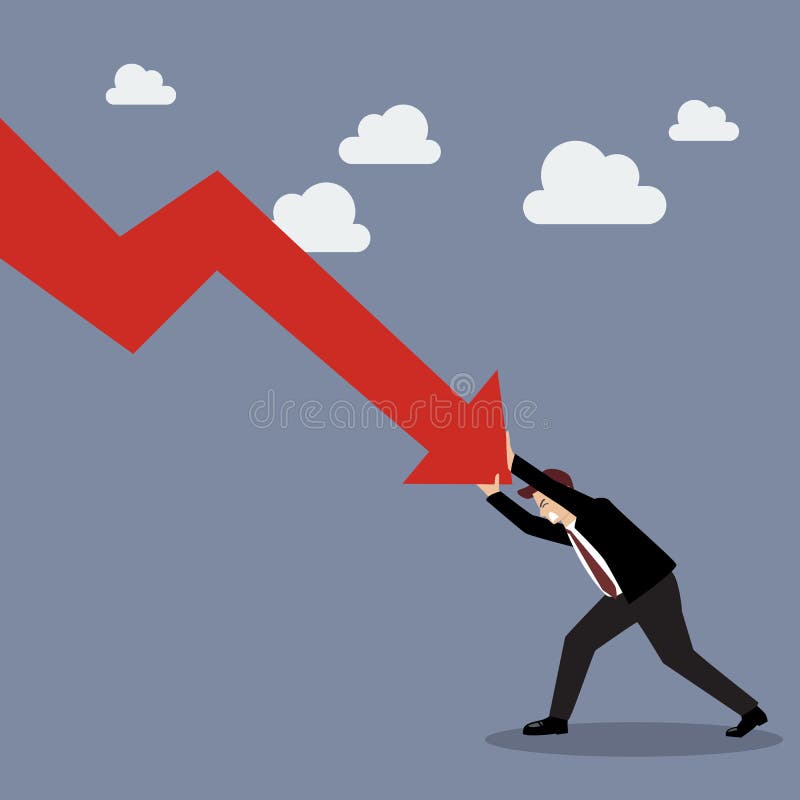
Free with trial Businessman pushing hard against falling graph down. Business Concept. Income decrease graph vectors Businessman pushing hard against falling graph down
Free with trial Company profit and loss flat icons set. Investment taxation. Calculating loss, calculating net income, international and non-resident taxes metaphors. Vector isolated concept metaphor illustrations. Income decrease graph vectors Financial loss and income vector concept metaphors. Company profit and loss flat icons set. Investment taxation. Calculating loss, calculating net income, international and non-resident taxes metaphors. Vector isolated concept metaphor illustrations
Free with trial Recession, growth, decline, reduction, downward, success of business. Flat concept illustration. Pencil graph arrows depict increase, decrease business. Vector infographic for web, presentation. Income decrease graph vectors Increase, recession, growth, decline, reduction, success business. Pencil arrow graphs. Recession, growth, decline, reduction, downward, success of business. Flat concept illustration. Pencil graph arrows depict increase, decrease business. Vector infographic for web, presentation.
Free with trial Business graph with up arrow down arrow logo template. Income decrease graph vectors Business graph with up arrow down arrow logo template
Free with trial Vector cartoon stick figure drawing conceptual illustration of man, businessman or stock investor walking and falling on the financial graph. Market cycle concept. Income decrease graph vectors Vector Cartoon Illustration of Man or Businessman or Stock Investor Walking and Falling on Financial Graph. Market Cycle. Vector cartoon stick figure drawing conceptual illustration of man, businessman or stock investor walking and falling on the financial graph. Market cycle concept.
Free with trial Business woman with down arrow symbolizing recession caused by increased inflation and onset of financial crisis. Business lady with falling graph reports decrease in marketing budget in company. Income decrease graph vectors Business woman with down arrow symbolizing recession caused by increased inflation and onset crisis. Business woman with down arrow symbolizing recession caused by increased inflation and onset of financial crisis. Business lady with falling graph reports decrease in marketing budget in company
Free with trial Cost optimization concept set. Idea of financial and marketing strategy. Cost and income balance. Spending and cost reduction, while maximizing business value. Isolated flat illustration vector. Income decrease graph vectors Cost optimization concept set. Idea of financial and marketing strategy. Cost and income balance. Spending and cost. Cost optimization concept set. Idea of financial and marketing strategy. Cost and income balance. Spending and cost reduction, while maximizing business value. Isolated flat illustration vector
Free with trial Graph show value loss of dollar, modern trendy colors, gradient arrow and purple usd symbols, vector illustration. Income decrease graph vectors Graph show value loss of dollar, modern trendy colors, gradient arrow and purple usd symbols
Free with trial Financial arrows up and down. Financial growth and decline. Graph with green and red arrows. Finance diagram, graphic charts icon set. Income decrease graph vectors Financial arrows up and down. Financial growth and decline. Graph with green and red arrows. Finance diagram, graphic charts icon
Free with trial Graph show value loss of euro, modern trendy colors, gradient arrow and purple eur symbols, vector illustration. Income decrease graph vectors Graph show value loss of euro, modern trendy colors, gradient arrow and purple eur symbols
Free with trial Downward curved arrow icon set. Decrease direction sign symbol vector. Income decrease graph vectors Downward curved arrow icon set. Decrease direction sign symbol
Free with trial Vector cartoon stick figure drawing conceptual illustration of man, businessman or stock investor walking and falling on the financial graph. Market cycle concept. Income decrease graph vectors Vector Cartoon Illustration of Man or Businessman or Stock Investor Walking and Falling on Financial Graph. Market Cycle. Vector cartoon stick figure drawing conceptual illustration of man, businessman or stock investor walking and falling on the financial graph. Market cycle concept.
Free with trial Financial crisis. Poor man with empty pockets watching falling arrow. Cartoon employee character losing money, economy recession concept vector. Company bankruptcy or income decrease. Income decrease graph vectors Financial crisis. Poor man with empty pockets watching falling arrow. Cartoon employee character losing money
Free with trial Cost optimization concept set. Idea of financial and marketing strategy. Cost and income balance. Spending and cost reduction, while maximizing business value. Isolated flat illustration vector. Income decrease graph vectors Cost optimization concept set. Idea of financial and marketing strategy. Cost and income balance. Spending and cost. Cost optimization concept set. Idea of financial and marketing strategy. Cost and income balance. Spending and cost reduction, while maximizing business value. Isolated flat illustration vector
Free with trial Sad businessman down arrow graph. vector. Income decrease graph vectors Sad businessman down arrow graph
Free with trial Fall down chart, financial crisis. Decreasing arrow showing bankruptcy. Bad economic statistics with income loss. Money or price reduction report symbols, recession concept isolated vector set. Income decrease graph vectors Fall down chart, financial crisis. Decreasing arrow showing bankruptcy. Bad economic statistics with income loss
Free with trial Red curved arrow icon in flat style. Decrease direction sign symbol vector. Income decrease graph vectors Red curved arrow icon in flat style. Decrease direction sign symbol
Free with trial Businessman hand holding digital graph with cost reduction concept showing financial growth saving strategy economic efficiency and business success in modern finance. Income decrease graph illustrations Businessman hand holding digital graph with cost reduction concept showing financial growth saving strategy economic efficiency
Free with trial Two flat design icons with color. One depicts an upward bar chart with a blue arrow and percentage, the other a downward bar chart with a grey arrow and percentage. Income decrease graph vectors Color Bar Chart Icons for Increase and Decrease graph Ai-Generated. Two flat design icons with color. One depicts an upward bar chart with a blue arrow and percentage, the other a downward bar chart with a grey arrow and percentage
Free with trial Simple Chart graph diagram bar histograms. Income decrease graph vectors Chart graph diagram bar histograms
Free with trial Simple Chart graph diagram bar histograms. Income decrease graph vectors Chart graph diagram bar histograms
Free with trial Vector cartoon stick figure drawing conceptual illustration of two men or businessmen running away in panic from the falling financial graph arrow. Crisis or recession concept. Income decrease graph vectors Vector Cartoon Illustration of Two Men or Businessmen Running Away in Panic From the Falling Financial Graph Arrow. Vector cartoon stick figure drawing conceptual illustration of two men or businessmen running away in panic from the falling financial graph arrow. Crisis or recession concept.
Free with trial Simple Chart graph diagram bar histograms. Income decrease graph vectors Chart graph diagram bar histograms
Free with trial Line graph with a green line and a red dot on top. The red dot is located at the top left corner of the graph. Income decrease graph illustrations Graph with a green line and a red dot
Free with trial Frozen graph showing a downward trend. Cold economy concept, financial crisis, declining business, and cold market conditions. Income decrease graph illustrations Frozen graph showing a downward trend. Cold economy concept, financial crisis, declining business
Free with trial Simple Chart graph diagram bar histograms. Income decrease graph vectors Chart graph diagram bar histograms
Free with trial Businessman hand pushing a business graph on a touch screen interface. Hand holding business graph. Isolated on white background. Vector illustration flat design. Income decrease graph vectors Businessman hand pushing a business graph on a touch screen interface.Hand holding business graph.Isolated on white background.
Free with trial Money growth and fall on chart graph with arrow up and down, financial business invest. Vector flat illustration. Income decrease graph vectors Money growth and fall on chart graph with arrow up and down, financial business invest. Vector illustration
Free with trial Salary increase with bar graph on white background. Income decrease graph illustrations Salary increase with bar graph on white
Free with trial Isometric illustration of a woman analyzing a graph with a magnifying glass, laptop, and coins, representing finance and business analysis. Income decrease graph vectors Woman analyzes graph with magnifying glass and laptop coin. isometric illustration of a woman analyzing a graph with a magnifying glass, laptop, and coins, representing finance and business analysis.
Free with trial Cost reduction concept. Vector of a businessman pulling down an arrow of the graph. Income decrease graph vectors Vector of a businessman pulling down an arrow of the graph
Free with trial Colorful bar graph with stacked segments illustrating growth and data analysis. Income decrease graph vectors Colorful bar graph with stacked segments illustrating growth and data analysis
Free with trial Business decline, Businessman examines decreasing bar graph and chart. Income decrease graph vectors Business decline, Businessman examines decreasing bar graph and chart
Free with trial Dollar down and up icon in trendy style. USD currency decrease and increase sign symbol vector. Income decrease graph vectors Dollar down and up icon in trendy style. USD currency decrease and increase sign symbol
Free with trial Business finance crisis concept. money fall down with arrow decrease symbol. economy stretching rising drop, global lost bankrupt. cost declining reduction or loss of income. vector illustration. Income decrease graph vectors Business finance crisis concept. money fall down with arrow decrease symbol. economy stretching rising drop, global lost bankrupt
Free with trial A clear glass jar labeled 'savings' tips over, spilling gold and silver coins onto a reflective surface, with a red downward trending graph in the background symbolizing financial loss or economic decline. Income decrease graph illustrations Glass jar labeled savings spilling coins with downward trending graph. A clear glass jar labeled 'savings' tips over, spilling gold and silver coins onto a reflective surface, with a red downward trending graph in the background symbolizing financial loss or economic decline
Free with trial Financial planning graph shows coins and pen. Income decrease graph illustrations Financial planning graph shows coins and pen
Free with trial Percentage increase decrease arrow up down icon simple line stroke outline icon graphic set, money price cost loss growth sign symbol pictogram label, fund interest revenue rate results image. Income decrease graph vectors Percentage increase decrease arrow up down icon simple line stroke outline icon graphic set, money price cost loss growth sign
Free with trial Percentage increase decrease arrow up down icon simple line stroke outline icon graphic set, money price cost loss growth sign symbol pictogram label, fund interest revenue rate results image. Income decrease graph illustrations Percentage increase decrease arrow up down icon simple line stroke outline icon graphic set, money price cost loss growth sign
Free with trial A businessman is shown stacking coins on a wooden desk, with a prominent red downward arrow graph overlaying the image, symbolizing a financial crisis, economic recession, or market downturn. A calculator and scattered coins are also visible, emphasizing financial concepts. Income decrease graph illustrations Businessman stacking coins with a red downward arrow graph indicating financial crisis and economic recession. A businessman is shown stacking coins on a wooden desk, with a prominent red downward arrow graph overlaying the image, symbolizing a financial crisis, economic recession, or market downturn. A calculator and scattered coins are also visible, emphasizing financial concepts
Free with trial Percent arrows up and down icon set. Income and cost increase and decrease arrow icons. Income decrease graph vectors Percent arrows up and down icon set