Free with trial A white line graph icon with three data points is displayed on a dark circular button against a white background. Performance decrease illustrations Line Graph Icon on Dark Circular Button with White Background chart data. A white line graph icon with three data points is displayed on a dark circular button against a white background
Free with trial The image shows a whiteboard with a red bar chart that initially rises and then sharply declines, accompanied by a downward-sloping red arrow. The chart is set against a white background and is placed on a wooden easel stand, indicating a visual representation of a downward trend or decline in data. Performance decrease illustrations Whiteboard displaying a declining trend with a red bar chart and downward arrow. The image shows a whiteboard with a red bar chart that initially rises and then sharply declines, accompanied by a downward-sloping red arrow. The chart is set against a white background and is placed on a wooden easel stand, indicating a visual representation of a downward trend or decline in data
Free with trial Icon showing black bar graph icon between two horizontal lines on white background keywords: graph, bar. Performance decrease illustrations Black bar graph icon between two horizontal lines on white background Keywords: graph, bar
Free with trial A bar chart displaying varying data points, with a prominent red bar signifying a downturn or negative outcome amidst generally positive trends, highlighting a specific area of concern. Performance decrease illustrations Bar chart with one red bar indicating a decline isolated on white background. A bar chart displaying varying data points, with a prominent red bar signifying a downturn or negative outcome amidst generally positive trends, highlighting a specific area of concern
Free with trial A digital showing the word RISK in blue letters with a downward-pointing arrow, surrounded by stock market charts and data on. Performance decrease illustrations Financial risk concept with a glowing blue downward arrow and stock market data generated using ai. A digital showing the word RISK in blue letters with a. A digital showing the word RISK in blue letters with a downward-pointing arrow, surrounded by stock market charts and data on
Free with trial Glossy polished 3D red segmented downward arrow, ideal for illustrating market decline, economic downturn, financial loss, stock market crashes, business recession, and corporate financial downturn concepts for financial reports, marketing assets and business content , stunning visual effect. Performance decrease vectors Red Arrow Shows Decline with Statistics Concept and Economic Downturn. Glossy polished 3D red segmented downward arrow, ideal for illustrating market decline, economic downturn, financial loss, stock market crashes, business recession, and corporate financial downturn concepts for financial reports, marketing assets and business content , stunning visual effect
Free with trial A visual representation of a sales funnel with distinct colored stages, each indicating a percentage drop from 20% down to 1. Performance decrease illustrations Colorful sales funnel diagram showing decreasing percentages from 20% to 1. A visual representation of a sales funnel with distinct colored stages, each indicating a percentage drop from 20% down to 1
Free with trial A vibrant and detailed bar chart with a line graph overlay, showcasing financial data trends over time. The chart features a variety of colors, including shades of green, purple, and blue, with data points marked by small diamond shapes. The background is a dark blue grid, providing a stark contrast to the colorful data visualization. Performance decrease illustrations Colorful bar chart and line graph representing financial data trends. A vibrant and detailed bar chart with a line graph overlay, showcasing financial data trends over time. The chart features a variety of colors, including shades of green, purple, and blue, with data points marked by small diamond shapes. The background is a dark blue grid, providing a stark contrast to the colorful data visualization
Free with trial A black icon of a line graph showing a downward trend on a white background. Clear details and vibrant colors. Performance decrease illustrations Black icon of a downward trending graph on white background chart decline. A black icon of a line graph showing a downward trend on a white background. Clear details and vibrant colors
Free with trial Information showing black bar graph with upward arrow and descending bars keywords: bar chart, graph, data. Performance decrease illustrations Black bar graph with upward arrow and descending bars Keywords: bar chart, graph, data
Free with trial Marketing. A vibrant and modern bar graph with glowing neon colors represents data and business growth. Performance decrease illustrations Glowing Bar Graph Data Visualization, Business Growth, Statistics, marketing. marketing. A vibrant and modern bar graph with glowing neon colors represents data and business growth.
Free with trial Abstract line graph with four distinct data points connected by red line, indicating trend analysis and progress. Simple design. Performance decrease vectors Line graph with colored points showing data points and trend on white background. Abstract line graph with four distinct data points connected by red line, indicating trend analysis and progress. Simple design
Free with trial Minimalist graphic of a bold downward arrow piercing a cloud, ideal for business, finance, or economic decline concepts in presentations, infographics, and marketing materials. Performance decrease vectors Downward black arrow through fluffy cloud symbolizing decline or downturn. Minimalist graphic of a bold downward arrow piercing a cloud, ideal for business, finance, or economic decline concepts in presentations, infographics, and marketing materials
Free with trial A green arrow points downward, while a red arrow points upward, symbolizing opposing forces, trends, or choices on a white background. created ai. Performance decrease illustrations Green down arrow and red up arrow representing contrasting trends or directions. A green arrow points downward, while a red arrow points upward, symbolizing opposing forces, trends, or choices on a white background.created ai
Free with trial This abstract digital artwork features a blue and gray bar graph with data points highlighting growth trends on a dark background, ideal for business and analytics themes Generative AI. Performance decrease illustrations Blue and Gray Bar Graph with Data Points Representing Growth Trends and Statistical Analysis in Digital Format on Dark Background. This abstract digital artwork features a blue and gray bar graph with data points highlighting growth trends on a dark background, ideal for business and analytics themes Generative AI
Free with trial A red bar chart illustrating a significant downward trend, labeled 'Loss', indicating financial decline or business failure. Isolated on a white background. Performance decrease illustrations Red Bar Chart Graph Showing Downward Trend with Loss Text, Business Decline. A red bar chart illustrating a significant downward trend, labeled 'Loss', indicating financial decline or business failure. Isolated on a white background
Free with trial The image shows a white easel holding a presentation board with a combination of a red bar and line graph. The graph illustrates a downward trend, starting with high values that progressively decrease over time. The bars are tall initially and shorten as they move rightward, while the line graph follows a similar declining pattern, emphasizing a significant drop in values. Performance decrease illustrations Declining trend represented by a bar and line graph on an easel display. The image shows a white easel holding a presentation board with a combination of a red bar and line graph. The graph illustrates a downward trend, starting with high values that progressively decrease over time. The bars are tall initially and shorten as they move rightward, while the line graph follows a similar declining pattern, emphasizing a significant drop in values
Free with trial The image shows a series of vertical bars in decreasing height from left to right, each bar colored differently (blue, green, yellow, orange). A bold red diagonal line with an arrow at the end overlays the bars, indicating a downward trend or decline in values. This visual representation is often used to depict a reduction in data metrics over time or categories. Performance decrease illustrations Declining bar chart with a downward trend line overlaying colorful bars. The image shows a series of vertical bars in decreasing height from left to right, each bar colored differently (blue, green, yellow, orange). A bold red diagonal line with an arrow at the end overlays the bars, indicating a downward trend or decline in values. This visual representation is often used to depict a reduction in data metrics over time or categories
Free with trial This is an detailed collection of line icons depicting market fluctuations, financial downturns, recovery patterns, and technical analysis indicators. Performance decrease vectors Market volatility and financial loss icons with bull and bear market cycle symbols. This is an detailed collection of line icons depicting market fluctuations, financial downturns, recovery patterns, and technical analysis indicators
Free with trial This vector file contains business chart icons including rising bar graphs, falling graphs, and pie chart symbols illustrating data trends in a simple style professional and clear mood. Generative AI. Performance decrease vectors Business chart icons set with rising and falling graphs pie chart symbols vector illustration. This vector file contains business chart icons including rising bar graphs, falling graphs, and pie chart symbols illustrating data trends in a simple style professional and clear mood. Generative AI
Free with trial Businessman on percentage sign with falling down. Investor run away from risk collapsing box. Businesswoman presenting idea with graph and visual data on board. Success talent concept. Performance decrease vectors Profit Fall in Economic Recession. Avoid Risk. Presenting Visual Data On Board. Businessman on percentage sign with falling down. Investor run away from risk collapsing box. Businesswoman presenting idea with graph and visual data on board. Success talent concept
Free with trial Down trend financial graph with arrow pointing down symbolizing business decline. Performance decrease vectors Down trend financial graph with arrow pointing down symbolizing business decline
Free with trial A hand holds a magnifying glass over a red upward arrow, surrounded by black downward arrows. Symbolizes growth analysis, business trends, and investment opportunities. Performance decrease illustrations A hand holding a magnifying glass over a red upward arrow amidst downward black arrows on a light background. A hand holds a magnifying glass over a red upward arrow, surrounded by black downward arrows. Symbolizes growth analysis, business trends, and investment opportunities.
Free with trial A black triangle warning sign with a white icon of a downward trending graph and arrow. Performance decrease illustrations Black triangle warning sign with downward trending graph icon danger alert. A black triangle warning sign with a white icon of a downward trending graph and arrow
Free with trial Black bar chart with decreasing bar heights showing a downward trend on white background. Performance decrease illustrations Black bar chart showing a downward trend on a white background graph decline. Black bar chart with decreasing bar heights showing a downward trend on white background
Free with trial A detailed illustration of a business growth chart with multiple lines, representing profit, trend, and loss, along with various financial indicators and icons. Performance decrease vectors Business growth chart with multiple lines and various financial indicators. A detailed illustration of a business growth chart with multiple lines, representing profit, trend, and loss, along with various financial indicators and icons
Free with trial This 3D illustration depicts a financial report represented by a document with a bar chart and a line graph. The bar chart shows alternating red and blue bars, while a blue line graph with an upward arrow indicates a positive trend. A yellow and purple magnifying glass is positioned over the chart, suggesting analysis and scrutiny. The artwork is set against a subtle light purple background. Performance decrease illustrations 3D illustration of a financial report with a magnifying glass and bar chart on a light purple background. This 3D illustration depicts a financial report represented by a document with a bar chart and a line graph. The bar chart shows alternating red and blue bars, while a blue line graph with an upward arrow indicates a positive trend. A yellow and purple magnifying glass is positioned over the chart, suggesting analysis and scrutiny. The artwork is set against a subtle light purple background
Free with trial Illustration of financial line graph showing growth. Upward trending arrow, chart, bar chart, income, finance, business, statistics development. Visual representation of success. Performance decrease illustrations Illustration of financial line graph showing growth. Upward trending arrow, chart, bar chart, income, finance, business
Free with trial Silhouettes depict male figures interacting with downward-pointing arrows, symbolizing business loss or decline. One figure gestures towards a large arrow, another walks alongside it. The minimalist design uses solid black on a white background, emphasizing the concept of financial reduction or setbacks. Arrow sizes vary, enhancing the visual representation of movement or direction. Performance decrease vectors A set of Business Loss Concept with Male Figure. Silhouettes depict male figures interacting with downward-pointing arrows, symbolizing business loss or decline. One figure gestures towards a large arrow, another walks alongside it. The minimalist design uses solid black on a white background, emphasizing the concept of financial reduction or setbacks. Arrow sizes vary, enhancing the visual representation of movement or direction.
Free with trial Silhouettes depict male figures interacting with downward-pointing arrows, symbolizing business loss or decline. One figure gestures towards a large arrow, another walks alongside it. The minimalist design uses solid black on a white background, emphasizing the concept of financial reduction or setbacks. Arrow sizes vary, enhancing the visual representation of movement or direction. Performance decrease vectors A set of Business Loss Concept with Male Figure. Silhouettes depict male figures interacting with downward-pointing arrows, symbolizing business loss or decline. One figure gestures towards a large arrow, another walks alongside it. The minimalist design uses solid black on a white background, emphasizing the concept of financial reduction or setbacks. Arrow sizes vary, enhancing the visual representation of movement or direction.
Free with trial Silhouettes depict male figures interacting with downward-pointing arrows, symbolizing business loss or decline. One figure gestures towards a large arrow, another walks alongside it. The minimalist design uses solid black on a white background, emphasizing the concept of financial reduction or setbacks. Arrow sizes vary, enhancing the visual representation of movement or direction. Performance decrease vectors A set of Business Loss Concept with Male Figure. Silhouettes depict male figures interacting with downward-pointing arrows, symbolizing business loss or decline. One figure gestures towards a large arrow, another walks alongside it. The minimalist design uses solid black on a white background, emphasizing the concept of financial reduction or setbacks. Arrow sizes vary, enhancing the visual representation of movement or direction.
Free with trial Silhouettes depict male figures interacting with downward-pointing arrows, symbolizing business loss or decline. One figure gestures towards a large arrow, another walks alongside it. The minimalist design uses solid black on a white background, emphasizing the concept of financial reduction or setbacks. Arrow sizes vary, enhancing the visual representation of movement or direction. Performance decrease vectors A set of Business Loss Concept with Male Figure. Silhouettes depict male figures interacting with downward-pointing arrows, symbolizing business loss or decline. One figure gestures towards a large arrow, another walks alongside it. The minimalist design uses solid black on a white background, emphasizing the concept of financial reduction or setbacks. Arrow sizes vary, enhancing the visual representation of movement or direction.
Free with trial Silhouettes depict male figures interacting with downward-pointing arrows, symbolizing business loss or decline. One figure gestures towards a large arrow, another walks alongside it. The minimalist design uses solid black on a white background, emphasizing the concept of financial reduction or setbacks. Arrow sizes vary, enhancing the visual representation of movement or direction. Performance decrease vectors A set of Business Loss Concept with Male Figure. Silhouettes depict male figures interacting with downward-pointing arrows, symbolizing business loss or decline. One figure gestures towards a large arrow, another walks alongside it. The minimalist design uses solid black on a white background, emphasizing the concept of financial reduction or setbacks. Arrow sizes vary, enhancing the visual representation of movement or direction.
Free with trial Nine flat design icons depict various data charts and graphs in muted blue and teal tones. Performance decrease vectors Collection of nine flat design data charts and graphs analysis statistics. Nine flat design icons depict various data charts and graphs in muted blue and teal tones.
Free with trial A watercolor painting of a downward trending financial chart, symbolizing market instability, economic downturn, investment risk, financial loss, and uncertainty. Spacious empty area designed for product displays and advertisements. Perfect for banners, branding, and marketing visuals. . Generative AI. Performance decrease illustrations Watercolor Chart Decline A watercolor painting of a downward trending financial chart symbolizing market instability economic. A watercolor painting of a downward trending financial chart, symbolizing market instability, economic downturn, investment risk, financial loss, and uncertainty. Spacious empty area designed for product displays and advertisements. Perfect for banners, branding, and marketing visuals. . Generative AI
Free with trial A modern 3D rendering of a vertical bar graph titled COST ANALYSIS displays multiple stacked bars of varying heights representing different percentages, with the tallest green bar at the bottom and shorter blue bars ascending upward against a dark blue background featuring a subtle grid pattern, creating a professional data visualization for financial reports, business presentations, or analytical. Performance decrease illustrations 3D rendered bar graph chart showing cost analysis with percentage data visualization in green and blue colors on dark background. A modern 3D rendering of a vertical bar graph titled COST ANALYSIS displays multiple stacked bars of varying heights representing different percentages, with the tallest green bar at the bottom and shorter blue bars ascending upward against a dark blue background featuring a subtle grid pattern, creating a professional data visualization for financial reports, business presentations, or analytical
Free with trial Black bar graph with decreasing heights indicating a downward trend on a white background. Performance decrease illustrations Black bar graph showing downward trend on white background chart statistics. Black bar graph with decreasing heights indicating a downward trend on a white background
Free with trial This image depicts a series of vertical bars of varying heights, each accompanied by directional arrows indicating upward or downward trends. The bars suggest a progression over time, with some periods showing growth (upward arrows) and others showing decline (downward arrows). The varying shades of blue-green add a visual element to differentiate between the bars, emphasizing the changes in trend. Performance decrease illustrations Visual representation of fluctuating market trends with directional arrows. This image depicts a series of vertical bars of varying heights, each accompanied by directional arrows indicating upward or downward trends. The bars suggest a progression over time, with some periods showing growth (upward arrows) and others showing decline (downward arrows). The varying shades of blue-green add a visual element to differentiate between the bars, emphasizing the changes in trend
Free with trial A black and white illustration depicting a declining graph with various symbols. A downward zigzag arrow crosses over bar graphs, symbolizing a decrease or crisis. A broken chain link, an exclamation mark inside a warning triangle, and a crossed-out megaphone suggest failure and communication issues. A laptop screen displays "404," indicating an error or page not found. These elements represent themes of disruption and technical difficulties. Performance decrease vectors Digital Marketing Failure Concept with Declining Graph and Broken Link Icons. A black and white illustration depicting a declining graph with various symbols. A downward zigzag arrow crosses over bar graphs, symbolizing a decrease or crisis. A broken chain link, an exclamation mark inside a warning triangle, and a crossed-out megaphone suggest failure and communication issues. A laptop screen displays "404," indicating an error or page not found. These elements represent themes of disruption and technical difficulties.
Free with trial Vibrant Business Data Visualization Highlighting Market Trends and Financial Metrics. Generative AI. Performance decrease illustrations Vibrant Business Data Visualization Highlighting Market Trends and Financial Metrics
Free with trial This image shows a striking contrast between a green upward arrow and a red downward arrow, symbolizing percentage changes in various contexts such as finance and growth metrics. Vector illustration. Performance decrease vectors Green and Red Arrows Indicating Percent Change Trend. This image shows a striking contrast between a green upward arrow and a red downward arrow, symbolizing percentage changes in various contexts such as finance and growth metrics. Vector illustration
Free with trial Financial data analysis bar chart icon with upward trend showing business growth. Performance decrease vectors Financial data analysis bar chart icon with upward trend showing business growth
Free with trial Illustration of a line graph connecting points above bar graph on black. Flat design with blue outlines, orange points, and blue and green bars. Performance decrease vectors Line graph and bar graph showing growth and trends, isolated on black background. Illustration of a line graph connecting points above bar graph on black. Flat design with blue outlines, orange points, and blue and green bars.
Free with trial The image shows a bar graph with bars decreasing in height from left to right. The bars transition from light blue to dark blue to red. A prominent red arrow points downwards from the top right corner of the image, emphasizing the downward trend. Performance decrease illustrations A downward trending bar graph with a prominent red arrow pointing downwards. The image shows a bar graph with bars decreasing in height from left to right. The bars transition from light blue to dark blue to red. A prominent red arrow points downwards from the top right corner of the image, emphasizing the downward trend
Free with trial Financial Report with Charts and Graphs on Clipboard, Business Data Analysis. Generative AI. Performance decrease illustrations Financial Report with Charts and Graphs on Clipboard Business Data Analysis. Financial Report with Charts and Graphs on Clipboard, Business Data Analysis. Generative AI
Free with trial Laptop displaying stock market graph on a wooden desk with plants, dynamic background Generative AI. Performance decrease illustrations Laptop displaying stock market graph on a wooden desk with plants
Free with trial Black icon of a bar graph with a downward arrow on a computer monitor screen. Clear details and vibrant colors. Performance decrease illustrations Black icon of bar graph with downward arrow on a computer monitor chart data. Black icon of a bar graph with a downward arrow on a computer monitor screen. Clear details and vibrant colors
Free with trial A black line graph with an arrow points downward indicating revenue slowdown. Clear details and vibrant colors. Performance decrease illustrations Black arrow graph showing revenue slowdown on white background chart decline. A black line graph with an arrow points downward indicating revenue slowdown. Clear details and vibrant colors
Free with trial 3D bar chart with red upward and downward arrows indicating growth and decline trends. Performance decrease vectors Graphic illustration showing upward and downward trend arrows with bar chart. 3D bar chart with red upward and downward arrows indicating growth and decline trends
Free with trial The image shows three stacks of coins, each with a percentage symbol on top. A red arrow is descending from left to right, indicating a downward trend in financial performance or interest rates. Performance decrease illustrations Stacks of coins with percentage symbols indicating a downward financial trend. The image shows three stacks of coins, each with a percentage symbol on top. A red arrow is descending from left to right, indicating a downward trend in financial performance or interest rates
Free with trial A visually captivating image of red line graph showing a sharp decline in values on a dark background. Generative AI. Performance decrease illustrations Red line graph showing a sharp decline in values on a dark background. Generative AI
Free with trial The image depicts a 3D bar chart with blue steps increasing in height, representing growth or progress. A red arrow curves upward on the left side, symbolizing an upward trend or improvement, while a red arrow curves downward on the right side, indicating a decline or negative trend. This visual contrast highlights the duality of progress and setbacks. Performance decrease illustrations Graphic showing contrasting upward and downward trends in a step-based chart. The image depicts a 3D bar chart with blue steps increasing in height, representing growth or progress. A red arrow curves upward on the left side, symbolizing an upward trend or improvement, while a red arrow curves downward on the right side, indicating a decline or negative trend. This visual contrast highlights the duality of progress and setbacks
Free with trial A bar graph showing a downward trend with blue bars and a red arrow pointing downwards, indicating a decline in value over different categories or time periods. Performance decrease illustrations Declining trend in sales and revenue over time periods indicated by bar graph. A bar graph showing a downward trend with blue bars and a red arrow pointing downwards, indicating a decline in value over different categories or time periods
Free with trial Red Bar Chart on Grunge Background Data Visualization Concept, data analysis, chart , This photo was created using generative AI. design. Performance decrease illustrations Red Bar Chart on Grunge Background Data Visualization Concept, data analysis, chart design. Red Bar Chart on Grunge Background Data Visualization Concept, data analysis, chart , This photo was created using generative AI. design
Free with trial Digital financial chart with downward trend lines and candlestick patterns on a white and blue grid background. Performance decrease illustrations Digital financial chart with downward trend lines and candlestick patterns on a white and blue grid background
Free with trial The image showcases a candlestick chart, a common tool used in financial markets to represent the price movements of assets over time. the chart is displayed against a dark background, enhancing the visibility of the red and green candlesticks. the red candlesticks indicate a decrease in price, while the green ones represent an increase. the overall trend depicted by the chart suggests a. Performance decrease illustrations A visual representation of a stock market crash, featuring a candlestick chart with red and green bars indicating price fluctuatio. the image showcases a candlestick chart, a common tool used in financial markets to represent the price movements of assets over time. the chart is displayed against a dark background, enhancing the visibility of the red and green candlesticks. the red candlesticks indicate a decrease in price, while the green ones represent an increase. the overall trend depicted by the chart suggests a
Free with trial This is an detailed collection of financial growth charts and market volatility icons in a clean minimal style. Performance decrease vectors Financial line icons showing stock market trends with bull and bear symbols. This is an detailed collection of financial growth charts and market volatility icons in a clean minimal style
Free with trial Decreasing Bar Chart With Downward Arrow Line Icon. Financial Decline, Economic Downturn, And Business Loss Outline Symbol. Market Analysis. Editable Stroke. Isolated Vector Illustration. Performance decrease vectors Decreasing Bar Chart With Downward Arrow Line Icon. Financial Decline, Economic Downturn, And Business Loss Outline
Free with trial 3D pie chart illustrating data segments with percentage values, alongside a bar graph in the background, showcasing financial or business data. Performance decrease illustrations 3D pie chart illustrating data segments with percentage values, alongside a bar graph in the background, showcasing financial or
Free with trial A 3D rendered bar graph in descending order shows decline or trend, rendered in pastel shades of blue, green, and purple. Performance decrease vectors Colorful descending bar graph illustration, 3D render, on transparent background. A 3D rendered bar graph in descending order shows decline or trend, rendered in pastel shades of blue, green, and purple.
Free with trial Red arrow declining on bar graph, business finance chart, downward trend, recession, financial data, blue background. Performance decrease illustrations Red arrow graph showing decline, business finance chart, downward trend, recession. Red arrow declining on bar graph, business finance chart, downward trend, recession, financial data, blue background
Free with trial The image depicts a set of turquoise bars progressively decreasing in height from left to right, accompanied by a large red downward-pointing arrow, symbolizing a downward trend or decline in data. Performance decrease illustrations Declining trend represented by a series of descending bars and a downward arrow. The image depicts a set of turquoise bars progressively decreasing in height from left to right, accompanied by a large red downward-pointing arrow, symbolizing a downward trend or decline in data
Free with trial The image shows a whiteboard with a red bar chart that initially rises and then sharply declines, accompanied by a downward-sloping red arrow. The chart is set against a white background and is placed on a wooden easel stand, indicating a visual representation of a downward trend or decline in data. Performance decrease illustrations Whiteboard displaying a declining trend with a red bar chart and downward arrow. The image shows a whiteboard with a red bar chart that initially rises and then sharply declines, accompanied by a downward-sloping red arrow. The chart is set against a white background and is placed on a wooden easel stand, indicating a visual representation of a downward trend or decline in data
Free with trial This is an detailed collection of minimalist line icons representing various business graphs and data trends. Performance decrease vectors Professional business graph and data visualization line icon set for reports. This is an detailed collection of minimalist line icons representing various business graphs and data trends
Free with trial Detailed collection of linear icons representing various business trends, financial growth metrics, and candlestick market data. Performance decrease vectors Financial business graph and chart line icons for data analysis and kpi tracking. detailed collection of linear icons representing various business trends, financial growth metrics, and candlestick market data
Free with trial A 3D rendering of a vibrant red arrow pointing upwards and a bright green arrow pointing downwards, representing market fluctuations, economic changes, and data trends. Performance decrease illustrations Red up arrow and green down arrow symbolizing financial market trends growth decline. A 3D rendering of a vibrant red arrow pointing upwards and a bright green arrow pointing downwards, representing market fluctuations, economic changes, and data trends
Free with trial A black line graph with a zigzag pattern trending downwards with an arrow. Clear details and vibrant colors en. Performance decrease illustrations Black downward trending line graph with arrow on white background chart decline. A black line graph with a zigzag pattern trending downwards with an arrow. Clear details and vibrant colors en
Free with trial Financial graph depicting declining trends with stock market data in blue and black lines, on a white background. Concept of financial downturn. 3D Rendering. Performance decrease illustrations Financial graph with declining trends and stock market data on white background. 3D Rendering. Financial graph depicting declining trends with stock market data in blue and black lines, on a white background. Concept of financial downturn. 3D Rendering
Free with trial A financial graph displays growth using stacked segments made from black tire treads. The graph is on a dark, textured surface that enhances the design. Performance decrease illustrations Financial graph made of black rubber tire treads shows growth trend on a dark surface. A financial graph displays growth using stacked segments made from black tire treads. The graph is on a dark, textured surface that enhances the design
Free with trial This colorful bar graph is representing market trends and data analysis. Performance decrease vectors Colorful bar graph showing market trends and data analysis. This colorful bar graph is representing market trends and data analysis
Free with trial Polished silver curved downward directional arrow, rendered as a sleek isolated metallic design. Perfect for illustrating financial decline, business downturns, directional navigation, or as a UI graphic for presentations and marketing assets , minimalist background. Performance decrease vectors Silver Arrow Points Downward, Representing Decline or Direction, Simple Design. Polished silver curved downward directional arrow, rendered as a sleek isolated metallic design. Perfect for illustrating financial decline, business downturns, directional navigation, or as a UI graphic for presentations and marketing assets , minimalist background
Free with trial A simple line graph two colored lines, blue and green, with circular data points indicating trends against a white background. Performance decrease illustrations Two distinct colored lines with circular markers charting upward and downward trends on a white background. A simple line graph two colored lines, blue and green, with circular data points indicating trends against a white background
Free with trial A black bar graph showing a downward trend with an arrow pointing down. Clear details and vibrant colors enhan. Performance decrease illustrations Black bar graph with a downward trending arrow on white background chart decline. A black bar graph showing a downward trend with an arrow pointing down. Clear details and vibrant colors enhan
Free with trial A 3D golden financial graph depicts a downward trend, with a prominent descending line and accompanying bar chart elements. The metallic gold material and smooth, wavy lines flowing beneath create a sense of dynamic movement. The dark blue background provides contrast to the golden elements. Performance decrease illustrations Golden Downward Trend Financial Graph with Wavy Lines and Bar Chart decline loss. A 3D golden financial graph depicts a downward trend, with a prominent descending line and accompanying bar chart elements. The metallic gold material and smooth, wavy lines flowing beneath create a sense of dynamic movement. The dark blue background provides contrast to the golden elements
Free with trial The image shows a line graph with a downward slope, featuring multiple red arrows pointing downward at various points along the line. This visual typically represents a continuous decline or drop in values over time, often used in financial, economic, or statistical contexts to illustrate negative trends or losses. Performance decrease illustrations Graphical representation of a downward trend with red arrows indicating declines. The image shows a line graph with a downward slope, featuring multiple red arrows pointing downward at various points along the line. This visual typically represents a continuous decline or drop in values over time, often used in financial, economic, or statistical contexts to illustrate negative trends or losses
Free with trial This image displays a graph illustrating trends and data progression over time with bars and a line chart. Performance decrease illustrations Graph showing trends and data progression over time isolated on white background. This image displays a graph illustrating trends and data progression over time with bars and a line chart
Free with trial Dynamic graph with one decreasing line and another increasing line in shades of orange. , Generated by AI. Performance decrease illustrations Dynamic graph with one decreasing line and another increasing line in shades of orange.
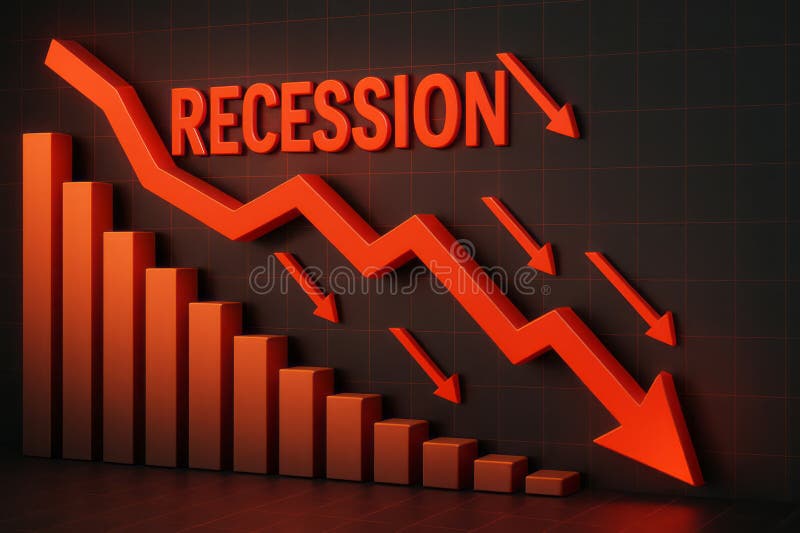
Free with trial This image visually represents an economic recession through downward trends and statistics. The vibrant red arrows emphasize the significant decline in growth, making it an impactful visual for financial analysis. Performance decrease illustrations Dramatic Decline in Economic Growth with Recession Indicator and Downward Arrows in Red. This image visually represents an economic recession through downward trends and statistics. The vibrant red arrows emphasize the significant decline in growth, making it an impactful visual for financial analysis
Free with trial The image shows two sets of bar graphs side by side. The first set, in green, illustrates a steady upward growth trend with increasing bar heights, indicating positive growth or improvement. The second set, in red, depicts a downward trend with decreasing bar heights, indicating a decline or reduction. Both sets are accentuated with upward and downward arrows, respectively, to emphasize the. Performance decrease illustrations Graphical representation of growth and decline trends in a comparative context. The image shows two sets of bar graphs side by side. The first set, in green, illustrates a steady upward growth trend with increasing bar heights, indicating positive growth or improvement. The second set, in red, depicts a downward trend with decreasing bar heights, indicating a decline or reduction. Both sets are accentuated with upward and downward arrows, respectively, to emphasize the
Free with trial Visualize cost reduction with a downward trending graph held in a hand. Illustrates finance, business strategy, and expense management. Shows efficiency and financial planning concepts. Performance decrease illustrations Cost reduction strategy business finance graph chart decreasing costs expense management efficiency concept. Visualize cost reduction with a downward trending graph held in a hand. Illustrates finance, business strategy, and expense management. Shows efficiency and financial planning concepts.