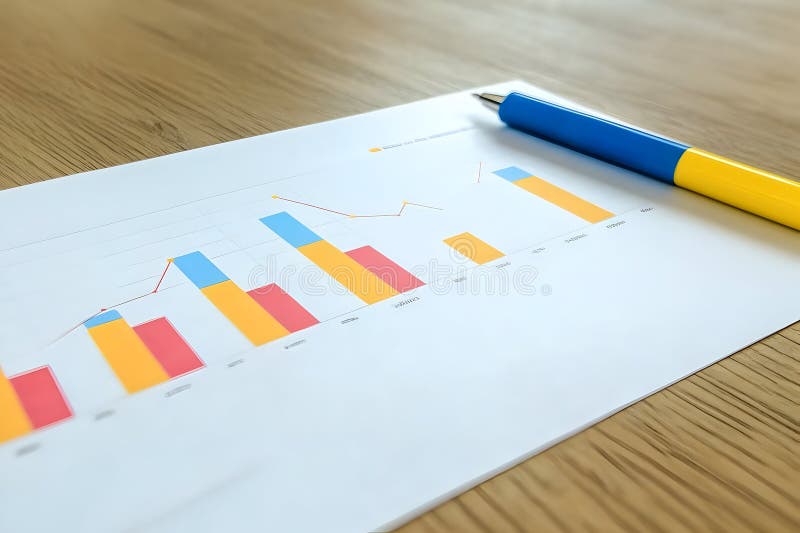
Free with trial Business graph chart report pen on wood table. Progress decrease illustrations Business graph chart report pen on wood table
Free with trial Presentation graph projection outline flat white icons on round color backgrounds. 6 bonus icons included. Progress decrease vectors Presentation graph projection outline flat round icons. Presentation graph projection outline flat white icons on round color backgrounds. 6 bonus icons included
Free with trial Fast downloading arrow icon, perfect for website or app design. Simple and modern design. Progress decrease vectors Fast Download Arrow Icon, Modern Digital Design Element. Fast downloading arrow icon, perfect for website or app design. Simple and modern design.
Free with trial A clear and prominent red arrow indicating a downward and rightward direction. Its stark contrast against a clean white backdrop makes it suitable for various data visualization and directional communication needs. Progress decrease illustrations Bold red arrow points downward and to the right with a white background. A clear and prominent red arrow indicating a downward and rightward direction. Its stark contrast against a clean white backdrop makes it suitable for various data visualization and directional communication needs
Free with trial Illustration of an ascending red arrow and a descending blue arrow. Simple curved arrow icon. Progress decrease vectors Illustration of an ascending red arrow and a descending blue arrow.
Free with trial Glowing footprints create a path against a dark background. These illuminated footprints appear evenly spaced and gradually decrease in size as they recede into the distance, providing a sense of depth and direction. The footprints are surrounded by a subtle glow, enhancing their visibility and contrast against the darkened surface. The scene evokes a mysterious or guiding atmosphere, with the footprints leading the viewer onward. Progress decrease illustrations Glowing Footprints Lead the Way A Path in the Dark. Glowing footprints create a path against a dark background. These illuminated footprints appear evenly spaced and gradually decrease in size as they recede into the distance, providing a sense of depth and direction. The footprints are surrounded by a subtle glow, enhancing their visibility and contrast against the darkened surface. The scene evokes a mysterious or guiding atmosphere, with the footprints leading the viewer onward.
Free with trial A simple graphic depicting a downward trend with four circular data points and a prominent red arrow indicating the direction. Progress decrease illustrations Red downward trend line with circles and arrow. A simple graphic depicting a downward trend with four circular data points and a prominent red arrow indicating the direction
Free with trial An illustrative image representing the concept of reducing carbon emissions and promoting environmental sustainability. The artwork depicts hands interacting with paper cutouts of factories, CO2 clouds, and green leaves, symbolizing efforts to combat pollution and promote a cleaner environment. The image suggests a transition towards a greener future, with decreasing emissions and positive environmental impact. Suitable for illustrating topics like climate change, environmental protection, and sustainable development. Progress decrease illustrations Reducing Carbon Emissions: Environmental Concept. An illustrative image representing the concept of reducing carbon emissions and promoting environmental sustainability. The artwork depicts hands interacting with paper cutouts of factories, CO2 clouds, and green leaves, symbolizing efforts to combat pollution and promote a cleaner environment. The image suggests a transition towards a greener future, with decreasing emissions and positive environmental impact. Suitable for illustrating topics like climate change, environmental protection, and sustainable development.
Free with trial Baby height chart with clouds measuring from zero to one hundred and fifty centimeters. Progress decrease vectors Cartoon height chart measuring tool for kids with a cute sky theme. Baby height chart with clouds measuring from zero to one hundred and fifty centimeters
Free with trial A vibrant and modern illustration showcasing various data visualization elements. The image features a collection of charts, graphs, and diagrams, including line graphs, bar graphs, pie charts, and circular diagrams, all rendered in a colorful and abstract style. The design incorporates gradients and geometric shapes, suggesting growth, analysis, and business concepts. Ideal for presentations, reports, websites, and marketing materials related to finance, economics, and data analysis. Progress decrease illustrations Abstract Data Visualization and Business Charts. A vibrant and modern illustration showcasing various data visualization elements. The image features a collection of charts, graphs, and diagrams, including line graphs, bar graphs, pie charts, and circular diagrams, all rendered in a colorful and abstract style. The design incorporates gradients and geometric shapes, suggesting growth, analysis, and business concepts. Ideal for presentations, reports, websites, and marketing materials related to finance, economics, and data analysis.
Free with trial A stack of coins with a green arrow pointing down. The coins are stacked on top of each other, with the bottom coin being the largest. Concept of decline or decrease, as the arrow points downward. Progress decrease illustrations A stack of coins with a green arrow pointing down
Free with trial Dynamic visual of a city skyline partially submerged in vibrant red liquid, measured by a prominent ruler. Evokes themes of urban growth, economic measurement, or potential crisis. Progress decrease vectors City skyline submerged in red liquid measured by ruler, symbolizing growth. Dynamic visual of a city skyline partially submerged in vibrant red liquid, measured by a prominent ruler. Evokes themes of urban growth, economic measurement, or potential crisis
Free with trial A vibrant collection of hand-drawn business charts and graphs, rendered in shades of blue with a sketch-like aesthetic. The set includes various types of visualizations like bar charts, line graphs, pie charts, and donut charts, representing data, growth, and analysis. This versatile illustration is perfect for presentations, reports, infographics, and any project requiring a visual representation of financial or statistical information with a creative, hand-crafted feel. Progress decrease illustrations Hand-Drawn Business Charts and Graphs Collection. A vibrant collection of hand-drawn business charts and graphs, rendered in shades of blue with a sketch-like aesthetic. The set includes various types of visualizations like bar charts, line graphs, pie charts, and donut charts, representing data, growth, and analysis. This versatile illustration is perfect for presentations, reports, infographics, and any project requiring a visual representation of financial or statistical information with a creative, hand-crafted feel.
Free with trial Hand holding coin with arrows symbolizing increasing and decreasing value. Suitable for financial growth concepts in presentations, articles, and ads. Progress decrease vectors Hand holding coin with arrows symbolizing increasing and decreasing value
Free with trial Round pocket watch with co2 formula inside representing carbon dioxide reducing with time passing. Progress decrease vectors Pocket watch showing co2 emission reducing with time passing. Round pocket watch with co2 formula inside representing carbon dioxide reducing with time passing
Free with trial Set of red arrow going down stock icon. Symbol of downward arrow graph. Symbol of down arrow market graph. Progress decrease vectors Set of red arrow going down stock icon. Symbol of downward arrow graph. Symbol of down arrow market graph
Free with trial Reduce inflation concept by increase interest rate. Man Hand using needle to burst inflation balloon with price tag. Progress decrease vectors Reduce inflation concept by increase interest rate
Free with trial Diagram icons set in outline stroke design for web. Pack line pictograms with growth bar chart, pie data, datum, marketing, analyzing finance, flow, infographic, statistic, other. Vector illustration. Progress decrease vectors Diagram icons set in outline stroke design for web. Pack line pictograms with growth bar chart, pie data, datum
Free with trial Businessman analyzing data on large display screen,This image was created using AI. Progress decrease illustrations Businessman analyzing data on large display screen
Free with trial Futuristic 3D Data Visualization on Glass Screen. Progress decrease illustrations Futuristic 3D Data Visualization on Glass Screen
Free with trial A collection of financial chart icons, showcasing data analysis and business growth concepts. The image features multiple variations of a line graph and bar chart combination, presented in both grayscale and beige color schemes. These icons are ideal for illustrating financial reports, business presentations, market trends, and data visualization projects. The clean, modern design makes them suitable for a wide range of applications. Progress decrease vectors Financial Chart Icons: Business and Data Analysis. A collection of financial chart icons, showcasing data analysis and business growth concepts. The image features multiple variations of a line graph and bar chart combination, presented in both grayscale and beige color schemes. These icons are ideal for illustrating financial reports, business presentations, market trends, and data visualization projects. The clean, modern design makes them suitable for a wide range of applications.
Free with trial A 3D rendered image of a bar graph disintegrating into dust, symbolizing economic decline or market crash. This powerful visual metaphor, generated by AI, highlights the fragility of growth and the potential for sudden collapse. Progress decrease illustrations Collapsing Growth Chart. A 3D rendered image of a bar graph disintegrating into dust, symbolizing economic decline or market crash. This powerful visual metaphor, generated by AI, highlights the fragility of growth and the potential for sudden collapse.
Free with trial Colorful graph chart is showing and comparing different data results with lines and dots. Progress decrease vectors Colorful graph chart showing different data comparing results. Colorful graph chart is showing and comparing different data results with lines and dots
Free with trial Red bar graph with decreasing values. Generative AI. Progress decrease illustrations Red bar graph with decreasing values
Free with trial Strategic Decisions: Integrating Business Analytics with Strategic Thinking. This visual portrays the dynamic interaction between business analytics and strategic thinking, showcasing how analytical insights drive strategic planning and decision-making. It emphasizes the synergy between data analysis and strategic foresight in achieving business goals. --chaos 10 --ar 16:9 --style raw --stylize, aesthetic wallpaper background. Progress decrease illustrations Colorful Pie Charts and Bar Graphs on a White Paper. Strategic Decisions: Integrating Business Analytics with Strategic Thinking. This visual portrays the dynamic interaction between business analytics and strategic thinking, showcasing how analytical insights drive strategic planning and decision-making. It emphasizes the synergy between data analysis and strategic foresight in achieving business goals. --chaos 10 --ar 16:9 --style raw --stylize, aesthetic wallpaper background
Free with trial A clean, flat design illustration featuring a collection of icons related to social media engagement and data analysis. The set includes a pie chart, bar graphs showing upward trends, a line graph with a heart icon and an upward arrow, another line graph with data points, a speech bubble with the word 'LIKE' and abstract shapes, and a thumbs-up icon with a notification count. These graphics are ideal for representing concepts like growth, popularity, analytics, and user feedback in digital marketing, business reports, and web design. Progress decrease illustrations Social Media Metrics and Data Visualization Icons. A clean, flat design illustration featuring a collection of icons related to social media engagement and data analysis. The set includes a pie chart, bar graphs showing upward trends, a line graph with a heart icon and an upward arrow, another line graph with data points, a speech bubble with the word 'LIKE' and abstract shapes, and a thumbs-up icon with a notification count. These graphics are ideal for representing concepts like growth, popularity, analytics, and user feedback in digital marketing, business reports, and web design.
Free with trial A stylized 3D representation of two curved arrows, one pointing upwards in yellow and the other downwards in pink, suggesting a cycle of exchange or dynamic change. Progress decrease illustrations Up and down arrows symbolizing exchange or change. A stylized 3D representation of two curved arrows, one pointing upwards in yellow and the other downwards in pink, suggesting a cycle of exchange or dynamic change
Free with trial Abstract 3D rendering of a golden bar graph, depicting data fluctuations Represents growth and market trends. Progress decrease illustrations Golden Data Visualization. AI Generated. Abstract 3D rendering of a golden bar graph, depicting data fluctuations Represents growth and market trends
Free with trial Three line graphs, data visualization, chart comparison. Progress decrease vectors Three line graphs, data visualization, chart comparison
Free with trial Businessman stick figure character in suit standing front of downward trend graph chart. concerned situation. Business failure, crisis, bankruptcy, down negative arrow. hand drawn doodle illustration. Progress decrease vectors Businessman stick figure character in suit standing front of downward trend graph chart. concerned situation. Business failure
Free with trial Ascending and descending graph set. Vector illustration. Progress decrease vectors Ascending and descending graph set.
Free with trial A minimalist 3D render featuring two soft, pastel-colored arrows, one light blue and one pink, intersecting over a pale purple bar. The arrangement visually suggests a percentage symbol. The objects are rendered with smooth, rounded edges and a subtle sheen, set against a clean white background. This graphic is ideal for representing concepts like discounts, sales, growth, decline, comparison, or financial metrics in a modern and appealing way. Progress decrease vectors 3D Arrows Intersecting with Percentage Symbol Shape. A minimalist 3D render featuring two soft, pastel-colored arrows, one light blue and one pink, intersecting over a pale purple bar. The arrangement visually suggests a percentage symbol. The objects are rendered with smooth, rounded edges and a subtle sheen, set against a clean white background. This graphic is ideal for representing concepts like discounts, sales, growth, decline, comparison, or financial metrics in a modern and appealing way.
Free with trial A girl stands confidently, pointing at a finance chart displayed on a large screen. Her expression is focused and determined, highlighting key trends and data that drive her presentation. Progress decrease illustrations The girl is pointing at the finance chart. A girl stands confidently, pointing at a finance chart displayed on a large screen. Her expression is focused and determined, highlighting key trends and data that drive her presentation.
Free with trial A row of wooden figures, each with a spherical top and a rectangular or cylindrical base, are arranged in descending order of height from left to right. The figures vary in color, starting with a deep red, followed by orange, yellow, green, and then several shades of brown and natural wood. The background is a muted, textured beige. Progress decrease illustrations Wooden figures arranged in descending height order. A row of wooden figures, each with a spherical top and a rectangular or cylindrical base, are arranged in descending order of height from left to right. The figures vary in color, starting with a deep red, followed by orange, yellow, green, and then several shades of brown and natural wood. The background is a muted, textured beige
Free with trial A glossy, transparent blue arrow curves downwards, pointing towards the bottom right of the frame. The arrow is rendered in 3D and casts a subtle shadow on the white surface it rests upon. Clear details and vibrant colors enhance visual appeal. Progress decrease illustrations Glossy Blue Arrow Pointing Downwards on a White Background direction decline. A glossy, transparent blue arrow curves downwards, pointing towards the bottom. A glossy, transparent blue arrow curves downwards, pointing towards the bottom right of the frame. The arrow is rendered in 3D and casts a subtle shadow on the white surface it rests upon. Clear details and vibrant colors enhance visual appeal
Free with trial An abstract, three-dimensional white graph line is depicted against a stark white background. The line features sharp, jagged peaks and valleys, clearly illustrating a significant downward trend or decline. The geometric form casts a subtle shadow, adding depth to the minimalist composition. This visual represents concepts of loss, negative performance, or economic downturn. Progress decrease illustrations Abstract 3D White Graph Line Showing Downward Trend on White Background chart data. An abstract, three-dimensional white graph line is depicted against a stark white background. The line features sharp, jagged peaks and valleys, clearly illustrating a significant downward trend or decline. The geometric form casts a subtle shadow, adding depth to the minimalist composition. This visual represents concepts of loss, negative performance, or economic downturn
Free with trial Nine colorful arrows, pointing up, down, left, and right, are displayed against a white background, each casting a subtle drop shadow, creating a vibrant and directional visual element. Progress decrease illustrations Colorful arrows pointing in different directions with drop shadow. Nine colorful arrows, pointing up, down, left, and right, are displayed against a white background, each casting a subtle drop shadow, creating a vibrant and directional visual element
Free with trial An isometric illustration shows a computer screen displaying colorful data charts and graphs alongside related financial icons. Progress decrease illustrations Colorful Data Analytics Displayed on Computer Screen. An isometric illustration shows a computer screen displaying colorful data charts and graphs alongside related financial icons
Free with trial Cheerful cartoon businessman reviewing positive financial data upward trending graph. Progress decrease illustrations Happy Businessman Analyzing Financial Growth Charts. Cheerful cartoon businessman reviewing positive financial data upward trending graph.
Free with trial Blue footprint with CO2, black dollar coin, and downward arrow demonstrate eco-friendly cost savings. Ideal for sustainability, efficiency, climate change, low-carbon economy, eco-conscious business. Progress decrease illustrations Reducing Carbon Footprint and Financial Costs for Sustainable Impact. Blue footprint with CO2, black dollar coin, and downward arrow demonstrate eco-friendly cost savings. Ideal for sustainability, efficiency, climate change, low-carbon economy, eco-conscious business
Free with trial This vector icon set features graph diagrams with arrows indicating growth and decline. The icons represent business metrics and financial performance, with arrows pointing upward for growth and downward for decline. These symbols are ideal for visualizing trends, success, and changes in finance reports or business charts. The clean, simple design ensures clarity, making these icons suitable for use in presentations, reports, or dashboards to effectively communicate financial or business performance. Progress decrease vectors Growing up and down vector icon set. Graph diagram with arrow. Business growth success chart. Finance report symbol. This vector icon set features graph diagrams with arrows indicating growth and decline. The icons represent business metrics and financial performance, with arrows pointing upward for growth and downward for decline. These symbols are ideal for visualizing trends, success, and changes in finance reports or business charts. The clean, simple design ensures clarity, making these icons suitable for use in presentations, reports, or dashboards to effectively communicate financial or business performance.
Free with trial Up and down curved arrow chart icon. Business trend bar symbol illustration. Progress decrease vectors Up and down curved arrow chart icon. Business trend bar symbol
Free with trial This image showcases a striking 3D rendering featuring two sets of colorful bar graphs, one in shades of pink and the other in orange. These graphs are artfully embedded within wave-like, layered forms, creating a visually interesting contrast between the rigid geometry of the bars and the fluidity of the surrounding shapes. The graphs are positioned on separate, circular platforms, and a small, idyllic island with several evergreen trees sits between them, adding a touch of nature to the otherwise abstract composition. The overall aesthetic is minimalist and modern, suggesting a conceptual representation of financial growth within a natural context. Progress decrease illustrations Abstract 3D Render of Financial Growth Represented by Colorful Bar Graphs Nestled in Stylized Landscapes. This image showcases a striking 3D rendering featuring two sets of colorful bar graphs, one in shades of pink and the other in orange. These graphs are artfully embedded within wave-like, layered forms, creating a visually interesting contrast between the rigid geometry of the bars and the fluidity of the surrounding shapes. The graphs are positioned on separate, circular platforms, and a small, idyllic island with several evergreen trees sits between them, adding a touch of nature to the otherwise abstract composition. The overall aesthetic is minimalist and modern, suggesting a conceptual representation of financial growth within a natural context.
Free with trial Global finance data analysis on keyboard with charts, stunning background Generative AI. Progress decrease illustrations Global finance data analysis on keyboard with charts
Free with trial A vector illustration showing a magnifying glass focused on a bar graph and line chart indicating growth. The magnifying glass has a blue frame and red handle. The chart depicts an upward trend, suggesting positive business performance. This image is suitable for illustrating data analysis, business strategy, market research, and financial growth concepts. Progress decrease vectors Analyzing Growth: Magnifying Glass on Business Chart. A vector illustration showing a magnifying glass focused on a bar graph and line chart indicating growth. The magnifying glass has a blue frame and red handle. The chart depicts an upward trend, suggesting positive business performance. This image is suitable for illustrating data analysis, business strategy, market research, and financial growth concepts.
Free with trial Blue Stacked Arrow Up Down on White, Direction ,Growth , This photo was created using generative AI. Progress decrease illustrations Blue Stacked Arrow Up Down on White, Direction ,Growth
Free with trial The image showcases a collection of vibrant charts and graphs presenting data visualizations on a dark background. Progress decrease illustrations Colorful Data Visualization Charts And Graphs Display. The image showcases a collection of vibrant charts and graphs presenting data visualizations on a dark background
Free with trial Decreasing bar chart icon on black circle. Market crash illustration concept. Progress decrease vectors Decreasing bar chart icon on black circle. Market crash concept. Decreasing bar chart icon on black circle. Market crash illustration concept
Free with trial Directional Arrows Up and Down Showing Contrast and Balance. Progress decrease vectors Directional Arrows Up and Down Showing Contrast and Balance
Free with trial Light blue up arrow and dark blue down arrow represent change, contrast, or comparison on a light blue background Great for finance and marketing related graphics. Progress decrease illustrations Up and Down Arrows Illustrating Change or Comparison. Light blue up arrow and dark blue down arrow represent change, contrast, or comparison on a light blue background Great for finance and marketing related graphics
Free with trial A single, glossy, bright yellow arrow is depicted pointing directly downwards. The arrow has a smooth, rounded appearance and a shiny surface, casting a subtle shadow on the clean white background. This 3D rendered graphic is a simple and clear visual representation of a downward direction or action. Progress decrease illustrations Glossy Yellow Downward Arrow on White Background direction symbol. A single, glossy, bright yellow arrow is depicted pointing directly downwards. The arrow has a smooth, rounded appearance and a shiny surface, casting a subtle shadow on the clean white background. This 3D rendered graphic is a simple and clear visual representation of a downward direction or action
Free with trial A cheerful cartoon businessman in a suit stands proudly beside a rising bar graph, illustrating positive financial growth and business success. Progress decrease illustrations Smiling Businessman Presenting Financial Growth Chart. A cheerful cartoon businessman in a suit stands proudly beside a rising bar graph, illustrating positive financial growth and business success.
Free with trial This simple bar graph is depicting market analysis with colorful bars. Progress decrease vectors Colorful bar graph showing market growth and success. This simple bar graph is depicting market analysis with colorful bars
Free with trial A white line graph with black circular points ascends diagonally across a solid orange background. The line is illuminated, casting a subtle shadow. Progress decrease illustrations White line graph with black dots on orange background. A white line graph with black circular points ascends diagonally across a solid orange background. The line is illuminated, casting a subtle shadow
Free with trial A metallic gold button featuring a downward-pointing arrow, symbolizing a download or decrease action. Isolated on a clean white background for versatile use. Progress decrease illustrations Golden down arrow button isolated on white background. A metallic gold button featuring a downward-pointing arrow, symbolizing a download or decrease action. Isolated on a clean white background for versatile use
Free with trial A vibrant 3D representation of a business graph and chart, showcasing data analysis and financial trends with colorful bars and a dynamic line, isolated on a clean white background. Progress decrease illustrations 3d graph and chart icons isolated on white background. A vibrant 3D representation of a business graph and chart, showcasing data analysis and financial trends with colorful bars and a dynamic line, isolated on a clean white background
Free with trial A bold, glossy red arrow curves downwards, pointing sharply to the left. It signifies a downward trend or direction. Progress decrease illustrations Vibrant red downward curved arrow symbol. A bold, glossy red arrow curves downwards, pointing sharply to the left. It signifies a downward trend or direction
Free with trial Laptop displaying a graph, visualizing data analysis and market trends for business decisions ,Generative ai. Progress decrease illustrations Laptop with graph, data analysis for market trends and business decisions. Laptop displaying a graph, visualizing data analysis and market trends for business decisions ,Generative ai
Free with trial A vibrant, modern icon depicting a financial growth chart, representing investment and market analysis. The design features ascending lines and bars, suggesting positive trends. This graphic was generated by AI for illustrative purposes. A representation of financial success. Progress decrease illustrations Financial Growth Chart Icon - Business Investment Concept. A vibrant, modern icon depicting a financial growth chart, representing investment and market analysis. The design features ascending lines and bars, suggesting positive trends. This graphic was generated by AI for illustrative purposes. A representation of financial success.
Free with trial Bold Yellow Downward Arrow Graphic with Rounded Corners. Progress decrease vectors Bold Yellow Downward Arrow Graphic with Rounded Corners
Free with trial This image showcases a vibrant 3D rendering of various financial charts, including bar graphs, pie charts, and a rising arrow, symbolizing growth and profitability. Ideal for presentations, reports, and financial articles. Progress decrease illustrations Colorful 3D Financial Charts Showing Growth and Profit. This image showcases a vibrant 3D rendering of various financial charts, including bar graphs, pie charts, and a rising arrow, symbolizing growth and profitability. Ideal for presentations, reports, and financial articles.
Free with trial A stylized digital graph depicts fluctuating market trends using bar columns and a connected line with bright orange data points. Progress decrease illustrations Abstract digital graph showing financial market trends. A stylized digital graph depicts fluctuating market trends using bar columns and a connected line with bright orange data points
Free with trial Line chart is representing a decreasing trend in statistical data analysis. Progress decrease vectors Statistical data analysis with line chart showing decreasing trend. Line chart is representing a decreasing trend in statistical data analysis
Free with trial Concept Abstract Art, Blue Watercolor, Financial Growth, Chart, Abstract Design Abstract Blue Watercolor Financial Growth Chart. Progress decrease illustrations Abstract Blue Watercolor Financial Growth Chart. Concept Abstract Art, Blue Watercolor, Financial. Concept Abstract Art, Blue Watercolor, Financial Growth, Chart, Abstract Design Abstract Blue Watercolor Financial Growth Chart
Free with trial A 3D rendered blue arrow curves downwards, featuring alternating white and blue checkered segments along its shaft. Progress decrease illustrations Curved blue arrow pointing downward with white stripes. A 3D rendered blue arrow curves downwards, featuring alternating white and blue checkered segments along its shaft
Free with trial Cartoon robot analyzing financial data with a pencil, displayed on a chart and a clipboard, suggesting automation in data analysis and reporting Use for illustrative purposes. Progress decrease illustrations Robot Analyzing Business Graph with Pencil on Clipboard. Cartoon robot analyzing financial data with a pencil, displayed on a chart and a clipboard, suggesting automation in data analysis and reporting Use for illustrative purposes
Free with trial A 3D rendered bar chart composed of four colored blocks of varying heights. The blocks are blue, yellow, red, and white, arranged from shortest to tallest from left to right. The chart is presented on a clean white background, with subtle shadows beneath the blocks. Progress decrease illustrations Colorful 3D Bar Chart with Varying Heights on a White Background graph statistics. A 3D rendered bar chart composed of four colored blocks of varying heights. The blocks are blue, yellow, red, and white, arranged from shortest to tallest from left to right. The chart is presented on a clean white background, with subtle shadows beneath the blocks
Free with trial A collection of eight black and white, hand-drawn or doodle style icons. Each square icon features a different line graph, representing data, analytics, statistics, or financial trends. Progress decrease illustrations Set of hand drawn financial chart line graph icons isolated on white. A collection of eight black and white, hand-drawn or doodle style icons. Each square icon features a different line graph, representing data, analytics, statistics, or financial trends
Free with trial A collection of eight black and white, hand-drawn or doodle style icons. Each square icon features a different line graph, representing data, analytics, statistics, or financial trends. Progress decrease illustrations Set of hand drawn financial chart line graph icons isolated on white. A collection of eight black and white, hand-drawn or doodle style icons. Each square icon features a different line graph, representing data, analytics, statistics, or financial trends
Free with trial Collection of thirty charts and graphs icons in line style. Progress decrease vectors Collection of thirty charts and graphs icons in line style
Free with trial Online sales analysis laptop, charts, shopping cart, office, detailed background Generative AI. Progress decrease illustrations Online sales analysis laptop, charts, shopping cart, office
Free with trial Arrow trend-down icon. Progress decrease vectors Arrow trend-down vector icon set in black and white outlines. Arrow trend-down icon
Free with trial 3d curved arrow changing color from blue to red pointing down and right, representing concepts like temperature change, heat transfer, or a transition from cold to hot. Progress decrease illustrations 3d curved arrow changing from blue to red pointing down right. 3d curved arrow changing color from blue to red pointing down and right, representing concepts like temperature change, heat transfer, or a transition from cold to hot
Free with trial Male avatar in a circle next to a declining bar chart. Ideal for progress, profile data, analytics, user stats, report analysis, business performance, visualization. Simple flat metaphor. Progress decrease illustrations Profile Avatar with Bar Chart Representing Performance and Analytics Data. Male avatar in a circle next to a declining bar chart. Ideal for progress, profile data, analytics, user stats, report analysis, business performance, visualization. Simple flat metaphor
Free with trial A bright, bold red arrow prominently displays a downward and rightward direction. This clear directional symbol is isolated, making it a versatile graphic element for various applications. Progress decrease illustrations Bold red arrow pointing down and to the right isolated on a clean background white background. A bright, bold red arrow prominently displays a downward and rightward direction. This clear directional symbol is isolated, making it a versatile graphic element for various applications
Free with trial A vibrant graphic illustrating alphabetical order from Z to A, featuring the letters 'Z' and 'A' in blue with a dashed line connecting them, alongside a long green arrow pointing downwards, transitioning from light to dark green rectangles. This content was created using AI technology, symbolizing sorting or a reverse progression. Progress decrease vectors Alphabetical Order Z to A with Descending Green Arrow Icon. A vibrant graphic illustrating alphabetical order from Z to A, featuring the letters 'Z' and 'A' in blue with a dashed line connecting them, alongside a long green arrow pointing downwards, transitioning from light to dark green rectangles. This content was created using AI technology, symbolizing sorting or a reverse progression.
Free with trial Vector isolated image embodying artificial intelligence and robots. Progress decrease vectors Smart robot with a screen in the form of a graph. Vector isolated image embodying artificial intelligence and robots
Free with trial Stock Market icon vector image. Suitable for mobile application web application and print media. Progress decrease vectors Stock Market icon vector image.
Free with trial Stock Market icon vector image. Suitable for mobile application web application and print media. Progress decrease vectors Stock Market icon vector image.
Free with trial Stock Market icon vector image. Suitable for mobile application web application and print media. Progress decrease vectors Stock Market icon vector image.