Free with trial Abstract green dotted financial graph chart sparkling background. Vector minimal tech design. Progress decrease vectors Abstract green dotted financial graph chart sparkling background
Free with trial A close-up of a magnifying glass revealing intricate lines of code, generated by AI. The image evokes a sense of mystery and technological advancement, hinting at the power and potential of artificial intelligence in data analysis and cybersecurity. Progress decrease illustrations AI Magnifies Code. A close-up of a magnifying glass revealing intricate lines of code, generated by AI. The image evokes a sense of mystery and technological advancement, hinting at the power and potential of artificial intelligence in data analysis and cybersecurity.
Free with trial Analyzing the business failure and decline. White magnifying glass analyzing a growth chart on a blue background, representing market analysis and business growth. 3D render. Progress decrease illustrations Magnifying glass analyzing growth chart on blue background. Analyzing the business failure and decline. White magnifying glass analyzing a growth chart on a blue background, representing market analysis and business growth. 3D render
Free with trial Business refers to the organized efforts and activities of individuals or groups to produce, buy, sell, and exchange goods or services for profit. Progress decrease illustrations The Arrow down and coins for Business concept 3d rendering. Business refers to the organized efforts and activities of individuals or groups to produce, buy, sell, and exchange goods or services for profit
Free with trial Business refers to the organized efforts and activities of individuals or groups to produce, buy, sell, and exchange goods or services for profit. Progress decrease illustrations The Arrow down and coins for Business concept 3d rendering. Business refers to the organized efforts and activities of individuals or groups to produce, buy, sell, and exchange goods or services for profit
Free with trial Business refers to the organized efforts and activities of individuals or groups to produce, buy, sell, and exchange goods or services for profit. Progress decrease illustrations The Arrow down and coins for Business concept 3d rendering. Business refers to the organized efforts and activities of individuals or groups to produce, buy, sell, and exchange goods or services for profit
Free with trial Business refers to the organized efforts and activities of individuals or groups to produce, buy, sell, and exchange goods or services for profit. Progress decrease illustrations The piggy bank and coins for Business concept 3d rendering. Business refers to the organized efforts and activities of individuals or groups to produce, buy, sell, and exchange goods or services for profit
Free with trial Business refers to the organized efforts and activities of individuals or groups to produce, buy, sell, and exchange goods or services for profit. Progress decrease illustrations The piggy bank and coins for Business concept 3d rendering. Business refers to the organized efforts and activities of individuals or groups to produce, buy, sell, and exchange goods or services for profit
Free with trial Business refers to the organized efforts and activities of individuals or groups to produce, buy, sell, and exchange goods or services for profit. Progress decrease illustrations The Arrow down and coins for Business concept 3d rendering. Business refers to the organized efforts and activities of individuals or groups to produce, buy, sell, and exchange goods or services for profit
Free with trial Business refers to the organized efforts and activities of individuals or groups to produce, buy, sell, and exchange goods or services for profit. Progress decrease illustrations The piggy bank and coins for Business concept 3d rendering. Business refers to the organized efforts and activities of individuals or groups to produce, buy, sell, and exchange goods or services for profit
Free with trial Business refers to the organized efforts and activities of individuals or groups to produce, buy, sell, and exchange goods or services for profit. Progress decrease illustrations The Arrow down and coins for Business concept 3d rendering. Business refers to the organized efforts and activities of individuals or groups to produce, buy, sell, and exchange goods or services for profit
Free with trial Business refers to the organized efforts and activities of individuals or groups to produce, buy, sell, and exchange goods or services for profit. Progress decrease illustrations The Arrow down and coins for Business concept 3d rendering. Business refers to the organized efforts and activities of individuals or groups to produce, buy, sell, and exchange goods or services for profit
Free with trial Business refers to the organized efforts and activities of individuals or groups to produce, buy, sell, and exchange goods or services for profit. Progress decrease illustrations The Arrow down and coins for Business concept 3d rendering. Business refers to the organized efforts and activities of individuals or groups to produce, buy, sell, and exchange goods or services for profit
Free with trial Teamwork concept showing people reducing stress level on a colorful gauge meter, symbolizing mental health improvement, relaxation, and positive mood isolated on white background vector illustration. Progress decrease vectors People Lowering Stress Level Gauge Meter. Teamwork concept showing people reducing stress level on a colorful gauge meter, symbolizing mental health improvement, relaxation, and positive mood isolated on white background vector illustration
Free with trial An illustration of businessman leader watering seedling plant on bar graph with pollution smoke rising up. Climate crisis and environment policy, ESG or ecology problem concept. Progress decrease illustrations Businessman leader watering seedling plant on bar graph with pollution smoke rising up
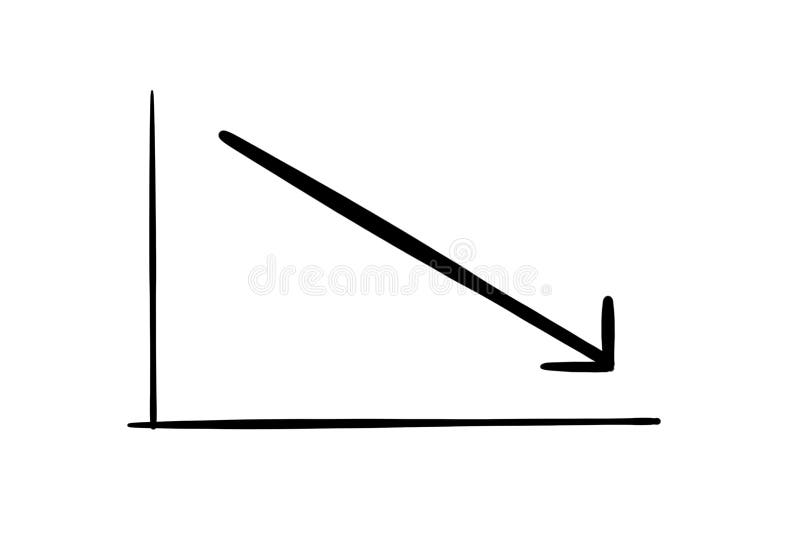
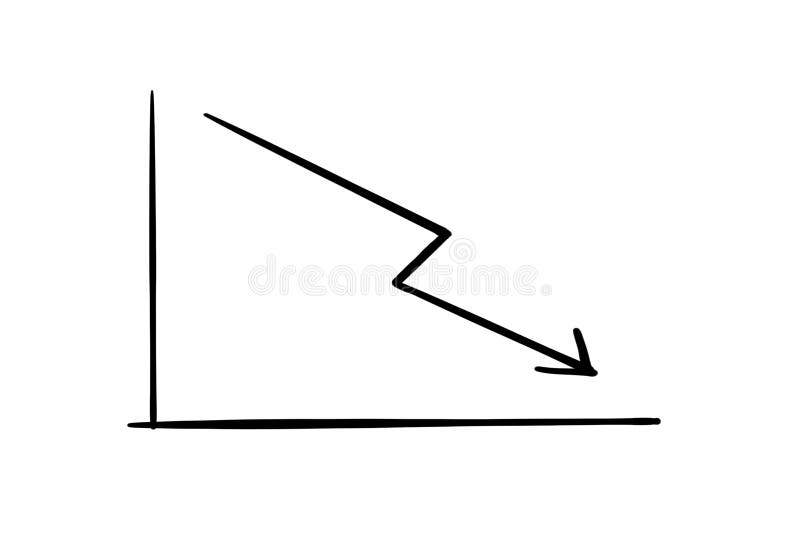
Free with trial Doodle Graph going down illustration. Progress decrease illustrations Doodle Graph going down
Free with trial Doodle Graph going down illustration. Progress decrease illustrations Doodle Graph going down
Free with trial A wooden block tower with a red arrow pointing upwards. The blocks are stacked in a pyramid shape generated by AI. Progress decrease vectors A wooden block tower with a red arrow pointing upwards generated by AI. A wooden block tower with a red arrow pointing upwards. The blocks are stacked in a pyramid shape generated by AI
Free with trial Illustration symbol design template for web mobile UI element. Perfect color modern pictogram on editable stroke. Progress decrease vectors Low Simple vector icon. Illustration symbol design template for web mobile UI element. Perfect color modern pictogram on. Illustration symbol design template for web mobile UI element. Perfect color modern pictogram on editable stroke.
Free with trial Cycle infographic with slice circle create round object with arrow direction with 6 point stage with modern dark style for slide presentation vector. Progress decrease illustrations Cycle infographic with slice circle create round object with arrow direction with 6 point stage with modern dark style for slide
Free with trial Arrows pointing up and down or to sides, taking on different shapes and statistical charts. Background of straight or wavy arrows for web design, presentations and infographics. Hand drawn doodle. Progress decrease vectors Arrows pointing up and down or to sides, taking on different shapes. Hand drawn doodle. Arrows pointing up and down or to sides, taking on different shapes and statistical charts. Background of straight or wavy arrows for web design, presentations and infographics. Hand drawn doodle
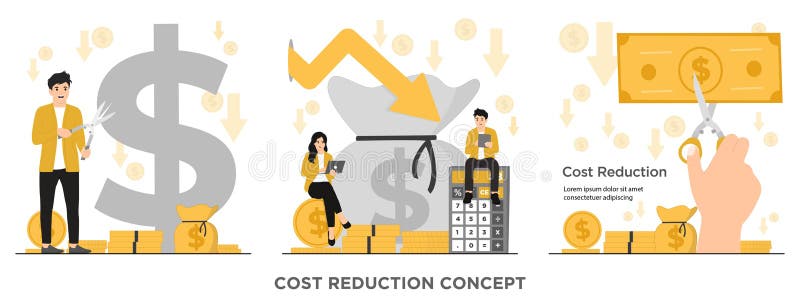
Free with trial Discover the power of cost reduction and optimization with our flat vector illustration. Cut costs and boost your business's efficiency today!. Progress decrease vectors Flat vector costs reduction costs cut costs optimization business concept illustration. Discover the power of cost reduction and optimization with our flat vector illustration. Cut costs and boost your business's efficiency today!
Free with trial 3D render icon Line graph tracking energy consumption with a playful narrative icon 3d analysis. Generative AI. Progress decrease illustrations 3D render icon Line graph tracking energy consumption with a playful narrative icon 3d analysis
Free with trial A wooden block tower with a red arrow pointing upwards and the numbers 1, 2, 3, 4, 5, 6, 7, 8, 9, 10 generated by AI. Progress decrease vectors A wooden block tower with a red arrow pointing upwards and the numbers 1, 2, 3 generated by AI. A wooden block tower with a red arrow pointing upwards and the numbers 1, 2, 3, 4, 5, 6, 7, 8, 9, 10 generated by AI
Free with trial Open laptop displaying colorful bar graphs and data analysis on screen, representing growth and business analytics ,Generative AI. Progress decrease illustrations Open laptop displaying colorful bar graphs and data analysis on screen, representing growth and business analytics
Free with trial Stock exchange market trade bull vs bear concept vector. Progress decrease vectors Stock exchange market trade bull vs bear concept
Free with trial Two solid black arrows are depicted against a plain white background. The arrow on the left points directly upwards, while the arrow on the right points directly downwards. Both arrows are simple, geometric shapes with pointed heads and rectangular shafts. The composition is clean and isolated, emphasizing the directional nature of the symbols. Progress decrease illustrations Black Up and Down Arrows on White Background up arrow. Two solid black arrows are depicted against a plain white background. The arrow on the left points directly upwards, while the arrow on the right points directly downwards. Both arrows are simple, geometric shapes with pointed heads and rectangular shafts. The composition is clean and isolated, emphasizing the directional nature of the symbols
Free with trial Abstract dotted financial graph chart sparkling background. Vector minimal tech design. Progress decrease vectors Abstract dotted financial graph chart sparkling background
Free with trial 3d bull vs bear stock market volatility background vector. Progress decrease vectors 3d bull vs bear stock market volatility background
Free with trial Ascending and descending arrow set. Dynamic movement and direction theme. Vector illustration. EPS 10. Stock image. Progress decrease vectors Ascending and descending arrow set. Dynamic movement and direction theme. Vector illustration. EPS 10. S
Free with trial A stack of wooden blocks with a wooden arrow pointing upwards. The blocks are arranged in a pyramid shape, with the top block being the smallest and the bottom block being the largest generated by AI. Progress decrease vectors A stack of wooden blocks with a wooden arrow pointing upwards generated by AI. A stack of wooden blocks with a wooden arrow pointing upwards. The blocks are arranged in a pyramid shape, with the top block being the smallest and the bottom block being the largest generated by AI
Free with trial Glowing neon bullish vs bearish stock trading background vector. Progress decrease illustrations Glowing neon bullish vs bearish stock trading background
Free with trial Hand holding graph symbolizing increasing and decreasing value. Progress decrease vectors Hand holding graph
Free with trial Bullish growth vs bearish decline money trading background vector. Progress decrease vectors Bullish growth vs bearish decline money trading background
Free with trial Bearish vs bullish money trade strategy concept background vector. Progress decrease vectors Bearish vs bullish money trade strategy concept background
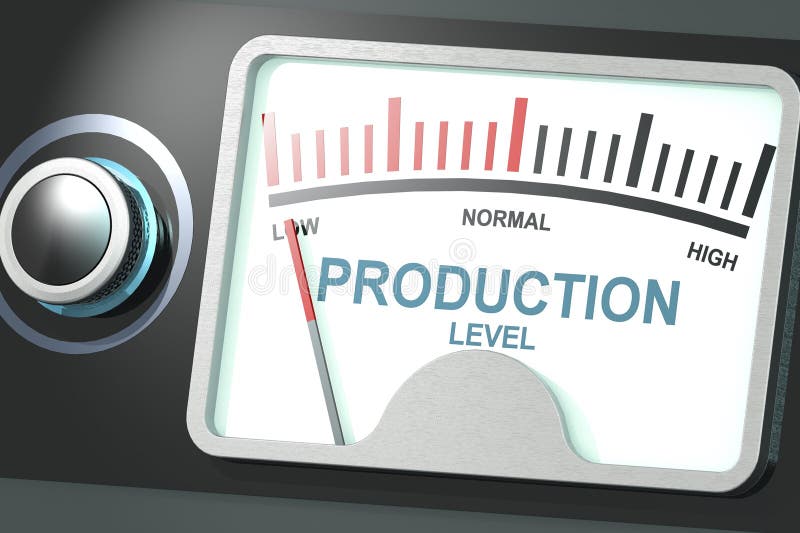
Free with trial Indicator for low production level, 3d rendering. Progress decrease illustrations Indicator for low production level
Free with trial Bull growth vs bear decline market trend concept background vector. Progress decrease vectors Bull growth vs bear decline market trend concept background
Free with trial Blue 3D Percentage Symbol With Arrow Pointing Down on Yellow Background as Blank Banner for Displaying a Marketing Ad. Vector Illustration. Progress decrease vectors Blue 3D Percentage Symbol With Arrow Pointing Down on Yellow Background as Blank Banner for Displaying a Marketing Ad.
Free with trial Business failure. Symbol of loss. Unsuccessful business investment. Businessman standing looking at a falling arrow graph. vector illustration flat. Progress decrease illustrations Business failure. Symbol of loss. Unsuccessful business investment
Free with trial Woman with economic slowdown. Young girl with falling graphs and diagrams. Recession and depression, banruptcy and crysis. Landing webpage design. Cartoon flat vector illustration. Progress decrease vectors Woman with economic slowdown vector. Woman with economic slowdown. Young girl with falling graphs and diagrams. Recession and depression, banruptcy and crysis. Landing webpage design. Cartoon flat vector illustration
Free with trial Global stock market bear vs bull volatility with dollar symbol vector. Progress decrease illustrations Global stock market bear vs bull volatility with dollar symbol
Free with trial Business Decline - Recession - Icon 10 File. Progress decrease illustrations Business Decline - Recession - Icon
Free with trial Flat bullish vs bearish upward downward market trend background vector. Progress decrease illustrations Flat bullish vs bearish upward downward market trend background
Free with trial Graph chart going up and down sign arrows flat design vector illustration on white background. Progress decrease vectors Graph chart going up and down sign arrows flat design vector illustration
Free with trial Curved white arches form a tunnel-like structure with a smooth, continuous flow. The arches decrease in size as they recede into the bright distance. The design is sleek and modern, with light filtering through a textured ceiling pattern, casting dynamic shadows on the floor. The overall ambiance is serene and futuristic, emphasizing minimalism with its monochromatic scheme and smooth surfaces. Progress decrease illustrations Curved Arches. Curved white arches form a tunnel-like structure with a smooth, continuous flow. The arches decrease in size as they recede into the bright distance. The design is sleek and modern, with light filtering through a textured ceiling pattern, casting dynamic shadows on the floor. The overall ambiance is serene and futuristic, emphasizing minimalism with its monochromatic scheme and smooth surfaces.
Free with trial Graph chart infographic report set with statistic arrow data elements for financial market analysis and planning in business performance research for your illustration. Progress decrease vectors Graph chart infographic report set
Free with trial Graph chart infographic report set with statistic arrow data elements for financial market analysis and planning in business performance research for your illustration. Progress decrease vectors Graph chart infographic report set
Free with trial Graph chart infographic report set with statistic arrow data elements for financial market analysis and planning in business performance research for your illustration. Progress decrease vectors Graph chart infographic report set
Free with trial Stock market bull vs bear volatility trade background vector. Progress decrease vectors Stock market bull vs bear volatility trade background
Free with trial Cost optimization concept. Financial and marketing strategy ideas. Expenses and cost reduction, while maximizing business value. flat vector modern illustration. Progress decrease vectors Cost optimization concept. Financial and marketing strategy ideas. Expenses and cost reduction, while maximizing business value.
Free with trial A vibrant 3D bar chart icon isolated on a clean white background. This minimalist data visualization features five colorful bars in a soft, pastel palette of yellow, pink, and purple, arranged in descending order. The clean, modern render is perfect for illustrating concepts like business statistics, financial reports, market analysis, and performance metrics. An ideal graphic element for presentations, infographics, websites, and educational materials, symbolizing data, comparison, and analytics in a visually appealing way. 3D illustration. Progress decrease illustrations 3D Colorful Bar Chart for Business and Data Analysis. A vibrant 3D bar chart icon isolated on a clean white background. This minimalist data visualization. A vibrant 3D bar chart icon isolated on a clean white background. This minimalist data visualization features five colorful bars in a soft, pastel palette of yellow, pink, and purple, arranged in descending order. The clean, modern render is perfect for illustrating concepts like business statistics, financial reports, market analysis, and performance metrics. An ideal graphic element for presentations, infographics, websites, and educational materials, symbolizing data, comparison, and analytics in a visually appealing way. 3D illustration.
Free with trial This colorful bar graph, generated by AI, depicts a downward trend using vibrant red, green, and yellow paint. The melting paint adds a dynamic, visually engaging element to the standard bar chart format, showcasing data decline creatively. Progress decrease illustrations Melting Bar Graph. This colorful bar graph, generated by AI, depicts a downward trend using vibrant red, green, and yellow paint. The melting paint adds a dynamic, visually engaging element to the standard bar chart format, showcasing data decline creatively.
Free with trial Bullish profit vs bearish loss stock market trend concept background vector. Progress decrease vectors Bullish profit vs bearish loss stock market trend concept background
Free with trial Red trend arrow dropping digital tech abstract futuristic backdrop. Generative AI. Progress decrease illustrations Red trend arrow dropping digital tech abstract futuristic backdrop
Free with trial Red trend arrow dropping digital tech abstract futuristic backdrop. Generative AI. Progress decrease illustrations Red trend arrow dropping digital tech abstract futuristic backdrop
Free with trial Businessman looking at a declining info graph. vector,illustration. Progress decrease illustrations Businessman looking at a declining info graph
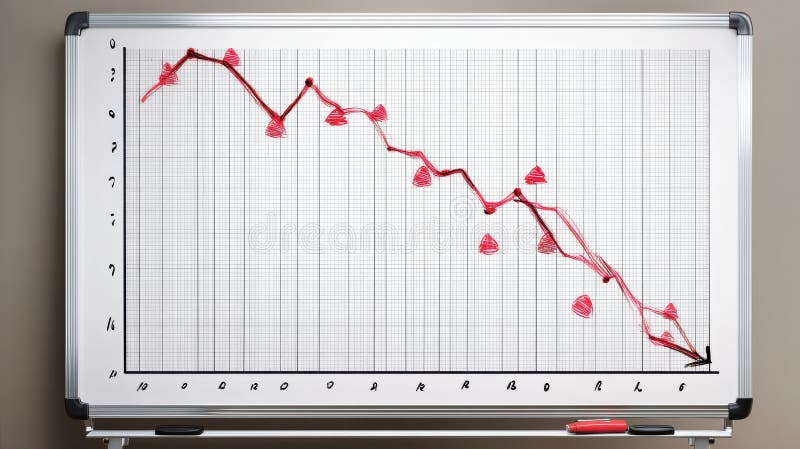
Free with trial A whiteboard displays a hand-drawn graph depicting a significant downward trend, marked by red triangles indicating decreasing values. This visual representation of a negative trend was generated by AI for illustrative purposes, possibly showcasing market decline or economic downturn. Progress decrease illustrations Downward Trend Graph. A whiteboard displays a hand-drawn graph depicting a significant downward trend, marked by red triangles indicating decreasing values. This visual representation of a negative trend was generated by AI for illustrative purposes, possibly showcasing market decline or economic downturn.
Free with trial Cost optimization concept. Idea of financial and marketing strategy. Cost and income balance. Spending and cost reduction, while maximizing business value. flat vector modern illustration. Progress decrease vectors Cost optimization concept. Idea of financial and marketing strategy. Cost and income balance.
Free with trial Uptrend and downtrend arrow vector icon. Progress decrease illustrations Uptrend and downtrend arrow vector icon
Free with trial This image shows a rolled-up graph with a red line depicting a downturn, generated by AI. It visually represents a negative trend or decline in data, potentially illustrating economic recession, market loss, or other negative statistical trends. The clean design allows for easy visualization of the. Progress decrease illustrations Declining Graph Report. This image shows a rolled-up graph with a red line depicting a downturn, generated by AI. It visually represents a negative trend or decline in data, potentially illustrating economic recession, market loss, or other negative statistical trends. The clean design allows for easy visualization of the
Free with trial Two pairs of arrows with green and red percentages, symbolizing positive and negative trends, with urban background Generative AI. Progress decrease illustrations Two pairs of arrows with green and red percentages, symbolizing positive and negative trends, with urban background
Free with trial Two pairs of arrows with green and red percentages, symbolizing positive and negative trends, with urban background Generative AI. Progress decrease illustrations Two pairs of arrows with green and red percentages, symbolizing positive and negative trends, with urban background
Free with trial A minimalist black and white icon representing a financial growth chart. It features a series of vertical bars of varying heights, symbolizing data points or periods, overlaid with a line graph connecting circular nodes. This graphic effectively conveys concepts of financial analysis, business growth, performance tracking, and data visualization. Ideal for presentations, reports, websites, and applications related to finance, economics, and business intelligence. Progress decrease vectors Growth Analysis Finance Chart Icon. A minimalist black and white icon representing a financial growth chart. It features a series of vertical bars of varying heights, symbolizing data points or periods, overlaid with a line graph connecting circular nodes. This graphic effectively conveys concepts of financial analysis, business growth, performance tracking, and data visualization. Ideal for presentations, reports, websites, and applications related to finance, economics, and business intelligence.
Free with trial High-Quality Vector Icons. Progress decrease vectors Rise icon vector, filled. High-Quality Vector Icons
Free with trial Vector illustration of a red arrow trending down. Progress decrease vectors Red arrow downward trend. vector illustration of a red arrow trending down
Free with trial A stressed businessman sits before stacks of coins, with a gold upward arrow suggesting potential growth, despite his worry. The image is generated by AI, offering a visual representation of financial stress and the hope for future prosperity. Progress decrease illustrations Financial Anxiety & Growth. A stressed businessman sits before stacks of coins, with a gold upward arrow suggesting potential growth, despite his worry. The image is generated by AI, offering a visual representation of financial stress and the hope for future prosperity.
Free with trial A business professional displays a digital graph of business growth trends. The graph showcases upward and downward fluctuations, representing the dynamic and complex nature of market analysis. The image is a visual representation of business growth and analysis using technology. The professional is likely studying data to make informed decisions for optimal performance and future growth. Progress decrease illustrations Business Growth Trend Analysis with Digital Graph. A business professional displays a digital graph of business growth trends. The graph showcases upward and downward fluctuations, representing the dynamic and complex nature of market analysis. The image is a visual representation of business growth and analysis using technology. The professional is likely studying data to make informed decisions for optimal performance and future growth
Free with trial Decreasing bar graph in ice cube. 3d illustration. Progress decrease illustrations Decreasing bar graph in ice cube
Free with trial A visual representation of data, showcasing trends and comparisons through a green bar chart. This graphic illustrates statistical information and growth patterns effectively. Progress decrease illustrations Bar chart data analysis on. A visual representation of data, showcasing trends and comparisons through a green bar chart. This graphic illustrates statistical information and growth patterns effectively
Free with trial Two 3D arrows, one red pointing down and one green pointing up, symbolizing contrasting financial trends or data analysis. Visual representation of market fluctuations. Progress decrease illustrations Arrow chart up and down on. Two 3D arrows, one red pointing down and one green pointing up, symbolizing contrasting financial trends or data analysis. Visual representation of market fluctuations
Free with trial Three orange bar graphs illustrating different data patterns increasing, decreasing, and varied. Ideal for presentations or data visualization. Simple and visually appealing design. Progress decrease illustrations Orange Bar Graph Variations. Three orange bar graphs illustrating different data patterns increasing, decreasing, and varied. Ideal for presentations or data visualization. Simple and visually appealing design.
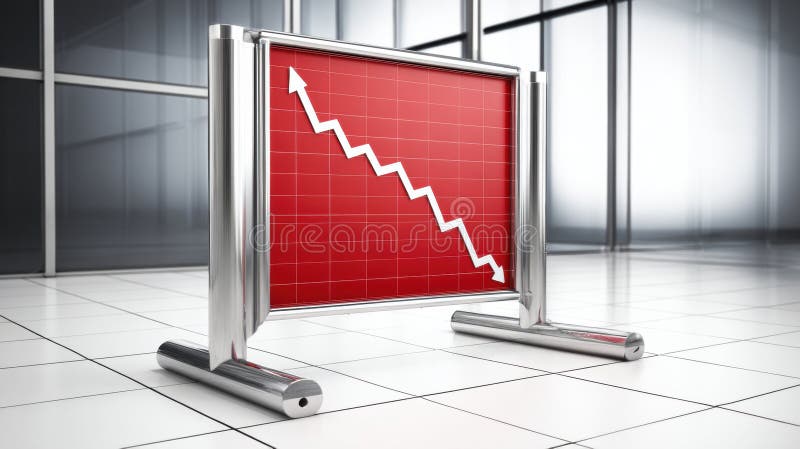
Free with trial This image shows a red graph displaying a downward trend, generated by AI. The graph is presented on a freestanding, metallic sign, suggesting a public display of economic or market data indicating a decline or downturn. The clean, modern setting adds to the professional feel, implying a serious fi. Progress decrease illustrations AI-Generated Declining Graph. This image shows a red graph displaying a downward trend, generated by AI. The graph is presented on a freestanding, metallic sign, suggesting a public display of economic or market data indicating a decline or downturn. The clean, modern setting adds to the professional feel, implying a serious fi
Free with trial A row of colorful wooden blocks, resembling a bar graph, sits on a dark wooden surface. The blocks are various heights and colors, creating a visually appealing and potentially symbolic representation of growth or data. Progress decrease illustrations Colorful Wooden Blocks Chart. A row of colorful wooden blocks, resembling a bar graph, sits on a dark wooden surface. The blocks are various heights and colors, creating a visually appealing and potentially symbolic representation of growth or data.
Free with trial Profit growth icon logo sign vector outline in black and white color. Progress decrease vectors Profit growth icon logo set vector. profit growth icon logo sign vector outline in black and white color
Free with trial Arrow up and down vector. Progress decrease vectors Arrow up and down icon vector. Arrow up and down vector
Free with trial A collection of solid icons depicting coin stacks and growth charts, presented isolated on a clean white background. Progress decrease vectors Rising coin wealth solid icons. A collection of solid icons depicting coin stacks and growth charts, presented isolated on a clean white background
Free with trial This image showcases a dynamic data visualization, generated by AI, depicting a flowing wave pattern over a gridded background. The abstract design uses cool blue tones and suggests growth, movement, or change in data trends. The wave's form is both aesthetically pleasing and symbolic of complex in. Progress decrease illustrations Abstract Data Wave. This image showcases a dynamic data visualization, generated by AI, depicting a flowing wave pattern over a gridded background. The abstract design uses cool blue tones and suggests growth, movement, or change in data trends. The wave's form is both aesthetically pleasing and symbolic of complex in
Free with trial A 3D rendering showing stacks of coins under a magnifying glass focusing on a bar graph, generated by AI. This image symbolizes financial analysis, investment, and wealth management. It's perfect for illustrating articles or presentations related to economic trends and monetary growth. Progress decrease illustrations Financial Analysis Magnifier. A 3D rendering showing stacks of coins under a magnifying glass focusing on a bar graph, generated by AI. This image symbolizes financial analysis, investment, and wealth management. It's perfect for illustrating articles or presentations related to economic trends and monetary growth.