Free with trial High and Low Percent arrow icon vector logo set collection for web app ui. Progress decrease vectors High and Low Percent arrow icon vector set collection for web. High and Low Percent arrow icon vector logo set collection for web app ui
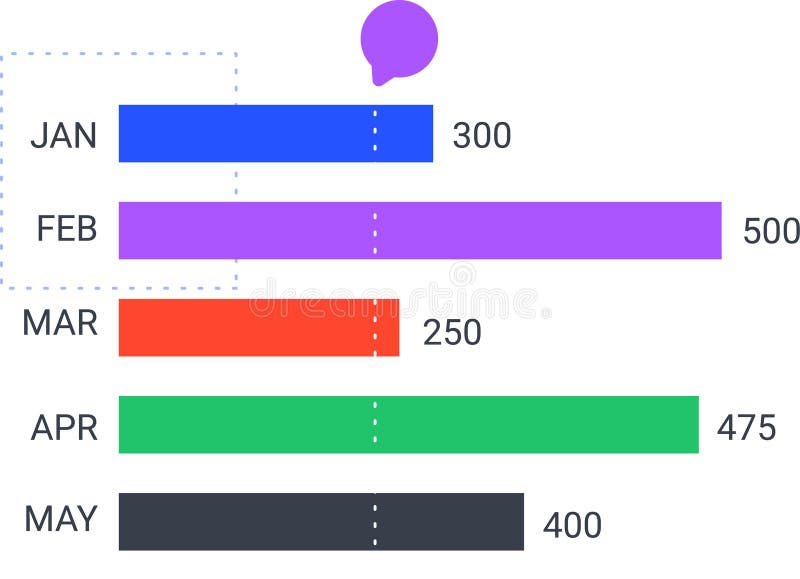
Free with trial Colorful horizontal bar chart is displaying monthly statistics from january to may, indicating trends and performance with a speech bubble above. Progress decrease vectors Colorful horizontal bar chart is displaying monthly statistics from january to may, indicating trends and performance
Free with trial Colorful horizontal bar chart is displaying monthly statistics from january to may, indicating trends and performance with a speech bubble above. Progress decrease vectors Colorful horizontal bar chart is displaying monthly statistics from january to may, indicating trends and performance
Free with trial Isometric 3D Businessman Running Up Money Stairs Against Red Falling Arrow Graph, Financial Crisis Management, Bear Market Investment Strategy, Loss Prevention and Economic Recovery. Progress decrease vectors Isometric 3D Businessman Running Up Money Stairs Against Red Falling Arrow Graph, Financial Crisis Management, Bear Market
Free with trial Colorful bar chart displayed on a polished wooden table, representing data analysis and visualization ,Generative ai. Progress decrease illustrations Colorful bar chart on wooden table, visualizing data analysis, trends, and performance metrics for business insights. Colorful bar chart displayed on a polished wooden table, representing data analysis and visualization ,Generative ai
Free with trial Line art icon of a whiteboard with graphs and charts being used for a business presentation. Progress decrease vectors Businessman analyzing statistics on whiteboard with graphs and charts. Line art icon of a whiteboard with graphs and charts being used for a business presentation
Free with trial Bar chart showing decreasing bars, with silhouetted heads and a downward arrow. Represents decline, loss, negative trend, recession, or drop in performance. Useful for financial reports, business analysis, or social trends. Progress decrease illustrations Downward trending bar chart with silhouette heads and arrow signifying decline in economy or popularity vector graphic. Bar chart showing decreasing bars, with silhouetted heads and a downward arrow. Represents decline, loss, negative trend, recession, or drop in performance. Useful for financial reports, business analysis, or social trends
Free with trial The image displays an abstract graph illustrating fluctuating growth trends with associated data points and bar charts representing additional metrics. Progress decrease illustrations Abstract Graph Showing Growth and Data Trends. The image displays an abstract graph illustrating fluctuating growth trends with associated data points and bar charts representing additional metrics
Free with trial The image showcases a collection of 3D graphical elements representing different business and market performance metrics. It includes growth percentages, market share gains, pie charts, bar graphs, and target indicators. Each element highlights positive and negative trends, market shares, and growth rates, useful for illustrating financial reports, business presentations, or performance analyses. Progress decrease illustrations Visual representation of various business performance metrics and market growth indicators isolated on white background. The image showcases a collection of 3D graphical elements representing different business and market performance metrics. It includes growth percentages, market share gains, pie charts, bar graphs, and target indicators. Each element highlights positive and negative trends, market shares, and growth rates, useful for illustrating financial reports, business presentations, or performance analyses.
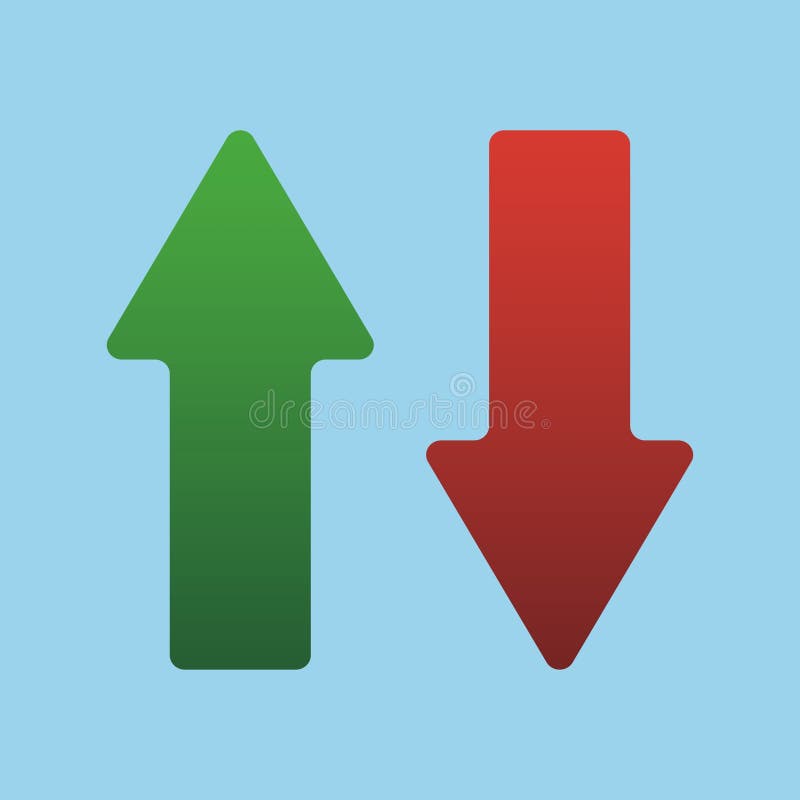
Free with trial Up and Down sign with green and red arrows isolated on a blue background vector illustration. Concept of sales bar chart symbol icon with arrow moving down and sales bar chart with arrow moving up. Progress decrease vectors Up and Down sign with green and red arrows vector illustration. Concept of sales bar chart symbol icon with arrows. Up and Down sign with green and red arrows isolated on a blue background vector illustration. Concept of sales bar chart symbol icon with arrow moving down and sales bar chart with arrow moving up.
Free with trial Up and Down sign with green and red arrows vector illustration. Concept of sales bar chart symbol icon with arrow moving down and sales bar chart with arrow moving up. Progress decrease vectors Up and Down sign with green and red arrows vector illustration. Concept of sales bar chart symbol icon with arrows. Up and Down sign with green and red arrows vector illustration. Concept of sales bar chart symbol icon with arrow moving down and sales bar chart with arrow moving up.
Free with trial Up and Down sign with green and red arrows vector illustration. Concept of sales bar chart symbol icon with arrow moving down and sales bar chart with arrow moving up. Progress decrease vectors Up and Down sign with green and red arrows vector illustration. Concept of sales bar chart symbol icon with arrows. Up and Down sign with green and red arrows vector illustration. Concept of sales bar chart symbol icon with arrow moving down and sales bar chart with arrow moving up.
Free with trial A glowing red zigzag arrow points downward, representing a decline on a digital financial chart. The surface is gridded and dark, highlighting the red of the arrow. The arrow has a neon-like appearance and reflects off the glossy surface, signaling a decrease in value. The surrounding chart includes descending graphical elements indicating fluctuating data, conveying a downturn in financial performance or market trends. Progress decrease illustrations A large red arrow points downwards over a gridded financial chart showing a sharp decline in value. A glowing red zigzag arrow points downward, representing a decline on a digital financial chart. The surface is gridded and dark, highlighting the red of the arrow. The arrow has a neon-like appearance and reflects off the glossy surface, signaling a decrease in value. The surrounding chart includes descending graphical elements indicating fluctuating data, conveying a downturn in financial performance or market trends.
Free with trial A glowing red zigzag arrow points downward, representing a decline on a digital financial chart. The surface is gridded and dark, highlighting the red of the arrow. The arrow has a neon-like appearance and reflects off the glossy surface, signaling a decrease in value. The surrounding chart includes descending graphical elements indicating fluctuating data, conveying a downturn in financial performance or market trends. Progress decrease illustrations A large red arrow points downwards over a gridded financial chart showing a sharp decline in value. A glowing red zigzag arrow points downward, representing a decline on a digital financial chart. The surface is gridded and dark, highlighting the red of the arrow. The arrow has a neon-like appearance and reflects off the glossy surface, signaling a decrease in value. The surrounding chart includes descending graphical elements indicating fluctuating data, conveying a downturn in financial performance or market trends.
Free with trial A glowing red zigzag arrow points downward, representing a decline on a digital financial chart. The surface is gridded and dark, highlighting the red of the arrow. The arrow has a neon-like appearance and reflects off the glossy surface, signaling a decrease in value. The surrounding chart includes descending graphical elements indicating fluctuating data, conveying a downturn in financial performance or market trends. Progress decrease illustrations A large red arrow points downwards over a gridded financial chart showing a sharp decline in value. A glowing red zigzag arrow points downward, representing a decline on a digital financial chart. The surface is gridded and dark, highlighting the red of the arrow. The arrow has a neon-like appearance and reflects off the glossy surface, signaling a decrease in value. The surrounding chart includes descending graphical elements indicating fluctuating data, conveying a downturn in financial performance or market trends.
Free with trial Rocket launching with decreasing bar graph, surrounded by tropical leaves on a blue background. Created with the help of Generative AI tools. Progress decrease illustrations Rocket launching with decreasing bar graph, surrounded by tropical leaves on a blue background
Free with trial Green arrows pointing up and down. Illustrative design shows direction choice. Concept for website user interface button, or for business graphic. Progress decrease illustrations Green arrows pointing up and down. Illustrative design shows direction choice. Concept for website user interface button or for
Free with trial Colorful pie chart is showing positive statistics and business growth, target and financial analysis and marketing report, data with copy space. Progress decrease illustrations Colorful pie chart is showing positive statistics and business growth, target and financial analysis and marketing
Free with trial The image showcases a collection of 3D graphical elements representing different business and market performance metrics. It includes growth percentages, market share gains, pie charts, bar graphs, and target indicators. Each element highlights positive and negative trends, market shares, and growth rates, useful for illustrating financial reports, business presentations, or performance analyses. Progress decrease illustrations Visual representation of various business performance metrics and market growth indicators isolated on white background. The image showcases a collection of 3D. The image showcases a collection of 3D graphical elements representing different business and market performance metrics. It includes growth percentages, market share gains, pie charts, bar graphs, and target indicators. Each element highlights positive and negative trends, market shares, and growth rates, useful for illustrating financial reports, business presentations, or performance analyses.
Free with trial A vibrant illustration of a bar graph with arrows, representing financial trends and market analysis. The image conveys economic performance and business insights. Progress decrease vectors Vector art of colorful bar graph with arrows indicating growth and decline, symbolizing financial trends, market analysis, and. A vibrant illustration of a bar graph with arrows, representing financial trends and market analysis. The image conveys economic performance and business insights
Free with trial Hands holding a tablet displaying a stock market graph, illustrating finance, investment analysis, and modern digital trading. Progress decrease illustrations Hands holding tablet displaying stock market graph. Hands holding a tablet displaying a stock market graph, illustrating finance, investment analysis, and modern digital trading.
Free with trial Graph going Up and Down sign with green and red arrows vector set. Flat design vector set of a concept of sales bar chart symbol icon with arrow moving down and sales bar chart with arrow moving up. Progress decrease vectors Graph going Up and Down sign with green and red arrows vector set. Flat design vector set of a concept of sales bar chart arrows. Graph going Up and Down sign with green and red arrows vector set. Flat design vector set of a concept of sales bar chart symbol icon with arrow moving down and sales bar chart with arrow moving up.
Free with trial A detailed data visualization illustrating market trends over time. The infographic combines a line chart, which shows fluctuating values and percentages, with a bar chart representing data for specific time intervals. The line chart highlights key data points, such as peaks annotated with values like '1. 24%' and '500K'. The x-axis represents a timeline from January to March, while the y-axis. Progress decrease illustrations A modern market trend analysis visualization combining a bar and line chart for financial data isolated on white background. A detailed data visualization illustrating market trends over time. The infographic combines a line chart, which shows fluctuating values and percentages, with a bar chart representing data for specific time intervals. The line chart highlights key data points, such as peaks annotated with values like '1.24%' and '500K'. The x-axis represents a timeline from January to March, while the y-axis
Free with trial Two thick, hand drawn arrows, one pointing upwards and the other downwards, intertwine gracefully, creating an interesting visual resembling the letter h against a clean white backdrop. Progress decrease vectors Two thick, hand drawn arrows, one pointing upwards and the other downwards, intertwine gracefully, creating an
Free with trial Business analytics, data visualization, market research, financial reports, and growth strategies are symbolized in this image. Elegant empty space crafted for branding, ads, and product presentations. Suitable for marketing campaigns and creative displays. . Generative AI. Progress decrease illustrations Colorful Data Charts and Graphs on White Background Business analytics data visualization market research financial reports. Business analytics, data visualization, market research, financial reports, and growth strategies are symbolized in this image. Elegant empty space crafted for branding, ads, and product presentations. Suitable for marketing campaigns and creative displays. . Generative AI
Free with trial Professional vector illustration of downward sloping bar graph and connected dots line represents decreasing profits market loss economic recession data analysis results reduction in growth levels and monthly revenue falling. Progress decrease illustrations Descending bar chart icon with line graph showing negative business trends and financial decline on transparent background. Professional vector illustration of downward sloping bar graph and connected dots line represents decreasing profits market loss economic recession data analysis results reduction in growth levels and monthly revenue falling
Free with trial 3D rendering of a bar graph illustrating a downward trend with blue bars decreasing in height and a red line graph charting the decline set against a dark backdrop signifying business loss economic downturn and financial risk. Progress decrease illustrations 3D Bar Chart Showing Downward Trend with Red Line Graph Illustrating Business Loss and Economic Decline on Dark Background. 3D rendering of a bar graph illustrating a downward trend with blue bars decreasing in height and a red line graph charting the decline set against a dark backdrop signifying business loss economic downturn and financial risk
Free with trial Sine waves analysis outline icon in white and black colors. sine waves analysis flat vector icon from business and analytics collection for web, mobile apps and ui. Progress decrease vectors Sine waves analysis outline icon in white and black colors. sine waves analysis flat vector icon from business and analytics
Free with trial Colorful business graph illustrating a decline in data, featuring a bold red arrow pointing downward. Ideal for enhancing presentations and finance reports with clear visual analysis. Progress decrease vectors Colorful business graph illustrating a decline in data, featuring a bold red arrow pointing downward. Ideal for
Free with trial A colorful bar chart overlays blueprint showcasing data visualization for business analysis colorful on top of blueprinted paper ,Generative ai. Progress decrease illustrations A vibrant and informative colorful bar chart displayed on top of detailed blueprinted paper for comprehensive data analysis. A colorful bar chart overlays blueprint showcasing data visualization for business analysis colorful on top of blueprinted paper ,Generative ai
Free with trial This image displays financial performance indicators, highlighting data trends and market volatility. It represents economic analysis and strategic decision-making processes. Progress decrease vectors Vector art of financial performance indicators, showcasing data trends, market volatility, and economic analysis for strategic. This image displays financial performance indicators, highlighting data trends and market volatility. It represents economic analysis and strategic decision-making processes
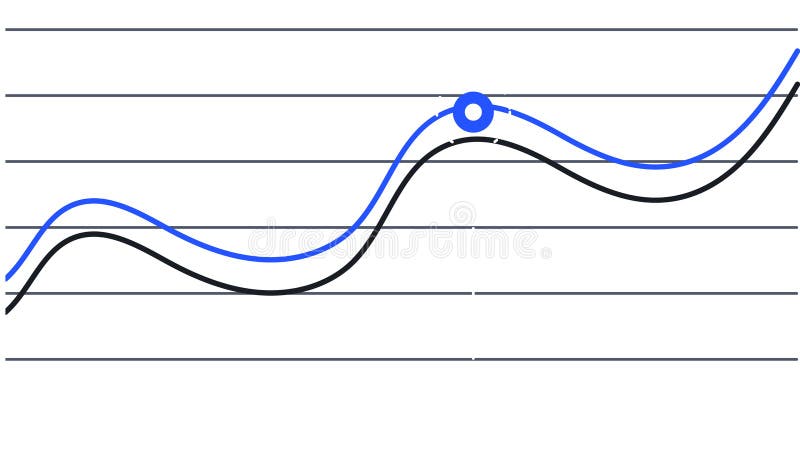
Free with trial Two lines are representing data progression over time, one blue and one black, creating a visual representation of trends and a key intersection point is marked with a blue circle. Progress decrease illustrations Two lines are representing data progression over time, one blue and one black, creating a visual representation of
Free with trial Two lines are representing data progression over time, one blue and one black, creating a visual representation of trends and a key intersection point is marked with a blue circle. Progress decrease vectors Two lines are representing data progression over time, one blue and one black, creating a visual representation of
Free with trial An abstract image depicting stylized blue mountains and orange data points suggesting growth or a dynamic process. Progress decrease illustrations Abstract Blue Mountainscape With Orange Data Points. An abstract image depicting stylized blue mountains and orange data points suggesting growth or a dynamic process
Free with trial Two thick, hand drawn arrows, one pointing upwards and the other downwards, intertwine gracefully, creating an interesting visual resembling the letter h against a clean white backdrop. Progress decrease illustrations Two thick, hand drawn arrows, one pointing upwards and the other downwards, intertwine gracefully, creating an
Free with trial Decreasing bar chart icon in generic style. Market crash sign symbol illustration. Progress decrease vectors Decreasing bar chart icon in generic style. Market crash sign symbol
Free with trial Curved red down arrow and green up arrow icons for visualizing growth, decline, trends, performance metrics, charts, and financial data. Progress decrease vectors Curved red down and green up arrows for growth and decline indicators. Curved red down arrow and green up arrow icons for visualizing growth, decline, trends, performance metrics, charts, and financial data
Free with trial This vibrant line chart illustrates growth and decline trends with colored circles, making it suitable for business presentations, reports, and educational material. Progress decrease illustrations Colorful Line Chart Showing Growth and Decline Trends with Green, Yellow, and Red Circles Representing Data Points over Time. This vibrant line chart illustrates growth and decline trends with colored circles, making it suitable for business presentations, reports, and educational material
Free with trial A person holding a glowing globe with arrows indicating rising quality and falling costs. Progress decrease illustrations Concept of improving quality while reducing costs with a global view. A person holding a glowing globe with arrows indicating rising quality and falling costs
Free with trial Colorful bar chart with a line graph presenting trends and data growth over time, ideal for business analysis, marketing presentations, and financial reports. Progress decrease illustrations Colorful Bar Chart with Line Graph Illustrating Trends and Data Growth over Time For Business, Marketing, Finance and Analysis Use. Colorful bar chart with a line graph presenting trends and data growth over time, ideal for business analysis, marketing presentations, and financial reports
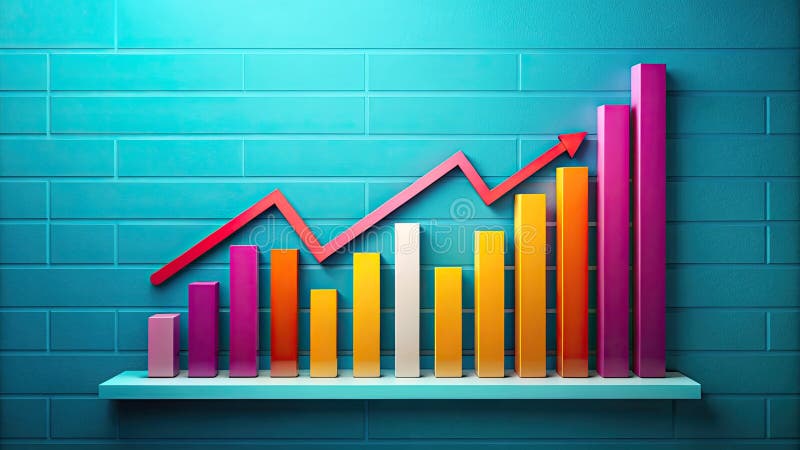
Free with trial Colorful bar charts illustrating positive and negative business trends from january to may provide a clear visual representation of performance. Progress decrease vectors Colorful bar charts illustrating positive and negative business trends from january to may provide a clear visual
Free with trial Colorful bar charts are presenting statistical trends and business performance data across different time periods. Possibly days of the week. Using a vibrant color scheme of blue. Purple. And orange. Progress decrease illustrations Colorful bar charts are presenting statistical trends and business performance data across different time periods
Free with trial Four colorful bar charts are displayed on a graph, representing trends, statistics, and timeline data, with a potential focus on business infographics elements. Progress decrease illustrations Four colorful bar charts are displayed on a graph, representing trends, statistics, and timeline data, with a potential
Free with trial Vector illustration of a graph with a downward arrow, representing decline or negative growth. Progress decrease vectors Professional Graph with Arrow Down Outline Icon Vector Illustration. Vector illustration of a graph with a downward arrow, representing decline or negative growth.
Free with trial Man in blue shirt analyzing colorful bar chart, business performance review and data analysis,Generative AI. Progress decrease illustrations Man in blue shirt analyzing colorful bar chart, business performance review and data analysis
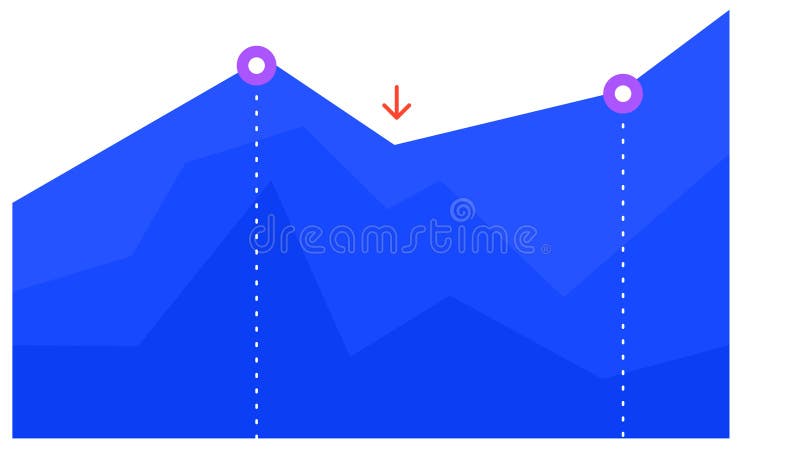
Free with trial Blue graph chart is visually representing growth, decline, and subsequent recovery, with two key points highlighted by purple circles and a red arrow indicating a temporary dip. Progress decrease vectors Blue graph chart is visually representing growth, decline, and subsequent recovery, with two key points highlighted by
Free with trial Blue graph chart is visually representing growth, decline, and subsequent recovery, with two key points highlighted by purple circles and a red arrow indicating a temporary dip. Progress decrease illustrations Blue graph chart is visually representing growth, decline, and subsequent recovery, with two key points highlighted by
Free with trial Simple, black, hand drawn arrow curving down and to the left, isolated on a white background, providing clear direction and visual guidance. Progress decrease vectors Simple, black, hand drawn arrow curving down and to the left, isolated on a white background, providing clear direction
Free with trial Simple, black, hand drawn arrow curving down and to the left, isolated on a white background, providing clear direction and visual guidance. Progress decrease vectors Simple, black, hand drawn arrow curving down and to the left, isolated on a white background, providing clear direction
Free with trial A visually appealing line graph illustrates data fluctuations and trends over time. The minimalist design makes it suitable for presentations and reports in various fields. Progress decrease illustrations Line graph depicting data trends with fluctuations and peaks over time in a minimalist style, showcasing analytical insights and. A visually appealing line graph illustrates data fluctuations and trends over time. The minimalist design makes it suitable for presentations and reports in various fields
Free with trial Colorful bar charts illustrating positive and negative business trends from january to may provide a clear visual representation of performance. Progress decrease illustrations Colorful bar charts illustrating positive and negative business trends from january to may provide a clear visual
Free with trial Vector illustration stacked coins and arrow trending down, decreasing statistical graphic concept. Progress decrease vectors Vector illustration stack coin arrow downup trend. vector illustration stacked coins and arrow trending down, decreasing statistical graphic concept
Free with trial Featuring four vibrant business charts illustrating increasing, decreasing, fluctuating, and peaking trends, perfect for enhancing presentations and reports with clear visual data analysis. Progress decrease vectors Featuring four vibrant business charts illustrating increasing, decreasing, fluctuating, and peaking trends, perfect for
Free with trial Sine waves analysis outline icon in white and black colors. sine waves analysis flat vector icon from analytics collection for web, mobile apps and ui. Progress decrease vectors Sine waves analysis outline icon in white and black colors. sine waves analysis flat vector icon from analytics collection for web
Free with trial This vibrant line graph showcases multiple data series, illustrating trends and fluctuations over time with a clear light grid background, perfect for reports. Progress decrease illustrations Colorful Line Graph Representing Data Trends Over Time with Multiple Data Series and Fluctuating Values on a Light Grid Background. This vibrant line graph showcases multiple data series, illustrating trends and fluctuations over time with a clear light grid background, perfect for reports
Free with trial Two colorful lines are representing data points over time, creating a visual representation of trends and fluctuations, with a highlighted period marked in red. Progress decrease vectors Two colorful lines are representing data points over time, creating a visual representation of trends and fluctuations
Free with trial Graph depicting 3D line and bar data visualization in red, white background, financial trends concept. Progress decrease illustrations Graph showing 3D line and bar data visualization in red, white background, financial trends concept
Free with trial This vibrant 3D bar graph showcases data trends with a colorful aesthetic, perfect for presentations in business, finance, or technology sectors emphasizing analytics. Progress decrease illustrations Colorful Bar Graph Visualization of Data Trends in Modern Business Environment with 3D Perspective and Vibrant Gradient Colors. This vibrant 3D bar graph showcases data trends with a colorful aesthetic, perfect for presentations in business, finance, or technology sectors emphasizing analytics
Free with trial Productivity , diagram bar with gear icon symbol. Vector illustration. Progress decrease vectors Productivity , diagram bar with gear icon. Vector illustration
Free with trial Featuring four vibrant business charts illustrating increasing, decreasing, fluctuating, and peaking trends, perfect for enhancing presentations and reports with clear visual data analysis. Progress decrease illustrations Featuring four vibrant business charts illustrating increasing, decreasing, fluctuating, and peaking trends, perfect for
Free with trial Two colorful lines are representing data points over time, creating a visual representation of trends and fluctuations, with a highlighted period marked in red. Progress decrease illustrations Two colorful lines are representing data points over time, creating a visual representation of trends and fluctuations
Free with trial 3d Up and Down sign with red arrows vector collection. Design vector illustration concept of sales bar chart symbol icon set with arrow moving down and sales bar chart with arrow moving up. Progress decrease vectors 3d Up and Down sign with red arrows vector collection. Design vector illustration concept of sales bar chart symbol icon set
Free with trial This sleek, minimalist linear bar graph is perfect for showcasing downward trends in your business data. Ideal for presentations, reports, and dashboards, this editable graphic allows you to easily customize stroke width and colors to match your brand. The clean design and simple layout make complex data easily digestible, highlighting key performance indicators and areas needing attention. Progress decrease illustrations Editable Linear Bar Graph Visualize Downward Trends for Powerful Business Analytics Reports and Presentations. This sleek, minimalist linear bar graph is perfect for showcasing downward trends in your business data. Ideal for presentations, reports, and dashboards, this editable graphic allows you to easily customize stroke width and colors to match your brand. The clean design and simple layout make complex data easily digestible, highlighting key performance indicators and areas needing attention.
Free with trial Up and Down sign with blue and red arrows vector illustration. Concept of sales bar chart symbol icon with arrow moving down and sales bar chart with arrow moving up. Progress decrease vectors Up and Down sign with blue and red arrows vector illustration. Concept of sales bar chart symbol
Free with trial Red 3D Percentage Symbol With Arrow Pointing Down. Price reduction percentage sign in red. Vector Illustrator. Progress decrease vectors Red 3D Percentage Symbol With Arrow Pointing Down. Vector Illustrator. Red 3D Percentage Symbol With Arrow Pointing Down. Price reduction percentage sign in red. Vector Illustrator.
Free with trial 3D rendered graph showing decreasing stock prices against a circuit board background. Illustrates market downturn in technology sector. Progress decrease illustrations Market Trend Analysis: 3D Render of Decreasing Stock Prices and Circuit Board Background Illustrating Technological Market. 3D rendered graph showing decreasing stock prices against a circuit board background. Illustrates market downturn in technology sector
Free with trial Businessman analyzes financial data on digital tablet. Graphs, charts display performance, cost reduction. Modern business strategy project management concepts in focus. Data analysis. Progress decrease illustrations Businessman analyzes financial data on digital tablet. Graphs, charts display performance, cost reduction. Modern business
Free with trial Icon of a splash of poured liquid on the surface. Icon of flowing drop, wave, splash, splash of nature isolated on white background. Dripping liquid. Water spill. A drop of rain and a drop of sweat. Progress decrease vectors A large splash of spilled liquid on the surface. Icon of a splash of poured liquid on the surface. Icon of flowing drop, wave, splash, splash of nature isolated on white background. Dripping liquid. Water spill. A drop of rain and a drop of sweat
Free with trial A businessman presents a cost reduction concept, featuring a downward-trending graph illustrating financial success. Ideal for finance, business strategy, and marketing materials, this digital illustration conveys budget management and. Progress decrease illustrations Businessman presenting cost reduction concept with falling graph representing financial progress and success. A businessman presents a cost reduction concept, featuring a downward-trending graph illustrating financial success. Ideal for finance, business strategy, and marketing materials, this digital illustration conveys budget management and
Free with trial Stock Market icon vector image. Suitable for mobile application web application and print media. Progress decrease illustrations Stock Market icon vector image.
Free with trial Reduction chart icon. eps. Progress decrease vectors Chart Icon Demonstrating Reduction in Data, Business Decline, and Statistical Analysis. Reduction chart icon.eps
Free with trial Collage artwork graphics picture of funny excited purposeful guy running achieving success isolated painting background. Progress decrease illustrations Collage artwork graphics picture of funny excited purposeful guy running achieving success isolated painting background
Free with trial Company is engaged in joint problem solving, sales decline, downward decline. Progress decrease vectors Company is engaged in joint problem solving, sales decline, downward decline
Free with trial Minimalist black and white outline vector illustration of a simplified line graph icon for business analytics and financial performance tracking in a corporate environment. Progress decrease vectors Clean and straightforward icon depicting an increasing and decreasing line graph. Minimalist black and white outline vector illustration of a simplified line graph icon for business analytics and financial performance tracking in a corporate environment
Free with trial An upward trend in finance represented by stacks of coins and a red arrow, symbolizing growth and prosperity, Generative AI. Progress decrease illustrations Stack of coins with a red downward arrow, illustrating the effect of falling interest rates on savings. An upward trend in finance represented by stacks of coins and a red arrow, symbolizing growth and prosperity, Generative AI.
Free with trial A visual representation of financial growth, featuring stacked coins and an upward trend graph symbolizing increasing wealth, Generative AI. Progress decrease illustrations Stack of coins with a red downward arrow, illustrating the effect of falling interest rates on savings. A visual representation of financial growth, featuring stacked coins and an upward trend graph symbolizing increasing wealth, Generative AI.
Free with trial 3D delivery truck with arrow graph, transportation and inflation concept Generative AI. Progress decrease illustrations 3D delivery truck with arrow graph, transportation and inflation concept
Free with trial Close-up view of a graph with vibrant blue background. detailed analysis of data trends, insights, and patterns ,Generative AI. Progress decrease illustrations Detailed analysis, exploring data trends and patterns in vibrant blue graph. closeup view of business performance market insights. Close-up view of a graph with vibrant blue background. detailed analysis of data trends, insights, and patterns ,Generative AI
Free with trial Up and Down sign with green and red arrows vector illustration. Concept of sales bar chart symbol icon with arrow moving down and sales bar chart with arrow moving up. Progress decrease vectors Up and Down sign with green and red arrows vector illustration. Concept of sales bar chart symbol icon with arrows. Up and Down sign with green and red arrows vector illustration. Concept of sales bar chart symbol icon with arrow moving down and sales bar chart with arrow moving up.
Free with trial A stack of wooden blocks with a red arrow pointing downward. The blocks are numbered from 1 to 7 generated by AI. Progress decrease vectors A stack of wooden blocks with a red arrow pointing downward generated by AI. A stack of wooden blocks with a red arrow pointing downward. The blocks are numbered from 1 to 7 generated by AI