Free with trial 3D bar chart with red arrows pointing upwards, reflecting off a shiny, blue surface. The clean, minimalist design symbolizes financial growth, business success, and positive market trends. Ideal for use in presentations, financial reports, and marketing materials related to investment, stock market, and economic progress. Progress decrease illustrations Financial Growth 3D Bar Chart with Red Arrows. 3D bar chart with red arrows pointing upwards, reflecting off a shiny, blue surface. The clean, minimalist design symbolizes financial growth, business success, and positive market trends. Ideal for use in presentations, financial reports, and marketing materials related to investment, stock market, and economic progress
Free with trial White clouds illustrate CO2 levels decreasing. Arrows show CO2 exchange, transitioning to leaves symbolizing carbon capture and a cleaner environment. Progress decrease illustrations Carbon Dioxide Reduction: A Clean Energy Conceptual Illustration. White clouds illustrate CO2 levels decreasing. Arrows show CO2 exchange, transitioning to leaves symbolizing carbon capture and a cleaner environment
Free with trial A solid, bright yellow 3D arrow is depicted pointing directly downwards. The arrow has a smooth, rounded appearance and is presented in isolation on a clean white background. It signifies direction, a downward movement, or a selection to go lower. Progress decrease illustrations Yellow 3D Arrow Pointing Downwards on White Background direction. A solid, bright yellow 3D arrow is depicted pointing directly downwards. The arrow has a smooth. A solid, bright yellow 3D arrow is depicted pointing directly downwards. The arrow has a smooth, rounded appearance and is presented in isolation on a clean white background. It signifies direction, a downward movement, or a selection to go lower
Free with trial 3D bar chart with red arrows pointing upwards, reflecting off a shiny, blue surface. The clean, minimalist design symbolizes financial growth, business success, and positive market trends. Ideal for use in presentations, financial reports, and marketing materials related to investment, stock market, and economic progress. Progress decrease illustrations Financial Growth 3D Bar Chart with Red Arrows. 3D bar chart with red arrows pointing upwards, reflecting off a shiny, blue surface. The clean, minimalist design symbolizes financial growth, business success, and positive market trends. Ideal for use in presentations, financial reports, and marketing materials related to investment, stock market, and economic progress
Free with trial Data analytics icons set in duotone outline stroke design for web. Pack pictograms of search, mining, filter, pie chart, presentation, mind map, database, discover, flow, other. Vector illustration. Progress decrease illustrations Data analytics icons set in duotone outline stroke design for web. Pack pictograms of search, mining, filter, pie chart
Free with trial Red to green arrow represents both positive and negative trends within one visual element Perfect for illustrating financial or economic concepts. Progress decrease illustrations Directional Arrow Showing Up and Down Growth in Red and Green. Red to green arrow represents both positive and negative trends within one visual element Perfect for illustrating financial or economic concepts
Free with trial Stock Market icon vector image. Suitable for mobile application web application and print media. Progress decrease vectors Stock Market icon vector image.
Free with trial Two bar charts are displayed side by side. One shows a clear upward trend with a green arrow, while the other shows a downward trend with a red arrow. Progress decrease illustrations Bar charts showing contrasting upward and downward trends. Two bar charts are displayed side by side. One shows a clear upward trend with a green arrow, while the other shows a downward trend with a red arrow
Free with trial Three isometric 3D bar chart columns with a gradient color fill on a light background. Progress decrease illustrations Three Isometric 3D Bar Chart Columns with Gradient Colors. Three isometric 3D bar chart columns with a gradient color fill on a light background
Free with trial A simple graphic showing various data representation methods including bar, line, and pie charts in a monochrome style. Progress decrease vectors Black and White Data Visualization Charts Bar Graph, Line Graph, and Pie Charts. A simple graphic showing various data representation methods including bar, line, and pie charts in a monochrome style
Free with trial A dark-themed dashboard displaying various charts and graphs visualizing business data analytics. Progress decrease illustrations Dark Theme Data Analytics Dashboard Displays Various Charts. A dark-themed dashboard displaying various charts and graphs visualizing business data analytics
Free with trial A close-up, angled perspective of several printed business reports displaying a variety of financial data. The documents feature colorful pie charts, blue bar graphs, and line graphs tracking performance and statistics. This image is perfect for illustrating concepts such as data analysis, market research, financial planning, investment strategy, and corporate performance review. The detailed charts and figures represent the core of business analytics, accounting, and economic forecasting, making it a versatile background for financial presentations and articles. Progress decrease illustrations Business Analytics Report with Financial Charts and Graphs. A close-up, angled perspective of several printed business reports displaying a variety of financial data. The documents feature colorful pie charts, blue bar graphs, and line graphs tracking performance and statistics. This image is perfect for illustrating concepts such as data analysis, market research, financial planning, investment strategy, and corporate performance review. The detailed charts and figures represent the core of business analytics, accounting, and economic forecasting, making it a versatile background for financial presentations and articles.
Free with trial A vibrant 3D rendered image featuring a large, stylized arrow pointing downwards, outlined with bright blue and pink neon lights. The arrow stands on a dark, textured floor, from which glowing parallel lines of similar neon hues extend into the distance, creating a sense of depth and direction. This modern and futuristic graphic is ideal for concepts related to download, direction, data flow, decline, or digital navigation. Generated by AI. Progress decrease illustrations Neon Down Arrow and Glowing Lines on Dark Textured Surface. A vibrant 3D rendered image featuring a large, stylized arrow pointing downwards, outlined with bright blue and pink neon lights. The arrow stands on a dark, textured floor, from which glowing parallel lines of similar neon hues extend into the distance, creating a sense of depth and direction. This modern and futuristic graphic is ideal for concepts related to download, direction, data flow, decline, or digital navigation. Generated by AI
Free with trial Sleek blue circular icon featuring a prominent white arrow indicating downward and leftward movement. Perfect for interface design, navigation systems, or indicating decline. Progress decrease vectors Modern blue icon with white arrow pointing down and left for navigation or direction. Sleek blue circular icon featuring a prominent white arrow indicating downward and leftward movement. Perfect for interface design, navigation systems, or indicating decline
Free with trial Decreasing bar chart icon in generic design. Market crash sign symbol illustration. Progress decrease vectors Decreasing bar chart icon in generic design. Market crash sign symbol
Free with trial Two bar charts, one green showing growth and one red showing decline, with trend lines and arrows. Progress decrease illustrations Bar charts showing upward and downward trends. Two bar charts, one green showing growth and one red showing decline, with trend lines and arrows
Free with trial Yellow cube with arrow up. Business and market growth concept. Close-up. Progress decrease illustrations Yellow cube with arrow up. Business and market growth concept
Free with trial A 3D figure sits on a platform reviewing financial data, using a laptop to analyze bar graphs, pie charts and line graphs representing business performance and growth. Progress decrease illustrations 3D Character Analyzing Business Charts and Graphs on Laptop. A 3D figure sits on a platform reviewing financial data, using a laptop to analyze bar graphs, pie charts and line graphs representing business performance and growth.
Free with trial Up and Down Arrows Contrasting Trends Symbolizing Fluctuations. Progress decrease vectors Up and Down Arrows Contrasting Trends Symbolizing Fluctuations
Free with trial A grid of black icons representing various types of graphs and charts, including bar graphs and line graphs with upward arrows, on a white background. Progress decrease vectors Collection of Ai-Generated black and white graph and chart icons. A grid of black icons representing various types of graphs and charts, including bar graphs and line graphs with upward arrows, on a white background
Free with trial Bar graph with weather icons and rising line chart on grid backdrop. Ideal for analytics, statistics, weather data, trend analysis, business forecasting, seasonal planning. A simple flat metaphor. Progress decrease illustrations Seasonal Data Trends Displayed on Bar Graph with Line Chart and Weather Icons. Bar graph with weather icons and rising line chart on grid backdrop. Ideal for analytics, statistics, weather data, trend analysis, business forecasting, seasonal planning. A simple flat metaphor
Free with trial An abstract and futuristic digital visualization of financial data, featuring glowing blue bar charts and candlestick patterns reflecting on a sleek, dark surface. The dynamic composition, set against a deep blue background with subtle grid lines, evokes concepts of technology, business growth, and market analysis. Ideal for illustrating topics related to stock market trends, investment strategies, economic reports, big data analytics, and the future of finance in a modern, high-tech context. Progress decrease illustrations Futuristic Digital Finance Chart with Glowing Blue Data Bars. An abstract and futuristic digital visualization of financial data, featuring glowing blue bar charts and candlestick patterns reflecting on a sleek, dark surface. The dynamic composition, set against a deep blue background with subtle grid lines, evokes concepts of technology, business growth, and market analysis. Ideal for illustrating topics related to stock market trends, investment strategies, economic reports, big data analytics, and the future of finance in a modern, high-tech context.
Free with trial A 3D isometric bar chart displaying colorful bars of varying heights on a blue grid base, representing data analysis and business growth, isolated on white. Progress decrease illustrations 3d bar chart with colorful bars isolated on white background. A 3D isometric bar chart displaying colorful bars of varying heights on a blue grid base, representing data analysis and business growth, isolated on white
Free with trial A vibrant red, three-dimensional arrow dramatically points downwards against a dark gray background, symbolizing decline or loss. The glossy surface and sharp angles create a striking visual. Progress decrease illustrations Glossy Red 3D Arrow Pointing Downward: Dramatic Decline Visual. A vibrant red, three-dimensional arrow dramatically points downwards against a dark gray background, symbolizing decline or loss. The glossy surface and sharp angles create a striking visual.
Free with trial A single, glossy, three-dimensional green arrow pointing downwards. The arrow has a smooth, reflective surface and is presented in isolation against a plain white background. Clear details and vibrant colors enhance visual appeal. Progress decrease illustrations Glossy green down arrow icon on a white background direction. A single, glossy, three-dimensional green arrow pointing downwards. The arrow has a smooth, reflective surface and is presented in isolation against a plain white background. Clear details and vibrant colors enhance visual appeal
Free with trial A bright purple upward-pointing arrow stands next to a soft pink downward-pointing arrow against a neutral gray background. The arrows are rendered in a smooth, 3D style, representing concepts of choice, direction, comparison, or opposing forces. Progress decrease illustrations Purple Up Arrow and Pink Down Arrow on Gray Background image photo. A bright purple upward-pointing arrow stands next to a soft pink downward-pointing arrow against a neutral gray background. The arrows are rendered in a smooth, 3D style, representing concepts of choice, direction, comparison, or opposing forces
Free with trial This image displays a dynamic business analytics dashboard featuring both bar and line graphs. The bar chart illustrates varying percentages (15%, 50%, 75%, 85%), suggesting performance metrics or growth stages. The line chart, with its intersecting blue lines and data points, represents trends, fluctuations, and comparisons over time or across different categories. The clean, modern design makes it ideal for financial reports, business presentations, and data visualization concepts. Progress decrease illustrations Business Growth and Performance Analysis with Bar and Line Charts. This image displays a dynamic business analytics dashboard featuring both bar and line graphs. The bar chart illustrates varying percentages (15%, 50%, 75%, 85%), suggesting performance metrics or growth stages. The line chart, with its intersecting blue lines and data points, represents trends, fluctuations, and comparisons over time or across different categories. The clean, modern design makes it ideal for financial reports, business presentations, and data visualization concepts.
Free with trial Growth and declining graph bar icon with flat rounded cartoon style. Charts with bar growth and declining. Graph trending upwards arrow and downwards arrow. Eps 10 vector illustration. Progress decrease vectors Growth and declining graph bar icon with flat rounded cartoon style
Free with trial This dynamic 3D render visualizes financial growth and market trends. A series of green bars represents increasing values, overlaid by a prominent green arrow pointing upwards, symbolizing success and positive performance. Contrasting this, a red arrow also indicates a trend, though its path suggests volatility or a different metric. Below, a complex network graph with interconnected nodes and lines adds a layer of data analysis and interconnectedness, suitable for concepts like investment, analytics, and economic forecasting. Progress decrease illustrations Upward Trend: Green and Red Arrows Over Bar Chart and Network Graph. This dynamic 3D render visualizes financial growth and market trends. A series of green bars represents increasing values, overlaid by a prominent green arrow pointing upwards, symbolizing success and positive performance. Contrasting this, a red arrow also indicates a trend, though its path suggests volatility or a different metric. Below, a complex network graph with interconnected nodes and lines adds a layer of data analysis and interconnectedness, suitable for concepts like investment, analytics, and economic forecasting.
Free with trial Profit and loss infographic template. Simple business presentation profit and loss issue. Progress decrease vectors Profit and loss infographic template. Simple business presentation profit and loss issue
Free with trial The image showcases a vibrantly painted semi-truck traversing a highway at night. The truck's trailer features a stylized world map design in warm tones. The road is dramatically illuminated with streaks of light suggesting motion blur and speed. The background includes a softly blurred cityscape and dark horizon. The overall color palette is warm and saturated, with contrasting light and dark elements creating a dynamic visual impact. The image has a high degree of sharpness in the central truck and a gradual decrease in sharpness towards the background, creating a sense of depth. The light streaks on the highway contribute to the feeling of movement and progress. Progress decrease illustrations Global Logistics, Illuminated Highway. The image showcases a vibrantly painted semi-truck traversing a highway at night. The truck's trailer features a stylized world map design in warm tones. The road is dramatically illuminated with streaks of light suggesting motion blur and speed. The background includes a softly blurred cityscape and dark horizon. The overall color palette is warm and saturated, with contrasting light and dark elements creating a dynamic visual impact. The image has a high degree of sharpness in the central truck and a gradual decrease in sharpness towards the background, creating a sense of depth. The light streaks on the highway contribute to the feeling of movement and progress.
Free with trial A simple line style icon of a bar chart representing growth, data, or statistics. This graphic element is perfect for use in presentations, infographics, web design, and user interfaces. Progress decrease vectors Simple Line Style Bar Chart Graphic Outline Display Graph Icon. A simple line style icon of a bar chart representing growth, data, or statistics. This graphic element is perfect for use in presentations, infographics, web design, and user interfaces.
Free with trial A bright yellow 3D arrow points directly downwards against a clean white background. The arrow has a smooth, rounded appearance and is a simple, clear symbol of direction. Clear details and vibrant colors enhance visual appeal. Progress decrease illustrations 3D Yellow Downward Arrow on White Background direction symbol. A bright yellow 3D arrow points directly downwards against a clean white background. The arrow has a smooth, rounded appearance and is a simple, clear symbol of direction. Clear details and vibrant colors enhance visual appeal
Free with trial A 3D white character cheerfully presents a bar chart showing upward business growth trends, highlighting success and positive development. Progress decrease illustrations 3D Character Presenting Business Growth Bar Chart. A 3D white character cheerfully presents a bar chart showing upward business growth trends, highlighting success and positive development.
Free with trial This image shows colorful financial charts and graphs, generated by AI, illustrating various data points and percentages. The overlaid arrows suggest a downward trend, potentially indicating a negative market shift or economic decline. The visual representation aids in quick understanding of compl. Progress decrease illustrations Financial Data Analysis. This image shows colorful financial charts and graphs, generated by AI, illustrating various data points and percentages. The overlaid arrows suggest a downward trend, potentially indicating a negative market shift or economic decline. The visual representation aids in quick understanding of compl
Free with trial Colorful bar graph showing market analysis, financial report and accounting on a digital tablet. Generative AI. Progress decrease illustrations Colorful bar graph showing market analysis and financial report. Colorful bar graph showing market analysis, financial report and accounting on a digital tablet. Generative AI
Free with trial This icon represents the concept of compressing, condensing, or applying downward pressure. Progress decrease illustrations Three arrows pointing down to three horizontal lines showing compressing concept. This icon represents the concept of compressing, condensing, or applying downward pressure
Free with trial Red Line Graph Showing Growth and Fluctuation on White Grid Paper, generative Ai. Progress decrease illustrations Red Line Graph Showing Growth and Fluctuation on White Grid Paper
Free with trial Quality increase and cost optimization to improve efficiency and profit. Businessman with quality control growth graph and cost reduction, Effective business, Efficient Risk. Progress decrease vectors Quality increase and cost optimization to improve efficiency and profit. Businessman with quality control growth graph and cost
Free with trial Magnifying glass focuses on a graphic pie chart over document, highlighting trends and potential insights Use for data analysis and business concept. Progress decrease illustrations Analyzing Graphic Pie Chart with Magnifying Glass for Insights. Magnifying glass focuses on a graphic pie chart over document, highlighting trends and potential insights Use for data analysis and business concept
Free with trial A visual representation of negative financial performance, illustrating a declining trend in business or market data with a prominent red arrow indicating a downward movement. Progress decrease illustrations Bar chart showing a downward trend with a red arrow. A visual representation of negative financial performance, illustrating a declining trend in business or market data with a prominent red arrow indicating a downward movement
Free with trial A simple outline icon illustration of a bar chart diagram, used to display data analysis and performance metrics. Ideal for presentations, infographics, and dashboards. Progress decrease vectors Outline Simple Bar Chart Diagram Icon Graphic for Data Analysis. A simple outline icon illustration of a bar chart diagram, used to display data analysis and performance metrics. Ideal for presentations, infographics, and dashboards.
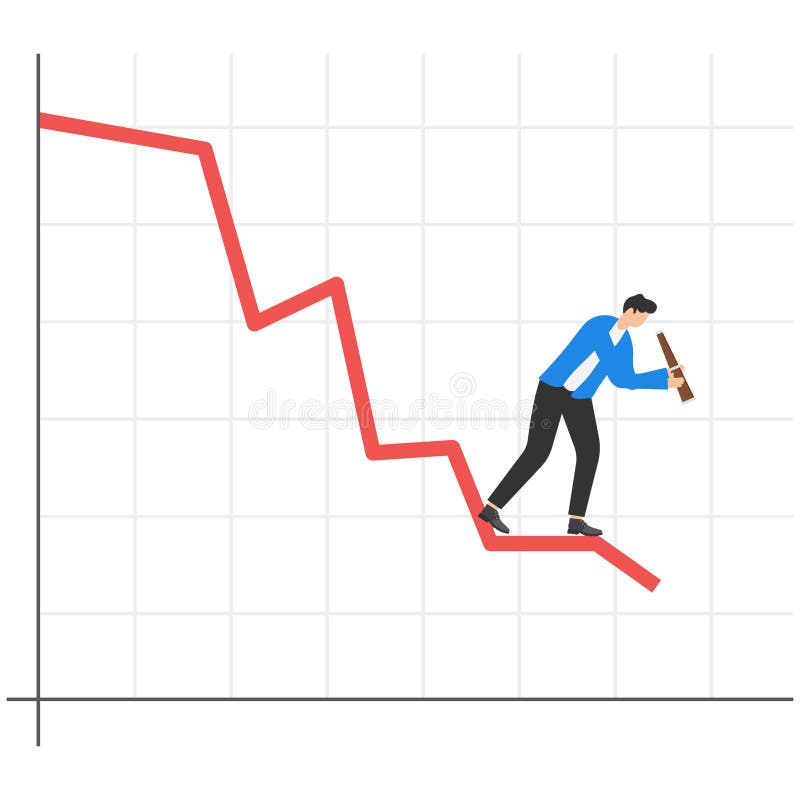
Free with trial Businessman standing on a falling down red graph looks for the bottom. Progress decrease vectors Businessman standing on a falling down red graph looks for the bottom.
Free with trial Reduction chart icon set in thin line outline style and linear vector sign. Progress decrease vectors Reduction chart icon thin line illustration. Reduction chart icon set in thin line outline style and linear vector sign
Free with trial Nine simple black line illustrations of various charts and graphs. Progress decrease vectors Collection of Hand Drawn Charts and Graphs for Data Visualization. Nine simple black line illustrations of various charts and graphs
Free with trial The image showcases a sophisticated data visualization dashboard presenting global information via interactive maps, charts, and graphs. Progress decrease illustrations Global Data Visualization Dashboard Displays Complex Information. The image showcases a sophisticated data visualization dashboard presenting global information via interactive maps, charts, and graphs
Free with trial A set of twelve minimalist data visualization icons, featuring charts, graphs, and other data-related symbols. Perfect for presentations, reports, and dashboards, showcasing data analysis and growth trends. The clean design ensures readability and professional appeal. Progress decrease illustrations Data Visualization Icons
Free with trial A professional businessman showcases the concept of increasing quality while decreasing costs, using a hologram display with upward and downward arrows, while working on a laptop in an office setting. Progress decrease illustrations Businessman presents rising quality and decreasing cost concept. A professional businessman showcases the concept of increasing quality while decreasing costs, using a hologram display with upward and downward arrows, while working on a laptop in an office setting
Free with trial Reduction chart icon vector line logo mark or symbol set collection outline style. Progress decrease vectors Reduction chart icon thin line illustration. Reduction chart icon vector line logo mark or symbol set collection outline style
Free with trial Set of twelve colorful line icons representing various types of data visualization methods, including bar charts, line graphs, pie charts, and more. Perfect for presentations, reports, or websites. Progress decrease illustrations Data Visualization Icons. Set of twelve colorful line icons representing various types of data visualization methods, including bar charts, line graphs, pie charts, and more. Perfect for presentations, reports, or websites.
Free with trial Abstract financial graph fluctuating over dark textured surface Images are created using AI. Progress decrease illustrations Abstract financial graph fluctuating over dark textured surface
Free with trial Line graph icons set simple clean and smooth line and fill vector icons in black on a white background. Progress decrease vectors Line graph icons set simple clean and smooth line and fill vector icons in black
Free with trial White stone arrow pointing right on pink backdrop. Direction guide. Close-up. Progress decrease illustrations White stone arrow pointing right on pink backdrop. Direction guide
Free with trial Design a simple, minimalistic red downward arrow shaped like a folded ribbon or zigzag line. The arrow should start from the top left and sharply descend in a few angular segments, ending in a clean, bold point facing down. Use flat colors (primarily red) with minimal or no shading. The overall style should be clean and modern, with no gradients, textures, or background details�just a plain white background and a bold, geometric arrow indicating decline. Progress decrease vectors Red Down Arrow Symbolizing Economic Recession or Financial Crisis. Design a simple, minimalistic red downward arrow shaped like a folded ribbon or zigzag line. The arrow should start from the top left and sharply descend in a few angular segments, ending in a clean, bold point facing down. Use flat colors (primarily red) with minimal or no shading. The overall style should be clean and modern, with no gradients, textures, or background details�just a plain white background and a bold, geometric arrow indicating decline.
Free with trial Financial bar chart icon with up and down arrow. Economic growth and decline symbol in black circle. Progress decrease vectors Financial bar chart with up and down arrow. Economic growth and decline symbol in black circle
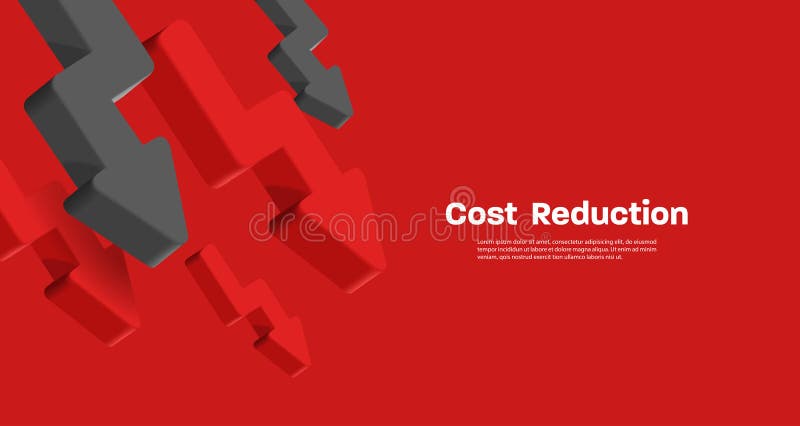
Free with trial Business banner red, decreasing pointing down red and black arrows business composition on red backdrop banner. Progress decrease vectors Business banner red, decreasing pointing down red and black arrows business composition
Free with trial Bright green glossy 3d arrow vector illustration. Perfect for download icons, navigation pointers, or direction indicators. Trendy and eye-catching for web and app design. Progress decrease vectors Bright green glossy 3d arrow vector illustration. Perfect for download icons, navigation pointers, or direction
Free with trial The image showcases a high-speed train in motion, traversing a railway track. The train is sleek and modern in design, with warm, golden light emanating from its windows, possibly reflecting the setting sun. The background features a dramatic sunset with vibrant orange and yellow hues in the clouds. Lush green trees line the railway on either side. The overall composition emphasizes dynamic motion and a sense of journey, with warm lighting creating a dramatic and hopeful atmosphere. The focus is sharp on the train, with a gradual decrease in sharpness toward the background, enhancing depth of field. The color palette is rich and saturated, employing a contrast between the warm sunset tones and the cooler tones of the train and foliage. Progress decrease illustrations High-Speed Train at Sunset. The image showcases a high-speed train in motion, traversing a railway track. The train is sleek and modern in design, with warm, golden light emanating from its windows, possibly reflecting the setting sun. The background features a dramatic sunset with vibrant orange and yellow hues in the clouds. Lush green trees line the railway on either side. The overall composition emphasizes dynamic motion and a sense of journey, with warm lighting creating a dramatic and hopeful atmosphere. The focus is sharp on the train, with a gradual decrease in sharpness toward the background, enhancing depth of field. The color palette is rich and saturated, employing a contrast between the warm sunset tones and the cooler tones of the train and foliage.
Free with trial White stone arrow pointing right on black backdrop. Direction guide. Close-up. Progress decrease illustrations White stone arrow pointing right on black backdrop. Direction guide
Free with trial This image features a vibrant 3D representation of a bar chart, composed of translucent, glowing blocks in shades of pink, yellow, and cyan. The bars are arranged in varying heights, suggesting growth or data representation. The background is a dark green digital grid with subtle light effects and floating particles, creating a futuristic and technological atmosphere. This visual is ideal for concepts related to finance, data analysis, technology, growth, and digital trends. Progress decrease illustrations Abstract 3D Bar Chart with Neon Glow on Green Digital Background. This image features a vibrant 3D representation of a bar chart, composed of translucent, glowing blocks in shades of pink, yellow, and cyan. The bars are arranged in varying heights, suggesting growth or data representation. The background is a dark green digital grid with subtle light effects and floating particles, creating a futuristic and technological atmosphere. This visual is ideal for concepts related to finance, data analysis, technology, growth, and digital trends.
Free with trial Cityscape at sunset with overlayed red stock market graph showing decline. Progress decrease illustrations Cityscape at sunset with overlayed red stock market graph showing
Free with trial Doodle style bar and line graph icon representing growth and analytics. Progress decrease vectors Doodle style bar and line graph icon representing growth and analytics
Free with trial Bar graph depicts a downward trend in data, using various colors to illustrate the decline effectively. Progress decrease illustrations Graph illustrating data trends showing a steady decline over time. Bar graph depicts a downward trend in data, using various colors to illustrate the decline effectively.
Free with trial Hourglass with sand flowing, a lightning bolt, and bar chart aligned as decreasing bars. Ideal for time management, efficiency, productivity, energy flow, deadlines, data analysis simple flat. Progress decrease vectors Hourglass with Lightning Bolt and Graph Bars Representing Time, Energy, and Productivity. Hourglass with sand flowing, a lightning bolt, and bar chart aligned as decreasing bars. Ideal for time management, efficiency, productivity, energy flow, deadlines, data analysis simple flat
Free with trial White stone arrow pointing right on yellow backdrop. Direction guide. Close-up. Progress decrease illustrations White stone arrow pointing right on yellow backdrop. Direction guide
Free with trial Economy business crisis and graph investment down on red background. arrow trading chart candlestick fall. vector illustration fantastic technology. Progress decrease vectors Economy business crisis and graph investment down on red background. arrow trading chart candlestick fall.
Free with trial This graphic depicts data insights through a visually appealing bar chart connected by flowing lines, symbolizing the interconnectedness of data points and the flow of information. The varying heights of the bars represent different data values, showcasing growth or trends. The design is clean and. Progress decrease illustrations Data Insights Visualization. This graphic depicts data insights through a visually appealing bar chart connected by flowing lines, symbolizing the interconnectedness of data points and the flow of information. The varying heights of the bars represent different data values, showcasing growth or trends. The design is clean and
Free with trial A collection of minimalist outline icons representing finance and business data charts, symbols, and indicators for graphic design and web development. Progress decrease vectors Minimalist Outline Finance and Business Data Chart Symbol Icon Set. A collection of minimalist outline icons representing finance and business data charts, symbols, and indicators for graphic design and web development.
Free with trial A clean and simple 3D rendered icon of a solid blue downward-pointing arrow. The arrow has rounded corners and is presented on a plain white background with a subtle shadow beneath it. This graphic is ideal for representing direction, downloads, negative trends, or navigation within digital interfaces. Progress decrease illustrations Simple Blue Downward Arrow Icon on White Background down arrow direction. A clean and simple 3D rendered icon of a solid blue downward-pointing arrow. The arrow has rounded corners and is presented on a plain white background with a subtle shadow beneath it. This graphic is ideal for representing direction, downloads, negative trends, or navigation within digital interfaces
Free with trial Isolated illustration of a person with a hoodie and line graph. Perfect for business and investment concepts. Progress decrease vectors Person with Graph in Hoodie Cartoon - Business, Growth, Investment, Trends. Isolated illustration of a person with a hoodie and line graph. Perfect for business and investment concepts.
Free with trial A person is using a stylus to interact with a digital display showing a graph that illustrates quality improvement alongside cost reduction. Focus on effective business strategies. Progress decrease illustrations Quality improvement with cost reduction strategy on digital display. A person is using a stylus to interact with a digital display showing a graph that illustrates quality improvement alongside cost reduction. Focus on effective business strategies
Free with trial A glowing green bar chart with a data line and grid on a black background, representing financial performance. Progress decrease illustrations Glowing Green Bar Chart with Data Line on photo Black graph finance. A glowing green bar chart with a data line and grid on a black background, representing financial performance
Free with trial Decreasing bar chart diagram with down arrow showing negative growth. Progress decrease vectors Decreasing bar chart diagram with down arrow showing negative growth
Free with trial Energy Consumption Decline Chart. Visual representation of decreasing power utilization trends, indicating effective resource management and environmental efficiency. Progress decrease vectors (Energy Consumption Decline Chart. Visual representation of decreasing. Energy Consumption Decline Chart. Visual representation of decreasing power utilization trends, indicating effective resource management and environmental efficiency
Free with trial Bar graph and line chart showing performance decline, icons of person and movement, and a sad face symbol. Ideal for data trends, business analysis, failure, mood, feedback, decision-making. Progress decrease illustrations Declining Trends in Data Analysis with Emotional Impact Represented by Sad Face Icon. Bar graph and line chart showing performance decline, icons of person and movement, and a sad face symbol. Ideal for data trends, business analysis, failure, mood, feedback, decision-making
Free with trial Vector drawing illustration stacked coins and arrow trending down, decreasing statistical graphic concept, drawn in black and white color. Progress decrease vectors Vector drawn illustration black and white icon coins and down arrow trend. vector drawing illustration stacked coins and arrow trending down, decreasing statistical graphic concept, drawn in black and white color
Free with trial A 3D rendered glossy blue arrow pointing downwards is centered on a clean white background. The arrow has a rounded top and a sharp arrowhead, with subtle reflections and highlights indicating its smooth, polished surface. This graphic element is isolated and perfect for conveying direction, download, or a downward trend. Progress decrease illustrations Glossy Blue Down Arrow Symbol on White Background direction pointer. A 3D rendered glossy blue arrow pointing downwards is centered on a clean white background. The arrow has a rounded top and a sharp arrowhead, with subtle reflections and highlights indicating its smooth, polished surface. This graphic element is isolated and perfect for conveying direction, download, or a downward trend
Free with trial Declining bar graph illustration, business, financial, and economic data. Progress decrease vectors Declining bar graph illustration, business, financial, and economic data
Free with trial Downward trending chart with a declining arrow in vector illustration. Progress decrease vectors Downward trending chart with a declining arrow in vector illustration