Free with trial Hand drawn charts and clock showing business growth and speed. Progress decrease illustrations Business Growth Speed Concept. Hand drawn charts and clock showing business growth and speed
Free with trial People discussing progress report. Colleagues analysing charts and graphs with statistical data. Employees during presentation of business results. Teamwork with financial statistics, office meeting. Progress decrease vectors Teamwork with financial statistics, office meeting. Employees during business presentation. People discussing progress report. Colleagues analysing charts and graphs with statistical data. Employees during presentation of business results. Teamwork with financial statistics, office meeting
Free with trial A vibrant 3D bar chart featuring multiple colorful columns, including red, blue, green, yellow, and purple, set against a clean white background. The bars vary in height, representing different data points or categories, and are displayed on a reflective surface, adding depth to the visualization. Grid lines provide a clear scale for interpretation. This modern graphic is ideal for illustrating statistics, business growth, financial performance, market analysis, and educational concepts in presentations, reports, and digital media. Progress decrease illustrations Colorful 3D Bar Chart on White Background. A vibrant 3D bar chart featuring multiple colorful columns, including red, blue, green, yellow, and purple, set against a clean white background. The bars vary in height, representing different data points or categories, and are displayed on a reflective surface, adding depth to the visualization. Grid lines provide a clear scale for interpretation. This modern graphic is ideal for illustrating statistics, business growth, financial performance, market analysis, and educational concepts in presentations, reports, and digital media.
Free with trial This image shows a 3D rendering of a red line graph sharply declining, resting on a white cube. The graphic is generated by AI, and visually represents a negative trend or downturn, suitable for presentations or reports on market analysis, economic forecasts, or business performance. Progress decrease illustrations Declining Trend Visualization. This image shows a 3D rendering of a red line graph sharply declining, resting on a white cube. The graphic is generated by AI, and visually represents a negative trend or downturn, suitable for presentations or reports on market analysis, economic forecasts, or business performance.
Free with trial A tablet displays a colorful bar graph, showcasing data trends. The image emphasizes visual data analysis and modern business tools. The warm wood background adds a professional yet inviting feel. Progress decrease illustrations Tablet Showing Business Graph. A tablet displays a colorful bar graph, showcasing data trends. The image emphasizes visual data analysis and modern business tools. The warm wood background adds a professional yet inviting feel.
Free with trial Analytics morphing sales graph illustration growth metrics, dashboard insights, revenue forecast analytics morphing sales graph. Progress decrease illustrations Analytics morphing sales graph
Free with trial Concentric, spiraling structures create an upward visual motion, composed of smooth, white, circular layers. The layers decrease in size as they ascend towards the center, forming a hypnotic tunnel effect. The design evokes a sense of depth and infinity, with gentle gradients of light and shadow enhancing the three-dimensional appearance. The abstract form suggests a seamless flow, with each layer meticulously aligned, contributing to a harmonious and continuous movement that draws the eye inward. Progress decrease illustrations Strategic Ascent. Concentric, spiraling structures create an upward visual motion, composed of smooth, white, circular layers. The layers decrease in size as they ascend towards the center, forming a hypnotic tunnel effect. The design evokes a sense of depth and infinity, with gentle gradients of light and shadow enhancing the three-dimensional appearance. The abstract form suggests a seamless flow, with each layer meticulously aligned, contributing to a harmonious and continuous movement that draws the eye inward.
Free with trial This image shows multiple yellow sticky notes, each with a downward-pointing black arrow, generated by AI. It represents a concept of decline or negative progression, perhaps in business or data analysis. The consistent pattern suggests a systematic downward trend. Progress decrease illustrations Downward Trending Sticky Notes. This image shows multiple yellow sticky notes, each with a downward-pointing black arrow, generated by AI. It represents a concept of decline or negative progression, perhaps in business or data analysis. The consistent pattern suggests a systematic downward trend.
Free with trial A glossy, three-dimensional green arrow points directly downwards. The arrow has smooth, rounded edges and a shiny surface that reflects light. It is presented on a clean white background, making it stand out as a clear and simple icon or symbol. Progress decrease illustrations Shiny Green Downward Arrow Icon on White Background down arrow green arrow. A glossy, three-dimensional green arrow points directly downwards. The arrow has smooth, rounded edges and a shiny surface that reflects light. It is presented on a clean white background, making it stand out as a clear and simple icon or symbol
Free with trial Up vs down balance on economic scale. Balance on scale. Business Concept. Vector stock illustration. Progress decrease vectors Up vs down balance on economic scale
Free with trial A robotic arm interacts with a declining green graph, generated by AI. This futuristic image symbolizes automation's impact on production, potentially highlighting efficiency drops or market downturns within a technologically advanced manufacturing setting. The scene suggests technological challeng. Progress decrease illustrations AI-Generated Production Decline. A robotic arm interacts with a declining green graph, generated by AI. This futuristic image symbolizes automation's impact on production, potentially highlighting efficiency drops or market downturns within a technologically advanced manufacturing setting. The scene suggests technological challeng
Free with trial This image, generated by AI, depicts a hand placing a small, metallic object onto a graph showing a sharp market decline. It visually represents the fragility and potential for sudden drops in financial markets. The image is a high-quality 3D rendering. Progress decrease illustrations AI-Generated Market Crash Image. This image, generated by AI, depicts a hand placing a small, metallic object onto a graph showing a sharp market decline. It visually represents the fragility and potential for sudden drops in financial markets. The image is a high-quality 3D rendering.
Free with trial Up-Down 3D Icon isolated on white background. Progress decrease illustrations Up-Down 3D Icon isolated on white background
Free with trial This image shows a simple isometric bar graph, generated by AI. It features four black bars of varying heights against a white background, suitable for use as a minimalist graphic or logo. The clean design allows for versatile application in various contexts. Progress decrease illustrations AI-Generated Isometric Bar Graph. This image shows a simple isometric bar graph, generated by AI. It features four black bars of varying heights against a white background, suitable for use as a minimalist graphic or logo. The clean design allows for versatile application in various contexts.
Free with trial Businessmen are holding a co2 cloud with an arrow pointing down, symbolizing carbon emissions reduction. Progress decrease vectors Businessmen holding co2 cloud emissions icon. Businessmen are holding a co2 cloud with an arrow pointing down, symbolizing carbon emissions reduction
Free with trial Simple lineart icon of an eye looking at a bar chart, representing market analysis. Progress decrease vectors Human eye monitoring business bar chart icon. Simple lineart icon of an eye looking at a bar chart, representing market analysis
Free with trial A minimalist, flat design illustration of a bar chart featuring three vertical bars of varying heights. The bars are colored in orange, teal, and a lighter orange, set against a clean white background. This graphic represents data visualization, trends, and comparisons, suitable for business reports, educational materials, or web design elements. Progress decrease illustrations Simple Bar Chart with Three Bars. A minimalist, flat design illustration of a bar chart featuring three vertical bars of varying heights. The bars are colored in orange, teal, and a lighter orange, set against a clean white background. This graphic represents data visualization, trends, and comparisons, suitable for business reports, educational materials, or web design elements.
Free with trial View of Graphs showing declining CO₂ emissions. Progress decrease illustrations Graphs showing declining CO₂ emissions
Free with trial View of Graphs showing declining CO₂ emissions. Progress decrease illustrations Graphs showing declining CO₂ emissions
Free with trial View of Graphs showing declining CO₂ emissions. Progress decrease illustrations Graphs showing declining CO₂ emissions
Free with trial A clean, minimalist 3D render of a blue bar chart with a blue trend line connecting circular data points. The bars vary in height, illustrating growth and fluctuations. The background is a bright, clean white, emphasizing the chart's elements. This graphic is ideal for representing financial data, business growth, market trends, statistics, and performance analysis in a modern and professional style. Progress decrease illustrations 3D Blue Bar Chart with Trend Line. A clean, minimalist 3D render of a blue bar chart with a blue trend line connecting circular data points. The bars vary in height, illustrating growth and fluctuations. The background is a bright, clean white, emphasizing the chart's elements. This graphic is ideal for representing financial data, business growth, market trends, statistics, and performance analysis in a modern and professional style.
Free with trial Seamless diagonal pattern of simple black arrows pointing down left on a minimalist white background, suggesting a descending trend or direction. Progress decrease vectors Seamless diagonal pattern of simple black arrows pointing down left on a minimalist white background, suggesting a
Free with trial This image showcases six vibrant icons representing various data visualization methods, including pie charts, bar graphs, and gauges. These colorful and engaging visuals are perfect for presentations or reports and were generated by AI. They offer a quick and easy way to represent data in a clear a. Progress decrease illustrations Colorful Data Visualization Icons. This image showcases six vibrant icons representing various data visualization methods, including pie charts, bar graphs, and gauges. These colorful and engaging visuals are perfect for presentations or reports and were generated by AI. They offer a quick and easy way to represent data in a clear a
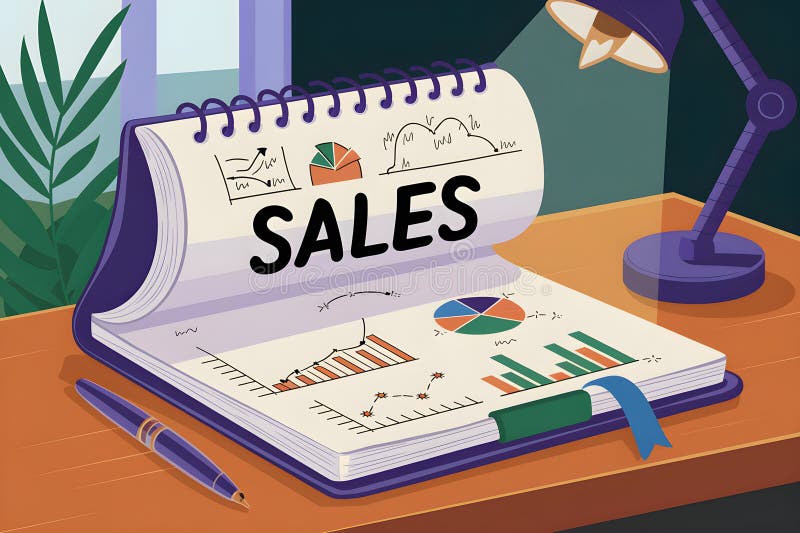
Free with trial Open notebook displaying sales data with charts, graphs, and the word sales highlighted, illuminated by a desk lamp, symbolizing business analysis and strategy. Progress decrease illustrations Sales report with charts and graphs illuminated by desk lamp. Open notebook displaying sales data with charts, graphs, and the word sales highlighted, illuminated by a desk lamp, symbolizing business analysis and strategy
Free with trial Red arrow pointing down isolated, 3d rendering. Progress decrease illustrations Red arrow pointing down isolated
Free with trial This 3D rendering shows a stylized stock market chart, generated by AI, displayed on a sleek, blue metallic stand. The vibrant blue color and modern design make it visually appealing and ideal for representing technological advancements in finance. Progress decrease illustrations AI-Generated Stock Market Display. This 3D rendering shows a stylized stock market chart, generated by AI, displayed on a sleek, blue metallic stand. The vibrant blue color and modern design make it visually appealing and ideal for representing technological advancements in finance.
Free with trial A bold, 3D blue arrow gracefully curves downward, visually representing a shift in direction, decline, or changing trend. Perfect for financial reports, data analysis, or conceptual graphics. Progress decrease vectors Dynamic blue arrow curves downward signaling a trend change. A bold, 3D blue arrow gracefully curves downward, visually representing a shift in direction, decline, or changing trend. Perfect for financial reports, data analysis, or conceptual graphics
Free with trial Glass down arrow sign with the word Down. Progress decrease illustrations Glass down arrow sign with the word Down.
Free with trial A black stock chart icon with upward and downward trends is displayed on a red background to represent business growth. Progress decrease illustrations Stock Chart Icon on Red Background. A black stock chart icon with upward and downward trends is displayed on a red background to represent business growth
Free with trial This vibrant illustration depicts financial growth, showcasing a dramatic upward trend after an initial decline. The 3D bar chart and upward arrow, generated by AI, symbolize overcoming challenges and achieving significant financial success. The gold coin further emphasizes the positive outcome. Progress decrease illustrations AI-Generated Financial Growth Chart. This vibrant illustration depicts financial growth, showcasing a dramatic upward trend after an initial decline. The 3D bar chart and upward arrow, generated by AI, symbolize overcoming challenges and achieving significant financial success. The gold coin further emphasizes the positive outcome.
Free with trial The image shows a series of colorful wooden blocks arranged in ascending order of height, resembling a bar graph. the blocks are placed on a weathered wooden surface, adding a rustic and natural feel to the composition. the colors of the blocks range from orange to purple, creating a visually appealing gradient. the background is blurred, suggesting an outdoor setting with natural light filtering through. the focus is on the blocks, highlighting their texture and the interplay of colors. Progress decrease illustrations Colorful wooden blocks on rustic wood surface. the image shows a series of colorful wooden blocks arranged in ascending order of height, resembling a bar graph. the blocks are placed on a weathered wooden surface, adding a rustic and natural feel to the composition. the colors of the blocks range from orange to purple, creating a visually appealing gradient. the background is blurred, suggesting an outdoor setting with natural light filtering through. the focus is on the blocks, highlighting their texture and the interplay of colors.
Free with trial Decreasing bar graph behind magnifying glass. 3d render. Progress decrease illustrations Decreasing bar graph behind magnifying glass
Free with trial Abstract 3D rendering of a blue bar chart receding into the distance. The bars are arranged in descending order, suggesting a decline or downward trend. The reflective surface adds depth and visual interest, creating a clean and modern aesthetic. This image can be used to illustrate concepts such as financial downturn, market analysis, or statistical data representation. Progress decrease illustrations Abstract Blue Bar Chart. Abstract 3D rendering of a blue bar chart receding into the distance. The bars are arranged in descending order, suggesting a decline or downward trend. The reflective surface adds depth and visual interest, creating a clean and modern aesthetic. This image can be used to illustrate concepts such as financial downturn, market analysis, or statistical data representation.
Free with trial Simple, thick, hand drawn arrow pointing down and making a loop, isolated on a white background, ideal for educational or business presentations. Progress decrease vectors Simple, thick, hand drawn arrow pointing down and making a loop, isolated on a white background, ideal for educational
Free with trial Cityscape Stock Market Crash Overlay, stunning background Generative AI. Progress decrease illustrations Cityscape Stock Market Crash Overlay
Free with trial A graph with a red arrow pointing upward. The graph is orange and blue. The graph is a representation of a trend or growth. Progress decrease vectors A graph with a red arrow pointing upward
Free with trial Collection of red infographic elements including charts, graphs, diagrams and icons. Perfect for presentations, reports, and data visualization. Clean, modern design. Progress decrease illustrations Red Infographic Elements
Free with trial A worrying business report showing a sharp decline, generated by AI, rests on a wooden desk in an office setting. The red graph line dramatically falls, symbolizing potential losses or market downturn. This AI-generated image is perfect for illustrating financial instability or economic crisis. Progress decrease illustrations Declining Business Graph. A worrying business report showing a sharp decline, generated by AI, rests on a wooden desk in an office setting. The red graph line dramatically falls, symbolizing potential losses or market downturn. This AI-generated image is perfect for illustrating financial instability or economic crisis.
Free with trial A close-up shot of Euro coins stacked in several piles against a clean white background. A single 1 Euro coin is prominently displayed in the foreground, leaning against a stack. The stacks of coins decrease in height, creating a sense of growth or financial progress. The image conveys themes of wealth, savings, and European currency. Progress decrease illustrations Euro Coins Stacked on White Background. A close-up shot of Euro coins stacked in several piles against a clean white background. A single 1 Euro coin is prominently displayed in the foreground, leaning against a stack. The stacks of coins decrease in height, creating a sense of growth or financial progress. The image conveys themes of wealth, savings, and European currency.
Free with trial This simple icon depicts a line graph with one line trending upwards and one trending downwards. Progress decrease vectors Line graph showing upward and downward trends icon. This simple icon depicts a line graph with one line trending upwards and one trending downwards
Free with trial Money graphs show growth with bars and charts rising on paper. Progress decrease illustrations Money graphs show growth with bars and charts rising on paper
Free with trial A red line graph with an arrow is trending downward, signifying loss or failure for financial reporting. Progress decrease illustrations Red Line Graph Decreasing. A red line graph with an arrow is trending downward, signifying loss or failure for financial reporting
Free with trial A minimalist 3D rendering showcases a bar chart with an upward arrow and a diverging arrow on a round platform, symbolizing business growth and decline and is suitable for presentations or website graphics. Progress decrease illustrations 3d Bar Chart with Arrow, Growth Concept. A minimalist 3D rendering showcases a bar chart with an upward arrow and a diverging arrow on a round platform, symbolizing business growth and decline and is suitable for presentations or website graphics
Free with trial This vibrant, wavy graph, generated by AI, displays data progression using a color-coded system. The gradual color shift from green to red signifies a change in values, making it ideal for representing various trends or metrics. The accompanying key provides additional clarity. Progress decrease illustrations Colorful AI-Generated Data Visualization. This vibrant, wavy graph, generated by AI, displays data progression using a color-coded system. The gradual color shift from green to red signifies a change in values, making it ideal for representing various trends or metrics. The accompanying key provides additional clarity.
Free with trial Downward Arrow Icon � Flat Vector Design. Progress decrease vectors . Downward Arrow Icon � Flat Vector Design
Free with trial Downward Arrow Icon � Flat Vector Design. Progress decrease vectors . Downward Arrow Icon � Flat Vector Design
Free with trial Downward Arrow Icon � Flat Vector Design. Progress decrease vectors . Downward Arrow Icon � Flat Vector Design
Free with trial Downward Arrow Icon � Flat Vector Design. Progress decrease vectors . Downward Arrow Icon � Flat Vector Design
Free with trial Downward Arrow Icon � Flat Vector Design. Progress decrease vectors . Downward Arrow Icon � Flat Vector Design
Free with trial Downward Arrow Icon � Flat Vector Design. Progress decrease vectors . Downward Arrow Icon � Flat Vector Design
Free with trial Downward Arrow Icon � Flat Vector Design. Progress decrease vectors . Downward Arrow Icon � Flat Vector Design
Free with trial Downward Arrow Icon � Flat Vector Design. Progress decrease vectors . Downward Arrow Icon � Flat Vector Design
Free with trial Orange Downward Arrow With Gradient Effect. Progress decrease vectors Orange Downward Arrow With Gradient Effect
Free with trial A modern flat design icon representing financial data analysis and market trends. This vector illustration features a combination of a green bar chart and a dark grey line graph, showing fluctuations in performance. An upward arrow indicates initial growth, followed by a volatile trend line symbolizing concepts like market instability, economic changes, profit and loss, or business analytics. This versatile graphic is perfect for infographics, financial reports, presentations, websites, and applications related to business, finance, statistics, and economics. Isolated on a white background for easy use. Progress decrease vectors Financial Market Fluctuation Graph Icon. A modern flat design icon representing financial data analysis and market trends. This vector illustration features a combination of a green bar chart and a dark grey line graph, showing fluctuations in performance. An upward arrow indicates initial growth, followed by a volatile trend line symbolizing concepts like market instability, economic changes, profit and loss, or business analytics. This versatile graphic is perfect for infographics, financial reports, presentations, websites, and applications related to business, finance, statistics, and economics. Isolated on a white background for easy use.
Free with trial Arrows going Up and Down, green and red arrows. Concept of sales bar chart symbol icon with arrow moving down and sales. Progress decrease illustrations Arrows going Up and Down, green and red arrows. Concept of sales bar chart symbol icon with arrow moving down and sales
Free with trial This image showcases two contrasting bar charts, constructed from red and white blocks, generated by AI. One chart depicts growth, while the other illustrates decline, offering a visual representation of opposing trends. The use of color and simple shapes makes it easily understandable. Progress decrease illustrations AI-Generated Block Charts: Growth & Decline. This image showcases two contrasting bar charts, constructed from red and white blocks, generated by AI. One chart depicts growth, while the other illustrates decline, offering a visual representation of opposing trends. The use of color and simple shapes makes it easily understandable.
Free with trial Downward Trend Financial Graph Illustration. Progress decrease vectors Downward Trend Financial Graph Illustration
Free with trial Multiple line charts showing data trends over months on a grid background. Concept of data analysis and financial growth. 3D Rendering. Progress decrease illustrations Multiple line charts showing data trends over months on grid background. 3D Rendering. Multiple line charts showing data trends over months on a grid background. Concept of data analysis and financial growth. 3D Rendering
Free with trial Decreasing bar graph isolated on white background. Investment statistics. Economic data. Financial report. Interest rate. Business concept. Top view. 3d render. Progress decrease illustrations Decreasing bar graph isolated on white background
Free with trial Reduction chart icon vector logo set collection for web app ui. Progress decrease vectors Reduction chart icon Thin line illustration set. Reduction chart icon vector logo set collection for web app ui
Free with trial This 3D model depicts an abstract molecular structure, generated by AI, showcasing vibrant colored spheres connected by rods, illustrating complex relationships and connections. The image is ideal for visualizing data, scientific concepts, or as an element of modern design. Progress decrease illustrations AI-Generated Abstract Molecular Structure. This 3D model depicts an abstract molecular structure, generated by AI, showcasing vibrant colored spheres connected by rods, illustrating complex relationships and connections. The image is ideal for visualizing data, scientific concepts, or as an element of modern design.
Free with trial Downward zigzag arrow icon in generic style. Market crash sign symbol vector. Progress decrease vectors Downward zigzag arrow icon in generic style. Market crash sign symbol
Free with trial Statistic Up icon outline collection or set in black and white. Progress decrease vectors Statistic Up icon Line Art Logo set. Statistic Up icon outline collection or set in black and white
Free with trial Hand drawing a graph about real estate market trends - concept image. Progress decrease illustrations Hand drawing a graph about real estate market trends
Free with trial Downward zigzag arrow icon on black circle. Market crash sign symbol vector. Progress decrease vectors Downward zigzag arrow icon on black circle. Market crash sign symbol
Free with trial Red decreasing bar graph on light gray background. Investment statistics. Economic data. Financial report. Interest rate. Business concept. Top view. 3d render. Progress decrease illustrations Red decreasing bar graph on light gray background
Free with trial A red arrow is showing the trend of the market to a downtrend. Background for the economy and data analysis. Progress decrease vectors Red Downtrend Arrow Object Abstract Background. A red arrow is showing the trend of the market to a downtrend. Background for the economy and data analysis.
Free with trial A vibrant, 3D bar graph with colorful blocks rises against a white background. This modern infographic uses geometric shapes to represent data trends, making it a perfect visual for presentations, rep. Progress decrease illustrations Colorful Bar Graph. A vibrant, 3D bar graph with colorful blocks rises against a white background. This modern infographic uses geometric shapes to represent data trends, making it a perfect visual for presentations, rep
Free with trial A conceptual 3D illustration depicting a white growth arrow on a collapsing bar chart. The crumbling blocks and debris symbolize a dramatic failure or downturn. This powerful metaphor represents concepts such as financial crisis, economic recession, stock market crash, business bankruptcy, or unsustainable growth built on a fragile foundation. The minimalist gray background focuses attention on the central theme of collapse and risk, making it ideal for financial reports, business presentations, and articles about economic instability. Progress decrease illustrations Economic Crisis and Crumbling Growth Chart. A conceptual 3D illustration depicting a white growth arrow on a collapsing bar chart. The crumbling blocks and debris symbolize a dramatic failure or downturn. This powerful metaphor represents concepts such as financial crisis, economic recession, stock market crash, business bankruptcy, or unsustainable growth built on a fragile foundation. The minimalist gray background focuses attention on the central theme of collapse and risk, making it ideal for financial reports, business presentations, and articles about economic instability.
Free with trial Economic Loss icon outline collection or set in black and white. Progress decrease vectors Economic Loss icon Line Art Logo set. Economic Loss icon outline collection or set in black and white
Free with trial A bold white percentage symbol displayed centrally on a solid black background, representing discounts, statistics, or general numerical proportions. Progress decrease illustrations White percentage symbol on black background. A bold white percentage symbol displayed centrally on a solid black background, representing discounts, statistics. A bold white percentage symbol displayed centrally on a solid black background, representing discounts, statistics, or general numerical proportions
Free with trial Abstract Glowing Orange and Blue Data Graph. Progress decrease illustrations Abstract Glowing Orange and Blue Data Graph
Free with trial A vibrant, glossy red 3D percentage symbol stands prominently on a clean white background, casting a subtle shadow. This eye-catching graphic is perfect for conveying concepts of discounts, sales, interest rates, financial growth, or statistical data. Its bold, modern design makes it ideal for marketing campaigns, business presentations, retail promotions, economic reports, or any project requiring a clear and impactful representation of percentages, savings, or performance metrics. Progress decrease illustrations Red 3D Percentage Symbol on White Background. A vibrant, glossy red 3D percentage symbol stands prominently on a clean white background, casting a subtle shadow. This eye-catching graphic is perfect for conveying concepts of discounts, sales, interest rates, financial growth, or statistical data. Its bold, modern design makes it ideal for marketing campaigns, business presentations, retail promotions, economic reports, or any project requiring a clear and impactful representation of percentages, savings, or performance metrics.
Free with trial A bright blue, glossy, three-dimensional arrow curves downwards, pointing towards the bottom right of the frame. The arrow has a smooth, reflective surface and is presented against a stark white background, casting a subtle shadow. The image focuses on the directional and dynamic nature of the arrow. Progress decrease illustrations Bright Blue Glossy Arrow Pointing Downwards on White Background shiny. A bright blue, glossy, three-dimensional arrow curves downwards, pointing towards the bottom right of the frame. The arrow has a smooth, reflective surface and is presented against a stark white background, casting a subtle shadow. The image focuses on the directional and dynamic nature of the arrow
Free with trial Statistics icon set, bar diagram illustration, business graph logo icon vector. Progress decrease vectors Statistics icon set, bar diagram illustration, business graph logo icon vector
Free with trial A minimalist line drawing of a bar chart, representing data, statistics and growth. Simple, bold and clean graphic icon. Progress decrease vectors Simple Line Chart Bar Statistic Graphic Icon. A minimalist line drawing of a bar chart, representing data, statistics and growth. Simple, bold and clean graphic icon.
Free with trial Laptop Displays Business Analytics Graph Data. Progress decrease illustrations Laptop Displays Business Analytics Graph Data
Free with trial A comprehensive collection of black and white icons representing various financial and business charts, including bar, line, and pie graphs, for data visualization. Progress decrease vectors Assortment of financial and business chart icons. A comprehensive collection of black and white icons representing various financial and business charts, including bar, line, and pie graphs, for data visualization
Free with trial A vibrant abstract image depicting a neon pink graph rising and falling over a textured pink and blue landscape. Progress decrease illustrations Glowing Neon Graph Over Abstract Pink Terrain. A vibrant abstract image depicting a neon pink graph rising and falling over a textured pink and blue landscape
Free with trial White Bar Chart Decreasing on Blue Background. Progress decrease illustrations White Bar Chart Decreasing on Blue Background