Free with trial A 3D bar chart illustrating a declining trend, perfect for business, finance, and data visualization presentations. Bar chart decrease illustrations Colorful 3D bar graph showing a downward trend in business growth and financial data analysis. A 3D bar chart illustrating a declining trend, perfect for business, finance, and data visualization presentations
Free with trial The image depicts a 3D bar chart with a downward trend. The bars are blue, and a prominent red downward arrow indicates a significant decline in value. This visual representation suggests a negative trend in the stock market or financial metrics. Bar chart decrease illustrations Stock market downtrend. The image depicts a 3D bar chart with a downward trend. The bars are blue, and a prominent red downward arrow indicates a significant decline in value. This visual representation suggests a negative trend in the stock market or financial metrics
Free with trial A simple illustration of a bar chart with a downward arrow showing decline, loss, negative growth, or decreasing business and financial performance. Bar chart decrease vectors Financial Loss Graph Symbol. A simple illustration of a bar chart with a downward arrow showing decline, loss, negative growth, or decreasing business and financial performance
Free with trial Vertical bar graph, bars decrease left to right, red arrow points down Vertical Mobile Wallpaper. Bar chart decrease illustrations Vertical bar graph, bars decrease left to right, red arrow points down
Free with trial Vertical bar graph, bars decrease left to right, red arrow points down For Social Media Post Size. Bar chart decrease illustrations Vertical bar graph, bars decrease left to right, red arrow points down
Free with trial Vertical bar graph, bars decrease left to right, red arrow points down Generative AI. Bar chart decrease illustrations Vertical bar graph, bars decrease left to right, red arrow points down
Free with trial A 3D rendering of a simple bar graph featuring two green and one orange cylinder. This image is perfect for illustrating business concepts, data representation, or as an infographic element. The clean design makes it versatile for various applications. This image was generated with the assistance of artificial intelligence. Bar chart decrease illustrations 3D Bar Graph, Green and Orange Cylinders, Business Chart, Data Visualization, Infographic Element. A 3D rendering of a simple bar graph featuring two green and one orange cylinder. This image is perfect for illustrating business concepts, data representation, or as an infographic element. The clean design makes it versatile for various applications.This image was generated with the assistance of artificial intelligence.
Free with trial This image shows a vibrant 3D bar chart and pie chart, ideal for business presentations and reports to visualize data effectively. The colorful design is visually appealing and easy to understand. Bar chart decrease illustrations Colorful 3D Bar and Pie Charts for Business Presentation. This image shows a vibrant 3D bar chart and pie chart, ideal for business presentations and reports to visualize data effectively. The colorful design is visually appealing and easy to understand.
Free with trial Declining bar chart with downward arrow graphic representing economic downturn and financial loss. Bar chart decrease vectors Declining bar chart with downward arrow graphic representing economic downturn and financial loss
Free with trial Doodle Art of Declining Bar Chart with Arrow Vector Illustration Concept Showing Financial Crisis. Bar chart decrease vectors Doodle Art of Declining Bar Chart with Arrow Vector Illustration Concept Showing Financial Crisis
Free with trial Three black, rounded, vertical bars of progressively increasing height are displayed against a clean white background. The bars are smooth and have a matte finish. This visual representation suggests concepts of growth, progress, data analysis, or a simple bar graph. Bar chart decrease illustrations Three black rounded bars of increasing height on a white background bar chart graph. Three black, rounded, vertical bars of progressively increasing height are displayed against a clean white background. The bars are smooth and have a matte finish. This visual representation suggests concepts of growth, progress, data analysis, or a simple bar graph
Free with trial Stock market trading technical analysis bar chart fall. Business candlestick graph exchange down trend. Crisis economy and investment loss graph. Trader financial index crash concept. Eps banner. Bar chart decrease vectors Stock market trading technical analysis bar chart fall. Business candlestick graph exchange down trend. Crisis economy
Free with trial Stock market trading technical analysis bar chart fall. Business candlestick graph exchange down trend. Crisis economy and investment loss graph. Trader financial index crash concept. Black background. Bar chart decrease vectors Stock market trading technical analysis bar chart fall. Business candlestick graph exchange down trend. Crisis economy
Free with trial Stock market trading technical analysis bar chart fall. Business candlestick graph exchange down trend. Crisis economy and investment loss graph. Trader financial index crash concept. Money losing eps. Bar chart decrease vectors Stock market trading technical analysis bar chart fall. Business candlestick graph exchange down trend. Crisis economy
Free with trial Smartphone displaying a falling bar chart icon, economic recession or financial crisis illustration. Bar chart decrease vectors Smartphone displaying a falling bar chart icon, economic recession or financial crisis illustration
Free with trial Stock market trading technical analysis bar chart fall. Business exchange graph downtrend. Crisis economy and investment loss graph. Trader financial index crash concept. Eps banner dark background. Bar chart decrease vectors Stock market trading technical analysis bar chart fall. Business exchange graph downtrend. Crisis economy and investment
Free with trial Domino effect concept icon showing a declining bar chart representing financial crisis and recession. Bar chart decrease vectors Domino effect concept icon showing a declining bar chart representing financial crisis and recession
Free with trial Hand Drawn Bar Graph Chart with Downward Trend Arrow Representing Economic Decline and Business Loss. Bar chart decrease vectors Hand Drawn Bar Graph Chart with Downward Trend Arrow Representing Economic Decline and Business Loss
Free with trial Reduction chart icon Black line art vector in black and white outline set collection sign. Bar chart decrease vectors Decline Chart Icon Illustrating Decrease in Performance, Economic Downturn, and Analytical Data. Reduction chart icon Black line art vector in black and white outline set collection sign
Free with trial Bar chart with arrow pointing down, illustrating economic decline, business loss, or negative trend data. Bar chart decrease vectors Bar chart with arrow pointing down, illustrating economic decline, business loss, or negative trend data
Free with trial A vibrant watercolor painting of a colorful tree alongside a bar graph showing fluctuating growth, symbolizing nature, growth, change, resilience, and potential. Elegant empty space crafted for branding, ads, and product presentations. Suitable for marketing campaigns and creative displays. . Generative AI. Bar chart decrease illustrations Watercolor Tree and Growth Chart A vibrant watercolor painting of a colorful tree alongside a bar graph showing fluctuating. A vibrant watercolor painting of a colorful tree alongside a bar graph showing fluctuating growth, symbolizing nature, growth, change, resilience, and potential. Elegant empty space crafted for branding, ads, and product presentations. Suitable for marketing campaigns and creative displays. . Generative AI
Free with trial Profit growing and decrease sumbol. Statistic up and down arrows. Business growths chart. Green and red arrow - stock vector. Bar chart decrease illustrations Profit growing and decrease sumbol. Statistic up and down arrows. Business growths chart. Green and red arrow - stock vector
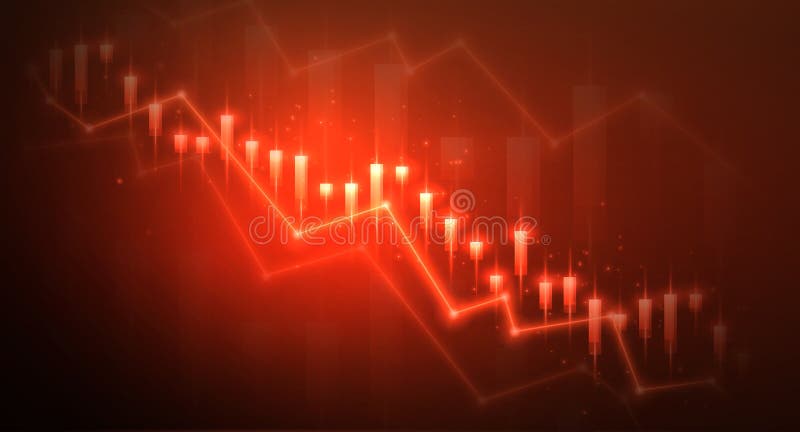
Free with trial A red bar chart against a dark background showing a significant stock market decline. The image suggests financial crisis, risk, and economic downturn, suitable for business and financial related content. Bar chart decrease illustrations Red Stock Market Chart Plunging During Financial Crisis with dark background illustrating sharp decline. A red bar chart against a dark background showing a significant stock market decline. The image suggests financial crisis, risk, and economic downturn, suitable for business and financial related content
Free with trial Declining Bar Chart: Representing Loss, Reduction, and Negative Trends with a Downward-Pointing Arrow Graphic. Bar chart decrease vectors Declining Bar Chart: Representing Loss, Reduction, and Negative Trends with a Downward-Pointing Arrow Graphic
Free with trial Digital tablet displaying a downward trending bar chart and arrow icon symbolizing financial loss or decline. Bar chart decrease vectors Digital tablet displaying a downward trending bar chart and arrow icon symbolizing financial loss or decline
Free with trial A 3D render of a business chart illustrating a financial decline with a visual representation of falling data, presented on an artist's easel. Concept for economic downturn. Bar chart decrease vectors 3d business graph showing a downward trend with bar chart and line on an easel stand transparent background. A 3D render of a business chart illustrating a financial decline with a visual representation of falling data, presented on an artist's easel. Concept for economic downturn
Free with trial A red bar chart showing a significant decline in the stock market. The graph is set against a dark background, emphasizing the concept of financial crisis. The sharp decline and red color convey a sense of loss and market instability. Bar chart decrease illustrations Red Stock Market Decline with Bar Chart on Dark Background Financial Crisis Concept. A red bar chart showing a significant decline in the stock market. The graph is set against a dark background, emphasizing the concept of financial crisis. The sharp decline and red color convey a sense of loss and market instability
Free with trial Financial chart graphic with coins, blue bar graph, blurred orange line chart. Business profit, income growth, investment, financial analysis, marketing, economic saving money concept. Bar chart decrease illustrations Financial chart graphic with coins, blue bar graph, blurred orange line chart. Business profit, income growth, investment
Free with trial A gleaming gold coin with a ridged edge is depicted against a clean white background. The coin's face features a black circular inset containing a golden bar chart with bars decreasing in height from left to right, accompanied by a downward-pointing arrow. This visual represents financial decline or economic loss. Bar chart decrease illustrations Gold Coin with Black Circle Featuring a Downward Trending Bar Chart and Arrow Keywords: coin, gold, money, finance, business. A gleaming gold coin with a ridged edge is depicted against a clean white background. The coin's face features a black circular inset containing a golden bar chart with bars decreasing in height from left to right, accompanied by a downward-pointing arrow. This visual represents financial decline or economic loss
Free with trial This vector illustration depicts a descending bar graph, representing decline and negative trends. It is suitable for financial reports, business analysis, and presentations. Bar chart decrease vectors Illustration of a descending bar graph, , representing decline, decrease, and negative trends in business or finance. This vector illustration depicts a descending bar graph, representing decline and negative trends. It is suitable for financial reports, business analysis, and presentations
Free with trial Up and Down sign with green and red arrows vector illustration. Concept of sales bar chart symbol icon with arrow moving down and sales bar chart with arrow moving up. Bar chart decrease vectors Up and Down sign with green and red arrows vector illustration. Concept of sales bar chart symbol icon
Free with trial Digital tablet icon displaying a bar chart with a downward trend arrow and percentage sign, indicating decline or loss. Bar chart decrease vectors Digital tablet icon displaying a bar chart with a downward trend arrow and percentage sign, indicating decline or loss
Free with trial The image depicts a stylized graphic with a red and white flag positioned at the top of a series of gray blocks that decrease in height from left to right. The flag appears to be waving, suggesting movement or success, while the blocks resemble a bar chart or a staircase. Bar chart decrease illustrations A flag waving atop a progressively descending set of gray blocks. The image depicts a stylized graphic with a red and white flag positioned at the top of a series of gray blocks that decrease in height from left to right. The flag appears to be waving, suggesting movement or success, while the blocks resemble a bar chart or a staircase
Free with trial This image shows a bar graph with a downward trending line and a dollar sign. It represents financial loss, economic downturn, or a decrease in market value. Bar chart decrease vectors Vector art of a bar graph with a downward trending line and a dollar sign, representing financial loss or economic downturn. This image shows a bar graph with a downward trending line and a dollar sign. It represents financial loss, economic downturn, or a decrease in market value
Free with trial Close up view of red falling bar chart with laptop and potted plant in background. It represents financial crisis downturn risk and business failure in market. Investment analytics. Bar chart decrease illustrations Close up view of red falling bar chart with laptop and potted plant in background. It represents financial crisis downturn risk
Free with trial Business financial decline chart showing significant loss. Hand draws a downward orange arrow on a dark blue chalkboard with ample copy space. Ideal for economic analysis, corporate presentations, and marketing materials. Bar chart decrease illustrations Business Financial Decline Chart. Hand drawing bar graph with downward orange arrow on blue chalkboard background, copy space. Business financial decline chart showing significant loss. Hand draws a downward orange arrow on a dark blue chalkboard with ample copy space. Ideal for economic analysis, corporate presentations, and marketing materials.
Free with trial The image displays a bar chart representing yearly data spanning from 2011 to 2021. The bars are colored in blue, with a notable decrease in bar height in 2020, followed by a large increase in 2021. The chart includes a Y-axis with numerical values, though specific labels are not clearly visible. The bars on the right side of the chart have color-coded sections in green, orange, and yellow,. Bar chart decrease illustrations Bar chart showing yearly data from 2011 to 2021 with a significant drop in 2020. The image displays a bar chart representing yearly data spanning from 2011 to 2021. The bars are colored in blue, with a notable decrease in bar height in 2020, followed by a large increase in 2021. The chart includes a Y-axis with numerical values, though specific labels are not clearly visible. The bars on the right side of the chart have color-coded sections in green, orange, and yellow,
Free with trial 3d modelled gold bar on stock market chart, investment concept. Bar chart decrease illustrations Gold bullion on stock market chart, investment concept. 3d modelled gold bar on stock market chart, investment concept.
Free with trial Stock and economic crisis graph background. Trade exchange, financial decrease, bed business strategy, digital asset, loss investment fund, online broker, stock collapse and crisis concept. Bar chart decrease vectors Stock and economic crisis graph background. Trade exchange, financial decrease
Free with trial Gold bar on white background. Isolated 3D illustration. Bar chart decrease illustrations Gold bar on white background. Isolated 3D illustration
Free with trial Stock and economic crisis graph background. Trade exchange, financial decrease, bed business strategy, digital asset, loss investment fund, online broker, stock collapse and crisis concept. Bar chart decrease illustrations Stock and economic crisis graph background. Trade exchange, financial decrease
Free with trial Finance, analytics and market trends. Falling bar chart and line graph showing volatility and decline. Ideal for economic reports and trading visuals. Modern blue gradient vector illustration. Bar chart decrease vectors Financial declining chart with bars and line graph, stock market analytics vector. Finance, analytics and market trends. Falling bar chart and line graph showing volatility and decline. Ideal for economic reports and trading visuals. Modern blue gradient vector illustration.
Free with trial Decrease financial business on white background. Isolated 3D illustration. Bar chart decrease illustrations Decrease financial business on white background. Isolated 3D illustration
Free with trial 3D stock chart. Invest trade market. Forex candlestick graph of economy data exchange. Digital business technology. Investment infographic render arrow buttons. Profit rate motion. Vector background. Bar chart decrease vectors 3D stock chart. Invest trade market. Forex candlestick graph of economy data exchange. Business technology. Investment infographic. 3D stock chart. Invest trade market. Forex candlestick graph of economy data exchange. Digital business technology. Investment infographic render arrow buttons. Profit rate motion. Vector background
Free with trial Outline down chart icon isolated. Flat style design vector illustration on white background. Bar chart decrease vectors Outline down chart icon isolated. Flat style design vector illustration on white background
Free with trial Stock and economic crisis graph background. Trade exchange, financial decrease, bed business strategy, digital asset, loss investment fund, online broker, stock collapse and crisis concept. Bar chart decrease illustrations Stock and economic crisis graph background. Trade exchange, financial decrease
Free with trial Graph and decrease report. Business and finance vector illustrations. Diagram with recession and bankruptcy progress. Bar chart decrease vectors Graph and decrease report. Business and finance vector illustrations. Diagram with recession and bankruptcy
Free with trial Broker trader analyzing economic crisis. Trade exchange, financial decrease, bed business strategy, digital asset, loss investment fund, online broker, stock collapse and crisis concept. Bar chart decrease vectors Broker trader analyzing economic crisis. Trade exchange, financial decrease
Free with trial Financial chart with bull vs bear in stock market on green color background. Bar chart decrease illustrations Print financial chart with bull vs bear in stock market. financial chart with bull vs bear in stock market on green color background
Free with trial Continuous one line art down graph chart icon flat style design isolated vector illustration on white background. Bar chart decrease vectors Continuous one line art down graph chart icon flat style
Free with trial Down graph chart icon in trendy flat style design isolated vector illustration on white background. Bar chart decrease vectors Down graph chart icon in trendy flat style design isolated
Free with trial Graph and diagram from planes with decrease. Finance and business concepts. Vector Illustration isolated. Bar chart decrease vectors Graph and diagram from planes with decrease. Finance and business concepts. Vector Illustration
Free with trial A professional vector set of business chart icons showing both growth and decline trends. Includes bar charts and line graphs with upward and downward arrows, representing profit, loss, performance rise, and financial downfall. Perfect for business presentations, reports, websites, infographics, and more. Fully editable EPS file for scalable design use. Bar chart decrease vectors . A professional vector set of business chart icons showing both growth and decline trends. Includes bar charts and line graphs with upward and downward arrows, representing profit, loss, performance rise, and financial downfall. Perfect for business presentations, reports, websites, infographics, and more. Fully editable EPS file for scalable design use.
Free with trial Financial chart with bull and bear in stock market on red and green color. Bar chart decrease illustrations Financial chart with bull and bear in stock market on red and green color
Free with trial Financial chart with bull and bear in stock market on blue color background. Bar chart decrease illustrations Financial chart with bull and bear in stock market on blue color background
Free with trial Financial chart with bull and bear in stock market on blue color background. Bar chart decrease illustrations Financial chart with bull and bear in stock market on blue color background
Free with trial Diagram with recession and bankruptcy progress. Business and finance vector illustration. Graph with decrease report. Bar chart decrease vectors Diagram with recession and bankruptcy progress. Business and finance vector illustration. Graph with decrease
Free with trial Downward Bar Graph Line Icon, Decline or Loss Vector. Bar chart decrease vectors Downward Bar Graph Line Icon
Free with trial Conceptual graph with decrease report. Dark diagram with recession and bankruptcy progress. Business and finance vector illustration. Bar chart decrease vectors Conceptual graph with decrease report. Dark diagram with recession and bankruptcy progress. Business and finance vector
Free with trial Illustration of a financial decline represented by a bar graph with a downward red arrow. Bar chart decrease vectors Financial decline concept with downward arrow on bar graph. Illustration of a financial decline represented by a bar graph with a downward red arrow.
Free with trial A simple illustration of a bar chart with a downward arrow showing decline, loss, negative growth, or decreasing business and financial performance. Bar chart decrease vectors Downward Trend Analytics Icon. A simple illustration of a bar chart with a downward arrow showing decline, loss, negative growth, or decreasing business and financial performance
Free with trial A simple black icon featuring a house symbol over a bar graph showing a downward trend, indicating a decrease in. Bar chart decrease illustrations Downward trend graph with house icon. A simple black icon featuring a house symbol over a bar graph showing a downward trend, indicating a decrease in.
Free with trial A gold bar graph with an arrow pointing down at the end. Bar chart decrease illustrations A gold bar graph with an arrow
Free with trial Icon set depicting financial growth and decline with upward and downward arrows over bar charts, perfect for business analytics and presentations. Bar chart decrease vectors Bar charts with curved arrows showing trends. Icon set depicting financial growth and decline with upward and downward arrows over bar charts, perfect for business analytics and presentations
Free with trial Graph line icon. Continuous line big heart. Column chart sign. Growth diagram symbol. 3d hearts in heart shaped loop. Graph chart single line ribbon. Loop curve pattern. Vector. Bar chart decrease vectors Graph line icon. Column chart sign. Continuous line big heart. Vector. Graph line icon. Continuous line big heart. Column chart sign. Growth diagram symbol. 3d hearts in heart shaped loop. Graph chart single line ribbon. Loop curve pattern. Vector
Free with trial Graph line icon. Continuous line with share plane. Column chart sign. Growth diagram symbol. 3d heart in speech bubble. Graph chart single line ribbon. Loop curve pattern. Vector. Bar chart decrease vectors Graph line icon. Column chart sign. Continuous line with plane. Vector. Graph line icon. Continuous line with share plane. Column chart sign. Growth diagram symbol. 3d heart in speech bubble. Graph chart single line ribbon. Loop curve pattern. Vector
Free with trial Graph line icon. Continuous line with share plane. Column chart sign. Ab test diagram symbol. 3d star in speech bubble. Graph chart single line ribbon. Loop curve pattern. Vector. Bar chart decrease vectors Graph line icon. Column chart sign. Continuous line with plane. Vector. Graph line icon. Continuous line with share plane. Column chart sign. Ab test diagram symbol. 3d star in speech bubble. Graph chart single line ribbon. Loop curve pattern. Vector
Free with trial A simple flat design graphic illustrates stock market growth and decline using green upward and red downward arrows with bar charts. Ideal for finance and business concepts. Bar chart decrease vectors Bar chart showing financial growth and decline. A simple flat design graphic illustrates stock market growth and decline using green upward and red downward arrows with bar charts. Ideal for finance and business concepts
Free with trial Red financial chart with descending lines and a ladder. Vector 3D illustration. Bar chart decrease vectors Red financial chart with descending lines and a ladder. Vector 3D
Free with trial Graph line icon. Halftone dotted pattern. Gradient icon with grain shadow. Column chart sign. Growth diagram symbol. Line graph chart icon. Various designs. Vector. Bar chart decrease vectors Graph line icon. Column chart sign. Halftone dotted pattern. Vector. Graph line icon. Halftone dotted pattern. Gradient icon with grain shadow. Column chart sign. Growth diagram symbol. Line graph chart icon. Various designs. Vector
Free with trial Graph line icon. Halftone dotted pattern. Gradient icon with grain shadow. Column chart sign. Growth diagram symbol. Line graph chart icon. Various designs. Vector. Bar chart decrease vectors Graph line icon. Column chart sign. Halftone dotted pattern. Vector. Graph line icon. Halftone dotted pattern. Gradient icon with grain shadow. Column chart sign. Growth diagram symbol. Line graph chart icon. Various designs. Vector
Free with trial Business decline. Bar chart falling growth levels, paired with a sad face icon negative outcomes. Ideal for business reports, marketing, finance, corporate strategy, data visualization. Bar chart decrease illustrations Declining Business Growth Concept with Negative Emotional Impact Icon. Business decline. Bar chart falling growth levels, paired with a sad face icon negative outcomes. Ideal for business reports, marketing, finance, corporate strategy, data visualization
Free with trial A set of financial growth and decline chart icons featuring up and down arrows with colorful bars, indicating economic trends. the concept of financial market increases, decreases and fluctuations. Bar chart decrease vectors Set of Financial Fluctuation Chart Icons in Flat Design. A set of financial growth and decline chart icons featuring up and down arrows with colorful bars, indicating economic trends. the concept of financial market increases, decreases and fluctuations
Free with trial Shopping decline concept. Shopping cart with a sad face and downward trend bar chart challenges in retail and declining sales. For business, economics, retail trends, marketing analysis. Bar chart decrease vectors Shopping Cart Decline Concept with Sad Face and Falling Bar Chart ation. Shopping decline concept. Shopping cart with a sad face and downward trend bar chart challenges in retail and declining sales. For business, economics, retail trends, marketing analysis
Free with trial A stylized illustration of a descending bar graph within a website window, rendered in a flat, minimalist design. Bar chart decrease vectors Decreasing bar graph inside a website window interface. A stylized illustration of a descending bar graph within a website window, rendered in a flat, minimalist design.
Free with trial Calendar graph line icon. Neumorphic, Flat shadow, 3d buttons. Column chart sign. Growth diagram symbol. Line calendar graph icon. Social media icons. Vector. Bar chart decrease vectors Calendar graph line icon. Column chart sign. Neumorphic buttons. Vector. Calendar graph line icon. Neumorphic, Flat shadow, 3d buttons. Column chart sign. Growth diagram symbol. Line calendar graph icon. Social media icons. Vector
Free with trial Person seated on bar chart with laptop, upward and downward arrows, cloud element. Ideal for data trends, analytics, cloud computing, statistics, progress tracking, career growth simple flat. Bar chart decrease vectors Woman Analyzing Data on Laptop, Representing Cloud-Based Growth and Decline Trends. Person seated on bar chart with laptop, upward and downward arrows, cloud element. Ideal for data trends, analytics, cloud computing, statistics, progress tracking, career growth simple flat
Free with trial Statistics line icon. Neumorphic, Flat shadow, 3d buttons. Column chart sign. Growth graph diagram symbol. Line graph chart icon. Social media icons. Vector. Bar chart decrease vectors Statistics line icon. Column graph chart sign. Neumorphic buttons. Vector. Statistics line icon. Neumorphic, Flat shadow, 3d buttons. Column chart sign. Growth graph diagram symbol. Line graph chart icon. Social media icons. Vector
Free with trial Candlestick chart icons on a digital trading screen showing market movements, price trends and investment data for finance, stock analysis, trading strategy and economic growth. Bar chart decrease illustrations Candlestick chart displaying financial market data analysis. Candlestick chart icons on a digital trading screen showing market movements, price trends and investment data for finance, stock analysis, trading strategy and economic growth
Free with trial Analytics graph line icon. Continuous line big heart. Column chart sign. Growth diagram symbol. 3d hearts in heart shaped loop. Analytics graph single line ribbon. Loop curve pattern. Vector. Bar chart decrease vectors Analytics graph line icon. Column chart sign. Continuous line big heart. Vector. Analytics graph line icon. Continuous line big heart. Column chart sign. Growth diagram symbol. 3d hearts in heart shaped loop. Analytics graph single line ribbon. Loop curve pattern. Vector