Free with trial Graph line icon. Continuous line big heart. Column chart sign. Growth diagram symbol. 3d hearts in heart shaped loop. Graph chart single line ribbon. Loop curve pattern. Vector. Bar chart decrease vectors Graph line icon. Column chart sign. Continuous line big heart. Vector. Graph line icon. Continuous line big heart. Column chart sign. Growth diagram symbol. 3d hearts in heart shaped loop. Graph chart single line ribbon. Loop curve pattern. Vector
Free with trial A 3D rendered image of a bar chart with a downward trend, set against a bright yellow background. The chart features grey frame and orange bars, with a prominent red arrow indicating a decline. This image is suitable for illustrating concepts related to financial loss, market downturn, economic recession, or negative performance in business and investment contexts. Bar chart decrease illustrations Downward Trend Chart on Yellow Background. A 3D rendered image of a bar chart with a downward trend, set against a bright yellow background. The chart features grey frame and orange bars, with a prominent red arrow indicating a decline. This image is suitable for illustrating concepts related to financial loss, market downturn, economic recession, or negative performance in business and investment contexts.
Free with trial This graphic illustration depicts a stark representation of declining business performance. It features a bar chart with three colorful bars (yellow, orange, green) suggesting varying data points, overlaid with three distinct lines in yellow, blue, and orange, all sharply descending downwards. A prominent red arrow points downwards, emphasizing the negative trend. A small yellow plus sign is also visible, potentially signifying a point of reference or a contrasting element. The clean white background isolates the graphical elements, making them ideal for conveying concepts of loss, recession, or negative growth. Bar chart decrease illustrations Declining Business Graph with Downward Arrows. This graphic illustration depicts a stark representation of declining business performance. It features a bar chart with three colorful bars (yellow, orange, green) suggesting varying data points, overlaid with three distinct lines in yellow, blue, and orange, all sharply descending downwards. A prominent red arrow points downwards, emphasizing the negative trend. A small yellow plus sign is also visible, potentially signifying a point of reference or a contrasting element. The clean white background isolates the graphical elements, making them ideal for conveying concepts of loss, recession, or negative growth.
Free with trial A money loss chart icon featuring a downward arrow and a dollar sign, indicating financial decline. concepts of economic decline, financial losses, and negative trends, financial and business. Bar chart decrease vectors Economic Downturn Chart with Decreasing Bars and Dollar Sign. A money loss chart icon featuring a downward arrow and a dollar sign, indicating financial decline. concepts of economic decline, financial losses, and negative trends, financial and business
Free with trial The image depicts a bar graph with a downward trend. The bars start at a higher value and progressively decrease, indicating a decline. An arrow at the end of the graph further emphasizes the downward direction. Bar chart decrease illustrations Decreasing bar graph. The image depicts a bar graph with a downward trend. The bars start at a higher value and progressively decrease, indicating a decline. An arrow at the end of the graph further emphasizes the downward direction
Free with trial Analytics graph line icon. Continuous line with share plane. Column chart sign. Growth diagram symbol. Hearts rate review in speech bubble. Analytics graph single line ribbon. Vector. Bar chart decrease illustrations Analytics graph line icon. Column chart sign. Continuous line with plane. Vector. Analytics graph line icon. Continuous line with share plane. Column chart sign. Growth diagram symbol. Hearts rate review in speech bubble. Analytics graph single line ribbon. Vector
Free with trial A simplified flat style icon displays a declining bar graph with arrow. Focuses on business and financial themes. Bar chart decrease vectors Flat icon illustration showing bar chart trending downwards. A simplified flat style icon displays a declining bar graph with arrow. Focuses on business and financial themes.
Free with trial Flat vector illustration of a colorful bar graph showing a decreasing trend with an arrow on a black backdrop. Bar chart decrease vectors Decreasing bar graph with downward arrow on black background. Flat vector illustration of a colorful bar graph showing a decreasing trend with an arrow on a black backdrop.
Free with trial A flat design shows a bar graph depicting decreasing sales, with a downward trending red arrow. Bar chart decrease vectors Decreasing Business Chart Shows a Dramatic Downturn in Sales. A flat design shows a bar graph depicting decreasing sales, with a downward trending red arrow.
Free with trial Analytics graph line icon. Halftone dotted pattern. Gradient icon with grain shadow. Column chart sign. Growth diagram symbol. Line analytics graph icon. Various designs. Vector. Bar chart decrease vectors Analytics graph line icon. Column chart sign. Halftone dotted pattern. Vector. Analytics graph line icon. Halftone dotted pattern. Gradient icon with grain shadow. Column chart sign. Growth diagram symbol. Line analytics graph icon. Various designs. Vector
Free with trial Footprint with CO2 text, downward arrow, and bar chart representing reduced emissions. Ideal for sustainability, energy conservation, environmental awareness, ecological impact, climate action. Bar chart decrease illustrations Reducing Carbon Footprint with Energy Efficiency and Sustainability Strategies. Footprint with CO2 text, downward arrow, and bar chart representing reduced emissions. Ideal for sustainability, energy conservation, environmental awareness, ecological impact, climate action
Free with trial A simple flat style bar graph shows a negative trend, with a downward arrow on a black background. Bar chart decrease vectors Decreasing bar graph with downward arrow over black background. A simple flat style bar graph shows a negative trend, with a downward arrow on a black background.
Free with trial Flat style illustration showcasing business financial data analysis via a magnifying glass and graph chart visualization, isolated on black. Bar chart decrease vectors Analyzing Financial Data with Magnifying Glass and Graph Chart. Flat style illustration showcasing business financial data analysis via a magnifying glass and graph chart visualization, isolated on black.
Free with trial Bar graph with an upward trend, blue downward arrow, and percentage sign. Ideal for business analysis, finance, growth, decline trends, statistics economics comparison. Flat simple metaphor. Bar chart decrease vectors Financial chart with growth trend, declining arrow, and percentage symbol representing data analysis. Bar graph with an upward trend, blue downward arrow, and percentage sign. Ideal for business analysis, finance, growth, decline trends, statistics economics comparison. Flat simple metaphor
Free with trial Vertical arrow pointing downward next to bar graph with decreasing metrics. Ideal for business analysis, data visualization, financial downturn, market decline, trend report, economics, simple flat. Bar chart decrease illustrations Declining Bar Graph with Arrow Indicating Downward Trend in Performance or Statistics. Vertical arrow pointing downward next to bar graph with decreasing metrics. Ideal for business analysis, data visualization, financial downturn, market decline, trend report, economics, simple flat
Free with trial Sad face next to bug and downward bar chart symbolizing technical failures, system errors, or negative trends. Ideal for technology, software development, cybersecurity, troubleshooting, performance. Bar chart decrease vectors Sad face with bug and declining chart representing software issues or performance failures. Sad face next to bug and downward bar chart symbolizing technical failures, system errors, or negative trends. Ideal for technology, software development, cybersecurity, troubleshooting, performance
Free with trial Uptrend and downtrend business chart icon vector. Economic growth and decline arrow symbol in black circle. Bar chart decrease vectors Uptrend and downtrend business chart icon. Economic growth and decline arrow symbol in black circle
Free with trial Two simple black bar graphs illustrate a downward trend with arrows, symbolizing financial loss and economic decline. Bar chart decrease vectors Two downward trending bar graphs with diagonal arrows showing decline. Two simple black bar graphs illustrate a downward trend with arrows, symbolizing financial. Two simple black bar graphs illustrate a downward trend with arrows, symbolizing financial loss and economic decline
Free with trial Green red up and down gold chart icon isolated flat style vector illustration on white background. Bar chart decrease vectors Green red up and down gold chart icon isolated flat style
Free with trial Building wooden bar graph with hand, representing growth and progress -. Bar chart decrease illustrations Building wooden bar graph with hand, representing growth and progress
Free with trial A bar graph displaying a downward trend with a large arrow pointing downwards, indicating a decline in values. Bar chart decrease illustrations Decreasing bar graph with downward arrow. A bar graph displaying a downward trend with a large arrow pointing downwards, indicating a decline in values
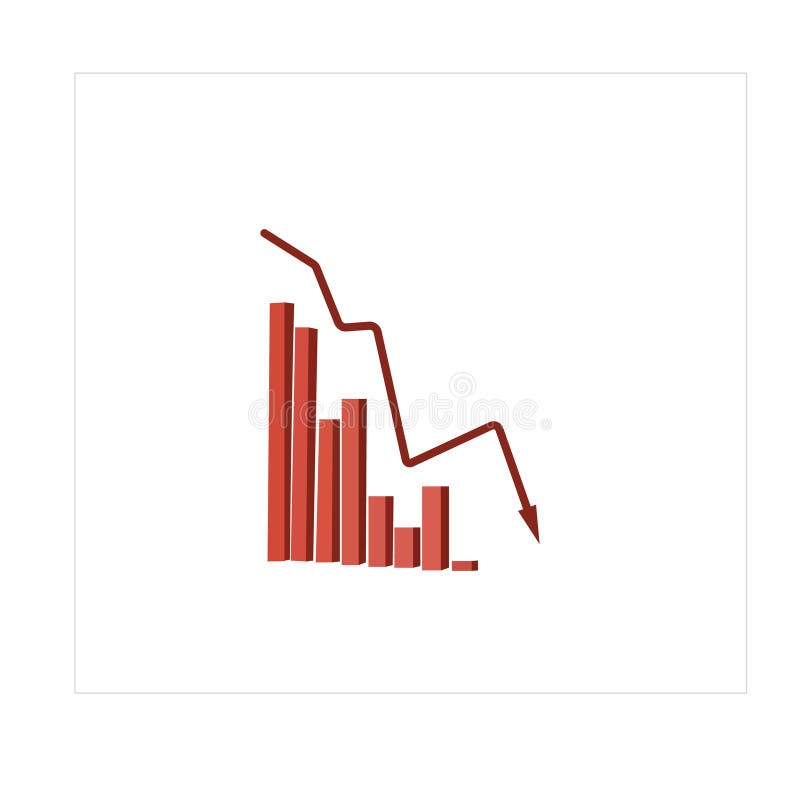
Free with trial A 3D bar graph showing a downward trend with a red arrow indicating a decline. Bar chart decrease illustrations Decreasing bar graph with downward trend. A 3D bar graph showing a downward trend with a red arrow indicating a decline
Free with trial A collection of five distinct black and white graphic representations of data. From left to right, the first is a line graph with dots, showing fluctuations. The second is a zig-zag line graph with dots and an upward arrow. The third is a series of ascending vertical bars. The fourth is a bar chart with a single dot above one of the bars. The fifth is a pie chart divided into four sections, with. Bar chart decrease vectors Collection of black and white business and data charts and graphs statistics analytics. A collection of five distinct black and white graphic representations of data. From left to right, the first is a line graph with dots, showing fluctuations. The second is a zig-zag line graph with dots and an upward arrow. The third is a series of ascending vertical bars. The fourth is a bar chart with a single dot above one of the bars. The fifth is a pie chart divided into four sections, with
Free with trial Rejection, negative feedback, failure, financial loss, poor performance, declining trends. Hand raised in stop gesture, sad face and declining bar graph. Rejection and negative feedback concept. Bar chart decrease illustrations Hand Gesture with Sad Face and Declining Bar Graph Rejection, Negative Trends, or Failure Concepts. Rejection, negative feedback, failure, financial loss, poor performance, declining trends. Hand raised in stop gesture, sad face and declining bar graph. Rejection and negative feedback concept
Free with trial Decline chart icon. Falling bars symbol. Downward trend illustration. Vector image. EPS 10. Bar chart decrease vectors Decline chart icon. Falling bars symbol. Downward trend illustration. Vector image.
Free with trial A 3D bar graph with bars of decreasing height, representing a downward trend. A prominent red arrow points downwards, signifying a decline or loss. The background is a subtle gradient. This visual effectively communicates concepts like financial crisis, economic recession, market crash, or business failure. Bar chart decrease illustrations Financial downturn illustrated by a declining bar graph and red arrow. A 3D bar graph with bars of decreasing height, representing a downward trend. A prominent red arrow points downwards, signifying a decline or loss. The background is a subtle gradient. This visual effectively communicates concepts like financial crisis, economic recession, market crash, or business failure
Free with trial Charts and Diagrams line icons. Social media: share, comment, like icons. Report, Block diagram, 3D Chart and Dot Plot graph linear icons. Trend, Pyramid and Pie chart report symbols. Vector. Bar chart decrease illustrations Charts and Diagrams line icons. Set of 3D Chart, Block diagram and Dot Plot graph icons. Social media icons. Vector. Charts and Diagrams line icons. Social media: share, comment, like icons. Report, Block diagram, 3D Chart and Dot Plot graph linear icons. Trend, Pyramid and Pie chart report symbols. Vector
Free with trial Business charts, data visualization, financial analysis, progress tracking, statistics, graphs, analysis, charts bar in line, orange. Bar chart decrease vectors Collection of diverse orange bar charts and line graph against a white background. Business charts, data visualization, financial analysis, progress tracking, statistics, graphs, analysis, charts bar in line, orange
Free with trial Isometric hand drawn illustration of an indian rupee coin next to a downward pointing arrow and declining bar chart on an alpha transparent background. Bar chart decrease vectors Hand drawn indian rupee coin and falling financial graph doodle alpha transparent. Isometric hand drawn illustration of an indian rupee coin next to a downward pointing arrow and declining bar chart on an alpha transparent background.
Free with trial Growth and decline chart icon in flat design. Business trend arrow symbol illustration. Profit and loss concept. Bar chart decrease vectors Growth and decline chart icon in flat design. Business trend arrow symbol. Profit and loss concept
Free with trial A magnifying glass highlights glowing red business growth chart on dark background. Bar chart decrease illustrations Magnifying glass highlights glowing red business growth chart on dark background
Free with trial A stark red arrow plunges downwards across a gray bar graph, symbolizing a significant financial or economic downturn. Bar chart decrease illustrations Red arrow shows steep decline on gray bar graph. A stark red arrow plunges downwards across a gray bar graph, symbolizing a significant financial or economic downturn
Free with trial A bar graph with a red downward arrow illustrates a decline in data over time. Bar chart decrease illustrations Decline in bar graph indicates downward trend. A bar graph with a red downward arrow illustrates a decline in data over time
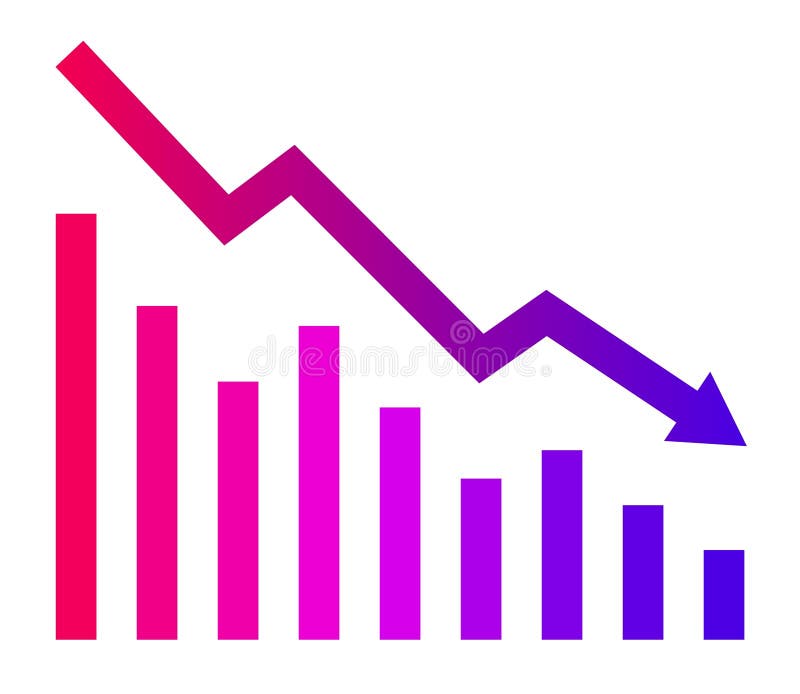
Free with trial A simple and clear illustration depicting a downward trend. The image features a bar graph with decreasing values, indicated by bars of different heights. A prominent red arrow points downwards, visually emphasizing the negative trend. This graphic is suitable for representing financial losses, declining sales, economic downturns, or any concept of decrease. The clean design and use of color make it easily understandable and versatile for various applications. Bar chart decrease vectors Downward Trend Chart with Red Arrow. A simple and clear illustration depicting a downward trend. The image features a bar graph with decreasing values, indicated by bars of different heights. A prominent red arrow points downwards, visually emphasizing the negative trend. This graphic is suitable for representing financial losses, declining sales, economic downturns, or any concept of decrease. The clean design and use of color make it easily understandable and versatile for various applications.
Free with trial A cartoon-style illustration of a bar graph displayed on a presentation screen. The graph shows three bars of different heights and colors (green, orange, and yellow), indicating growth or progress. The image is clean and simple, suitable for illustrating business, finance, or educational concepts in a visually appealing way. Bar chart decrease illustrations Cartoon Bar Graph Presentation. A cartoon-style illustration of a bar graph displayed on a presentation screen. The graph shows three bars of different heights and colors (green, orange, and yellow), indicating growth or progress. The image is clean and simple, suitable for illustrating business, finance, or educational concepts in a visually appealing way.
Free with trial A clean and modern isometric bar graph illustration. Three colored bars, blue, green, and yellow, represent data points with corresponding numerical values displayed above each bar. The graphic is set against a white background, making it suitable for various presentations, reports, or website designs related to data analysis, business, or education. The simple design offers a clear visual representation of data comparison. Bar chart decrease illustrations Isometric Bar Graph Illustrating Data and Statistics. A clean and modern isometric bar graph illustration. Three colored bars, blue, green, and yellow, represent data points with corresponding numerical values displayed above each bar. The graphic is set against a white background, making it suitable for various presentations, reports, or website designs related to data analysis, business, or education. The simple design offers a clear visual representation of data comparison.
Free with trial Graphic bar chart illustrating business data analysis, financial statistics, and market trends with both positive growth and negative decline on a clean white background. Bar chart decrease vectors Business financial graph showing increase and decrease. Graphic bar chart illustrating business data analysis, financial statistics, and market trends with both positive growth and negative decline on a clean white background
Free with trial A collection of nine flat vector icons for data visualization including bar graphs, line charts, pie charts, and performance meters isolated on a white background. Bar chart decrease vectors Simple black data analysis and business chart icon set. A collection of nine flat vector icons for data visualization including bar graphs, line charts, pie charts, and performance meters isolated on a white background
Free with trial Falling bar chart with downward arrow representing business decline and financial problems. Ideal for risk, loss, and economic downturn concepts. Bar chart decrease vectors Business decline chart downward trend problem failure vector silhouette illustration design. Falling bar chart with downward arrow representing business decline and financial problems. Ideal for risk, loss, and economic downturn concepts
Free with trial Declining business graph. Financial crisis chart. Negative market trend. Black and white economic vector icons. Bar chart decrease vectors Financial loss bar chart icon set with falling arrow and dollar sign for economic recession. Declining business graph. Financial crisis chart. Negative market trend. Black and white economic vector icons
Free with trial Declining business graph. Financial crisis chart. Negative market trend. Black and white economic vector icons. Bar chart decrease illustrations Financial loss bar chart icon set with falling arrow and dollar sign for economic recession. Declining business graph. Financial crisis chart. Negative market trend. Black and white economic vector icons.
Free with trial 3D rendering of a business infographic chart showing a progressive decline over four periods. Red color on the 3D bar graph chart with an arrow on it. Bar chart decrease illustrations 3D render of a business data in decline. 3D rendering of a business infographic chart showing a progressive decline over four periods. Red color on the 3D bar graph chart with an arrow on it.
Free with trial A 3D illustration of a financial chart showing a dramatic downward trend. A large red arrow points sharply down over a series of declining blue bar graphs, symbolizing a stock market crash, economic recession, or business failure. The background features complex data and grids, representing financial analysis and market data. This image is perfect for concepts related to economic crisis, investment loss, financial risk, bankruptcy, and negative business reports. Bar chart decrease illustrations Stock Market Crash Financial Graph. A 3D illustration of a financial chart showing a dramatic downward trend. A large red arrow points sharply down over a series of declining blue bar graphs, symbolizing a stock market crash, economic recession, or business failure. The background features complex data and grids, representing financial analysis and market data. This image is perfect for concepts related to economic crisis, investment loss, financial risk, bankruptcy, and negative business reports.
Free with trial A glowing red 3D coin with a downward arrow symbol, floating against a digital background featuring declining bar charts and bearish market indicators. The neon red lighting emphasizes loss, downturn, risk, volatility, and negative financial trends. Ideal for illustrating stock market crashes, crypto decline, recession concepts, falling prices, and economic downturn visuals. This image is Generated with the help of AI. Bar chart decrease illustrations Bearish red 3D coin with down arrow and falling market chart. A glowing red 3D coin with a downward arrow symbol, floating against a digital background featuring declining bar charts and bearish market indicators. The neon red lighting emphasizes loss, downturn, risk, volatility, and negative financial trends. Ideal for illustrating stock market crashes, crypto decline, recession concepts, falling prices, and economic downturn visuals. This image is Generated with the help of AI.
Free with trial A 3D cartoon illustration depicts a stylized hand with a black suit cuff pointing a finger downwards towards a red bar graph. The graph shows a clear downward trend with bars decreasing in height from left to right, colored green, yellow, orange, and red. A red arrow reinforces the concept of decline. The image is set against a white background. Bar chart decrease illustrations 3D Cartoon Hand Pointing Down at a Declining Bar Graph on White Background business. A 3D cartoon illustration depicts a stylized hand with a black suit cuff pointing a finger downwards towards a red bar graph. The graph shows a clear downward trend with bars decreasing in height from left to right, colored green, yellow, orange, and red. A red arrow reinforces the concept of decline. The image is set against a white background
Free with trial Decreasing graph line icon. Neumorphic, Flat shadow, 3d buttons. Column chart sign. Crisis diagram symbol. Line decreasing graph icon. Social media icons. Vector. Bar chart decrease vectors Decreasing graph line icon. Crisis chart sign. Neumorphic buttons. Vector. Decreasing graph line icon. Neumorphic, Flat shadow, 3d buttons. Column chart sign. Crisis diagram symbol. Line decreasing graph icon. Social media icons. Vector
Free with trial A downward trending bar graph with a question mark is examined under a magnifying glass, symbolizing uncertainty and. Bar chart decrease illustrations Decreasing Chart Under Magnifying Glass with Question Mark. A downward trending bar graph with a question mark is examined under a magnifying glass, symbolizing uncertainty and.
Free with trial A 3D cartoon illustration depicts a stylized hand in a black suit jacket and white shirt cuff pointing its index finger downwards towards a red bar graph. The bar graph features several vertical bars of varying heights and colors, including green, yellow, orange, and red, arranged in a descending order from left to right, visually representing a decline. The entire graphic is presented on a clean. Bar chart decrease illustrations 3D Cartoon Hand Pointing Down at Declining Bar Graph on White Background image photo. A 3D cartoon illustration depicts a stylized hand in a black suit jacket and white shirt cuff pointing its index finger downwards towards a red bar graph. The bar graph features several vertical bars of varying heights and colors, including green, yellow, orange, and red, arranged in a descending order from left to right, visually representing a decline. The entire graphic is presented on a clean
Free with trial A simple and bold icon illustration of a bar graph. This can be used to represent data, statistics, growth, or trends. The icon is designed in a clean and minimalist style, making it versatile for various applications. Bar chart decrease vectors Simple Bold Bar Graph Sign Shape Icon for Data Presentation. A simple and bold icon illustration of a bar graph. This can be used to represent data, statistics, growth, or trends. The icon is designed in a clean and minimalist style, making it versatile for various applications.
Free with trial This image depicts a combination of line and bar graphs showing comparative data analysis over a period of time. Bar chart decrease illustrations Comparative data analysis over time with line and bar graphs. This image depicts a combination of line and bar graphs showing comparative data analysis over a period of time
Free with trial This image features a 3D bar graph with a downward trend isolated on a white background. The graph consists of green bars that decrease in height from left to right, with a red arrow pointing downward to emphasize the declining trend. The image is clean and visually appealing, suitable for business and financial contexts. Bar chart decrease illustrations 3d bar graph with downward trend isolated on white background. This image features a 3D bar graph with a downward trend isolated on a white background. The graph consists of green bars that decrease in height from left to right, with a red arrow pointing downward to emphasize the declining trend. The image is clean and visually appealing, suitable for business and financial contexts
Free with trial A dollar bill connected to a bar graph resembling a sound wave with an arrow. Clear details and vibrant colors. Bar chart decrease illustrations Dollar Bill and Sound Wave Bar Graph with Arrow money finance. A dollar bill connected to a bar graph resembling a sound wave with an arrow. Clear details and vibrant colors
Free with trial Two blue bar graphs are depicted against a white background. The left graph bars increasing in height with an upward curving arrow, indicating growth. The right graph bars decreasing in height. Bar chart decrease vectors Blue bar graphs showing upward and downward trends with arrows. Two blue bar graphs are depicted against a white background. The left graph bars increasing in height with an upward curving arrow, indicating growth. The right graph bars decreasing in height
Free with trial A 3D rendered icon depicting a blue document with a raised bar graph. The bar graph features alternating blue, orange, and yellow bars of varying heights. White lines and a circular orange and white element are also present on the blue document surface. The icon is isolated on a white background. Bar chart decrease vectors 3 D blue document icon with orange and blue bar graph and white lines image. A 3D rendered icon depicting a blue document with a raised bar graph. The bar graph features alternating blue, orange, and yellow bars of varying heights. White lines and a circular orange and white element are also present on the blue document surface. The icon is isolated on a white background
Free with trial This image depicts a bar graph on an easel showing a clear downward trend. The bars are blue, and a large red arrow points downward, indicating a decline. Bar chart decrease illustrations Decline in data represented by a descending bar graph on an easel. This image depicts a bar graph on an easel showing a clear downward trend. The bars are blue, and a large red arrow points downward, indicating a decline
Free with trial This image features an abstract illustration of a bar graph against a dark gray background. The graph consists of three vertical bars of varying heights, each with horizontal rectangles inside. The bars are shades of white and gray, creating a minimalist and modern design. This image can be used to represent data, growth, statistics, or business performance in a visually appealing manner. Bar chart decrease vectors Abstract Bar Graph Illustration. This image features an abstract illustration of a bar graph against a dark gray background. The graph consists of three vertical bars of varying heights, each with horizontal rectangles inside. The bars are shades of white and gray, creating a minimalist and modern design. This image can be used to represent data, growth, statistics, or business performance in a visually appealing manner.
Free with trial 3d blue magnifying glass with downward-trending chart inside Financial analysis, economic decline, risk assessment, market monitoring, investment evaluation concept Low poly digital futuristic Vector. Bar chart decrease vectors 3d blue magnifying glass with downward-trending chart inside Financial analysis, economic decline, risk assessment
Free with trial A flat depicting two distinct financial charts against a white background. The left chart a bar graph with bars in shades of green and blue, topped by a jagged blue line graph ascending towards a green percentage symbol and an upward arrow. The right chart a bar graph with bars in yellow, orange, and red, with a red line graph descending from a yellow dollar sign. Bar chart decrease illustrations Upward and downward financial charts with percentage and dollar symbols. A flat depicting two distinct financial charts against a white background. The left chart a bar graph with bars in shades of green and blue, topped by a jagged blue line graph ascending towards a green percentage symbol and an upward arrow. The right chart a bar graph with bars in yellow, orange, and red, with a red line graph descending from a yellow dollar sign
Free with trial Pink Financial growth decrease icon isolated on pink background. Increasing revenue. Minimalism concept. 3D render illustration. Bar chart decrease illustrations Pink Financial growth decrease icon isolated on pink background. Increasing revenue. Minimalism concept. 3D render
Free with trial Two bar graphs, one green showing growth and one red showing decline, with trend lines indicating opposite directions. Bar chart decrease illustrations Bar graphs showing upward and downward trends. Two bar graphs, one green showing growth and one red showing decline, with trend lines indicating opposite directions
Free with trial A magnifying glass focuses on a declining bar graph and a file folder, symbolizing a decrease in sales and the need for. Bar chart decrease illustrations Declining Sales Analysis Magnifying Glass, Downward Graph. A magnifying glass focuses on a declining bar graph and a file folder, symbolizing a decrease in sales and the need for.
Free with trial Gold price going down decrease cheaper in golden metal commodity market international trading market vector. Bar chart decrease illustrations Gold price going down decrease cheaper in golden metal commodity market international trading market
Free with trial Two sets of simple flat design charts showing bar graphs with line graphs and three-segment pie charts in red, green, and blue. Bar chart decrease vectors Two bar charts with line graphs and two pie charts data visualization statistics. Two sets of simple flat design charts showing bar graphs with line graphs and three-segment pie charts in red, green, and blue
Free with trial A bar graph showing a downward trend with a red arrow indicating a decline. Bar chart decrease illustrations Decreasing bar graph with downward arrow isolated on white background. A bar graph showing a downward trend with a red arrow indicating a decline
Free with trial Three black rectangular bars of decreasing height arranged horizontally on a white background. Bar chart decrease illustrations Three Descending Black Bar Chart Blocks on White Background graph data. Three black rectangular bars of decreasing height arranged horizontally on a white background
Free with trial Graph with decrease report. Business and finance vector illustration. Diagram with recession and bankruptcy progress. Bar chart decrease vectors Graph with decrease report. Business and finance vector illustration. Diagram with recession and bankruptcy
Free with trial A close-up view of black financial and business chart icons arranged in a grid on a light background. Bar chart decrease illustrations Close-up of financial and business chart icons on a grid finance charts. A close-up view of black financial and business chart icons arranged in a grid on a light background
Free with trial Displaying dashboard grid showing fluctuating blue and red line graphs with metallic green sphere. Analytics, investment, data visualization, technology, finance, bar chart, dashboard. Bar chart decrease illustrations Displaying dashboard grid showing fluctuating blue and red line graphs with metallic green sphere
Free with trial Basic charts line icon set. Bar diagram, pie and histogram graph. Data visualization, growth and distribution analysis for business and finance. Vector illustration Editable Stroke. Bar chart decrease illustrations Basic charts line icon set. Bar diagram, pie and histogram graph. Data visualization, growth and distribution analysis
Free with trial A visual representation of declining performance, with red bars and a descending line graph on a white background. Bar chart decrease illustrations Red bar chart showing downward trend and line graph. A visual representation of declining performance, with red bars and a descending line graph on a white background.
Free with trial Three black bars with downward arrows indicating decline on white background Clear details and vibrant colors. Bar chart decrease illustrations Three black bars with downward arrows on white background bar chart graph. Three black bars with downward arrows indicating decline on white background Clear details and vibrant colors
Free with trial A vibrant and modern illustration of a bar graph, featuring four bars of varying heights and colors: blue, green, orange, and red. The bars are positioned on a gray horizontal line, creating a sense of data comparison and visual hierarchy. This image is ideal for representing data, statistics, business reports, financial analysis, or any concept requiring visual data representation. The clean design and bright colors make it suitable for presentations, websites, and marketing materials. Bar chart decrease illustrations Colorful Bar Graph Illustration. A vibrant and modern illustration of a bar graph, featuring four bars of varying heights and colors: blue, green, orange, and red. The bars are positioned on a gray horizontal line, creating a sense of data comparison and visual hierarchy. This image is ideal for representing data, statistics, business reports, financial analysis, or any concept requiring visual data representation. The clean design and bright colors make it suitable for presentations, websites, and marketing materials.
Free with trial A visual representation of a business or financial metric showing a significant decline, depicted by a series of blue bars and a descending red arrow. Bar chart decrease illustrations Bar chart with red arrow indicating a downward trend. A visual representation of a business or financial metric showing a significant decline, depicted by a series of blue bars and a descending red arrow
Free with trial Abstract 3D render of a financial growth chart. The image features a series of vertical bars, some in teal and others in orange, representing data points on a graph. The bars increase in height towards the right, suggesting positive growth or progress. The chart is set against a dark background with a subtle grid pattern and a reflective surface, adding depth and visual interest. Suitable for illustrating financial reports, market analysis, or business trends. Bar chart decrease illustrations Abstract Financial Growth Chart. Abstract 3D render of a financial growth chart. The image features a series of vertical bars, some in teal and others in orange, representing data points on a graph. The bars increase in height towards the right, suggesting positive growth or progress. The chart is set against a dark background with a subtle grid pattern and a reflective surface, adding depth and visual interest. Suitable for illustrating financial reports, market analysis, or business trends.
Free with trial A blue bar and line graph showing upward financial trends against a backdrop of a world map, symbolizing global economic growth and market expansion. Bar chart decrease illustrations Global business growth chart with world map background. A blue bar and line graph showing upward financial trends against a backdrop of a world map, symbolizing global economic growth and market expansion
Free with trial Economy downturn concept showing declining bar graph with red arrow, background,. Bar chart decrease illustrations Economy downturn concept showing declining bar graph with red arrow, background
Free with trial Ai-Generated. Professional chart stock image featuring set of black and white minimalist chart and graph line icons. Bar chart decrease vectors Set of black and white minimalist chart and graph line icons
Free with trial Data Stats Board Display Line Icon Downward Down Trend Statistic Performance Market Decline Economy Downturn Bar Graph Progress Outline Presentation. Bar chart decrease vectors Data Stats Board Display Line Icon Downward Down Trend Statistic Performance Market Decline Economy Downturn Bar Graph
Free with trial A black bar graph icon with a downward arrow and trend line indicates a decline. Clear details and vibrant col. Bar chart decrease illustrations Black Bar Graph Icon with Downward Arrow and Trend Line on White Background data. A black bar graph icon with a downward arrow and trend line indicates a decline. Clear details and vibrant col
Free with trial Black bars decreasing in height diagonally on a white background, representing a downward trend or decline. Bar chart decrease illustrations Black bars decreasing in height diagonally on a white background bar chart graph. Black bars decreasing in height diagonally on a white background, representing a downward trend or decline