Free with trial Statistics line icon. Neumorphic, Blue gradient, 3d pin buttons. Column chart sign. Growth graph diagram symbol. Line icons. Neumorphic buttons with outline signs. Vector. Bar chart decrease vectors Statistics line icon. Column graph chart sign. Line icons. Vector. Statistics line icon. Neumorphic, Blue gradient, 3d pin buttons. Column chart sign. Growth graph diagram symbol. Line icons. Neumorphic buttons with outline signs. Vector
Free with trial Curved growth and decline chart icon in flat design. Business trend arrow symbol illustration. Bar chart decrease vectors Curved growth and decline chart icon in flat design. Business trend arrow symbol
Free with trial Abstract vector illustration of colorful bar graphs for business analysis and trends. Bar chart decrease vectors Multiple colorful bar charts abstractly representing data and statistics. Abstract vector illustration of colorful bar graphs for business analysis and trends.
Free with trial An illustration depicts a downturn in business. Decreasing bar chart represented in blue, yellow and red. A black arrow points downwards showing negative growth, placed over a bright white background. Bar chart decrease illustrations Falling Chart with a Decreasing Arrow on a White Background. An illustration depicts a downturn in business. Decreasing bar chart represented in blue, yellow and red. A black arrow points downwards showing negative growth, placed over a bright white background.
Free with trial Infographic, chart icon with arrow. Vector illustration. EPS 10. Stock image. Bar chart decrease vectors Infographic, chart icon with arrow. Vector illustration. EPS 10.
Free with trial Data analytics icons set in duotone outline stroke design for web. Pack pictograms of search, mining, filter, pie chart, presentation, mind map, database, discover, flow, other. Vector illustration. Bar chart decrease illustrations Data analytics icons set in duotone outline stroke design for web. Pack pictograms of search, mining, filter, pie chart
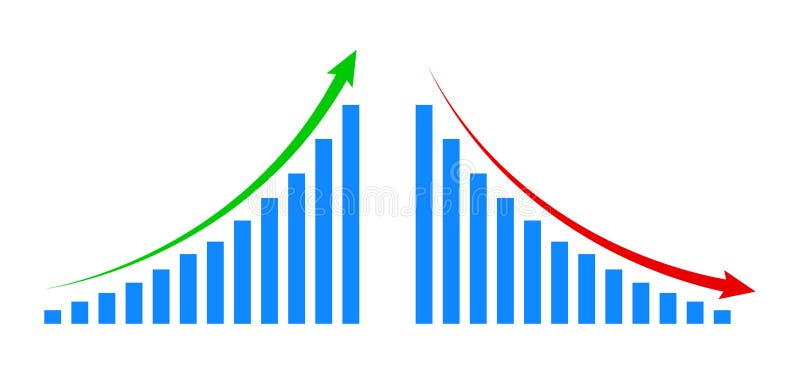
Free with trial Two bar charts are displayed side by side. One shows a clear upward trend with a green arrow, while the other shows a downward trend with a red arrow. Bar chart decrease illustrations Bar charts showing contrasting upward and downward trends. Two bar charts are displayed side by side. One shows a clear upward trend with a green arrow, while the other shows a downward trend with a red arrow
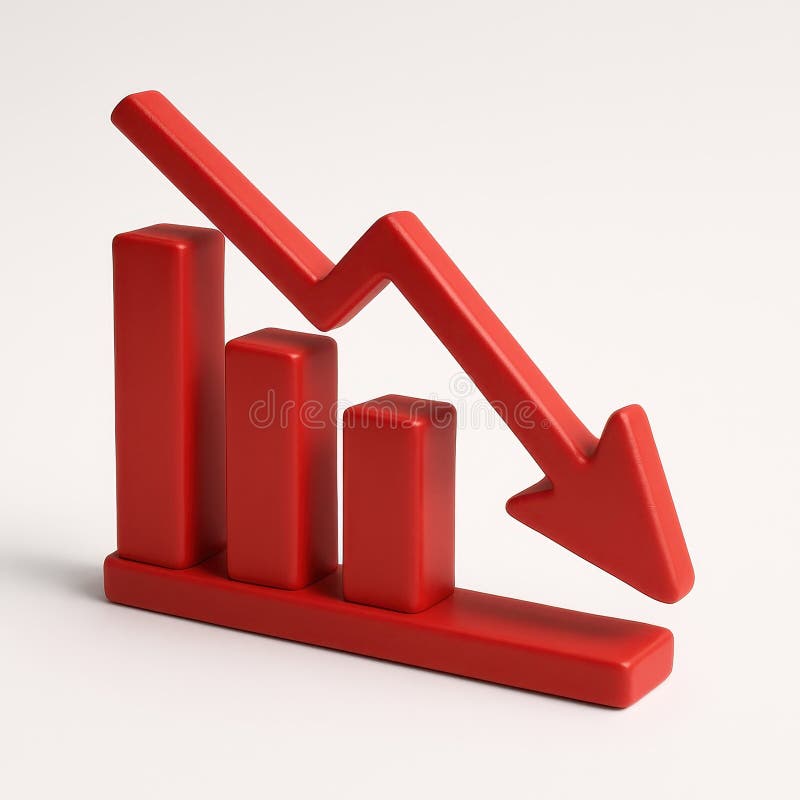
Free with trial This 3D rendering shows a bar graph with a sharp downward trend, symbolized by a large red arrow. The graph visually represents a significant decline or decrease in a particular metric. The dark red bars and bright red arrow create a strong visual impact. Bar chart decrease illustrations Declining Bar Graph. This 3D rendering shows a bar graph with a sharp downward trend, symbolized by a large red arrow. The graph visually represents a significant decline or decrease in a particular metric. The dark red bars and bright red arrow create a strong visual impact.
Free with trial A simple graphic showing various data representation methods including bar, line, and pie charts in a monochrome style. Bar chart decrease vectors Black and White Data Visualization Charts Bar Graph, Line Graph, and Pie Charts. A simple graphic showing various data representation methods including bar, line, and pie charts in a monochrome style
Free with trial Two bar charts, one green showing growth and one red showing decline, with trend lines and arrows. Bar chart decrease illustrations Bar charts showing upward and downward trends. Two bar charts, one green showing growth and one red showing decline, with trend lines and arrows
Free with trial Business bar graph with upward and downward arrow. Trend up and down icon vector in black circle. Bar chart decrease vectors Business bar graph with upward and downward arrow. Trend up and down icon in black circle
Free with trial Open laptop showing line chart, bar chart, and trend analysis with arrow indicating sales decline. Ideal for analytics, e-commerce, business strategy, financial forecasting, market analysis, sales. Bar chart decrease vectors Laptop screen displaying charts, analytics, and sale trend with downward arrow. Open laptop showing line chart, bar chart, and trend analysis with arrow indicating sales decline. Ideal for analytics, e-commerce, business strategy, financial forecasting, market analysis, sales
Free with trial A grid of black icons representing various types of graphs and charts, including bar graphs and line graphs with upward arrows, on a white background. Bar chart decrease vectors Collection of Ai-Generated black and white graph and chart icons. A grid of black icons representing various types of graphs and charts, including bar graphs and line graphs with upward arrows, on a white background
Free with trial Red bar graph decreasing with blue arrow representing a loss in business, sales, jobs, or other financial loss. Bar chart decrease vectors Red bar graph decreasing with blue arrow representing a loss in business
Free with trial Declining red bar graph shown with a falling red arrow directed towards a grey building against a bright white background, symbolizing financial loss or economic downturn for business concepts. Bar chart decrease illustrations Falling Red Bar Graph with Grey Building on White Background. Declining red bar graph shown with a falling red arrow directed towards a grey building against a bright white background, symbolizing financial loss or economic downturn for business concepts
Free with trial Analytics graph line icon. Halftone dotted pattern. Gradient icon with grain shadow. Column chart sign. Growth diagram symbol. Line analytics graph icon. Various designs. Vector. Bar chart decrease vectors Analytics graph line icon. Column chart sign. Halftone dotted pattern. Vector. Analytics graph line icon. Halftone dotted pattern. Gradient icon with grain shadow. Column chart sign. Growth diagram symbol. Line analytics graph icon. Various designs. Vector
Free with trial Growth and declining graph bar icon with flat rounded cartoon style. Charts with bar growth and declining. Graph trending upwards arrow and downwards arrow. Eps 10 vector illustration. Bar chart decrease vectors Growth and declining graph bar icon with flat rounded cartoon style
Free with trial This dynamic 3D render visualizes financial growth and market trends. A series of green bars represents increasing values, overlaid by a prominent green arrow pointing upwards, symbolizing success and positive performance. Contrasting this, a red arrow also indicates a trend, though its path suggests volatility or a different metric. Below, a complex network graph with interconnected nodes and lines adds a layer of data analysis and interconnectedness, suitable for concepts like investment, analytics, and economic forecasting. Bar chart decrease illustrations Upward Trend: Green and Red Arrows Over Bar Chart and Network Graph. This dynamic 3D render visualizes financial growth and market trends. A series of green bars represents increasing values, overlaid by a prominent green arrow pointing upwards, symbolizing success and positive performance. Contrasting this, a red arrow also indicates a trend, though its path suggests volatility or a different metric. Below, a complex network graph with interconnected nodes and lines adds a layer of data analysis and interconnectedness, suitable for concepts like investment, analytics, and economic forecasting.
Free with trial Colorful bar graph showing market analysis, financial report and accounting on a digital tablet. Generative AI. Bar chart decrease illustrations Colorful bar graph showing market analysis and financial report. Colorful bar graph showing market analysis, financial report and accounting on a digital tablet. Generative AI
Free with trial Bitcoin chart icons set outline vector. Benefit fintech. Cash coin neon color on black. Bar chart decrease vectors Bitcoin chart icons set vector neon. Bitcoin chart icons set outline vector. Benefit fintech. Cash coin neon color on black
Free with trial A visual representation of negative financial performance, illustrating a declining trend in business or market data with a prominent red arrow indicating a downward movement. Bar chart decrease illustrations Bar chart showing a downward trend with a red arrow. A visual representation of negative financial performance, illustrating a declining trend in business or market data with a prominent red arrow indicating a downward movement
Free with trial Declining bar chart with bold red fake label above a minimal cloud. Ideal for misinformation, fraud, analysis, skepticism, distrust, validation, critical thinking. Simple flat metaphor. Bar chart decrease vectors Data Misrepresentation Concept with Declining Graph and Fake Label in Simple Style. Declining bar chart with bold red fake label above a minimal cloud. Ideal for misinformation, fraud, analysis, skepticism, distrust, validation, critical thinking. Simple flat metaphor
Free with trial 3D rendering of declining bar and line graphs over a grid background. Bar chart decrease illustrations 3D rendering of declining bar and line graphs over a grid background.
Free with trial Economy business crisis and graph investment down on red background. arrow trading chart candlestick fall. vector illustration fantastic technology. Bar chart decrease vectors Economy business crisis and graph investment down on red background. arrow trading chart candlestick fall.
Free with trial This graphic depicts data insights through a visually appealing bar chart connected by flowing lines, symbolizing the interconnectedness of data points and the flow of information. The varying heights of the bars represent different data values, showcasing growth or trends. The design is clean and. Bar chart decrease illustrations Data Insights Visualization. This graphic depicts data insights through a visually appealing bar chart connected by flowing lines, symbolizing the interconnectedness of data points and the flow of information. The varying heights of the bars represent different data values, showcasing growth or trends. The design is clean and
Free with trial Graph line icons. Interest rate, AI generate, Inflation icons. Set of Chart presentation, Report, Increase growth graph icons. Analytics testing, Falling demand, Pie chart report. Vector. Bar chart decrease vectors Graph line icons. Set of Chart presentation, Report and Increase growth graph icons. App line icons. Vector. Graph line icons. Interest rate, AI generate, Inflation icons. Set of Chart presentation, Report, Increase growth graph icons. Analytics testing, Falling demand, Pie chart report. Vector
Free with trial A striking 3D render visualizes economic decline with a vibrant red bar graph against a clean white background. This impactful image vividly represents a financial crisis and recession, showcasing a clear downward trend through its falling bars and an implied arrow. It symbolizes loss, failure, and potential bankruptcy within the business and finance sectors. Ideal for illustrating articles on the. Bar chart decrease illustrations Red economic decline bar graph depicting financial downfall and negative trends on white background. A striking 3D render visualizes economic decline with a vibrant red bar graph against a clean white background. This impactful image vividly represents a financial crisis and recession, showcasing a clear downward trend through its falling bars and an implied arrow. It symbolizes loss, failure, and potential bankruptcy within the business and finance sectors. Ideal for illustrating articles on the
Free with trial Falling bar graph with a red arrow indicating decline and a rising scale. Bar chart decrease vectors Falling bar graph with a red arrow indicating decline and a rising scale
Free with trial Simple bar graph showing downward trend with arrow, decline in progress. Bar chart decrease vectors Simple bar graph showing downward trend with arrow, decline in progress
Free with trial Bar graph and line chart showing performance decline, icons of person and movement, and a sad face symbol. Ideal for data trends, business analysis, failure, mood, feedback, decision-making. Bar chart decrease illustrations Declining Trends in Data Analysis with Emotional Impact Represented by Sad Face Icon. Bar graph and line chart showing performance decline, icons of person and movement, and a sad face symbol. Ideal for data trends, business analysis, failure, mood, feedback, decision-making
Free with trial A collection of icons Decrease report, progress report, Upward report, Downward report, Profit increase, Profit decrease, icon. Bar chart decrease vectors Decrease report, progress report, Upward report, Downward report, Profit increase, Profit decrease, icon
Free with trial Downward Chart Showing Decline with Decreasing Bars and Falling Arrow. Bar chart decrease vectors Downward Chart Showing Decline with Decreasing Bars and Falling Arrow
Free with trial Sketchy bar graph illustration of financial decline and economic loss. Bar chart decrease vectors Sketchy bar graph illustration of financial decline and economic loss
Free with trial Downward trending chart with a declining arrow in vector illustration. Bar chart decrease vectors Downward trending chart with a declining arrow in vector illustration
Free with trial Graph chart showing growth and analysis with bright background ,Generative ai. Bar chart decrease illustrations Bright background graph chart, growth analysis and data visualization. Graph chart showing growth and analysis with bright background ,Generative ai
Free with trial Growth and decline graph report icon. Financial chart arrow up and down sign symbol illustration. Bar chart decrease vectors Growth and decline graph report icon. Financial chart arrow up and down sign symbol
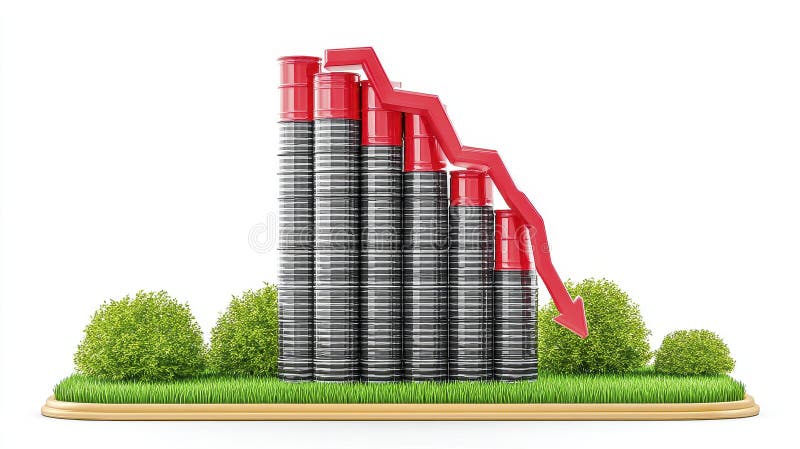
Free with trial 3D rendering of a bar graph showing a decline in production, represented by black and red cylinders on a grassy surface. The downward trend is emphasized by a red arrow AI generative. Bar chart decrease illustrations Declining Production 3D Render of Bar Graph Showing a Downward Trend. 3D rendering of a bar graph showing a decline in production, represented by black and red cylinders on a grassy surface. The downward trend is emphasized by a red arrow AI generative
Free with trial Decrease vector icon on the white background. EPS 10. Bar chart decrease vectors Decrease thin line vector icon set. Decrease vector icon on the white background. EPS 10
Free with trial Decrease vector icon on the white background. EPS 10. Bar chart decrease vectors Decrease thin line vector icon set. Decrease vector icon on the white background. EPS 10
Free with trial Graph going Up and Down sign with green and red arrows. graph increase, decrease sign design. Bar chart decrease vectors Graph going Up and Down sign with green and red arrows. graph increase, decrease sign
Free with trial Decrease vector icon on the white background. EPS 10. Bar chart decrease vectors Decrease thin line vector icon set. Decrease vector icon on the white background. EPS 10
Free with trial Decrease vector icon on the white background. EPS 10. Bar chart decrease vectors Decrease thin line vector icon set. Decrease vector icon on the white background. EPS 10
Free with trial Decrease vector icon on the white background. EPS 10. Bar chart decrease vectors Decrease thin line vector icon set. Decrease vector icon on the white background. EPS 10
Free with trial Decrease vector icon on the white background. EPS 10. Bar chart decrease vectors Decrease thin line vector icon set. Decrease vector icon on the white background. EPS 10
Free with trial Decrease vector icon on the white background. EPS 10. Bar chart decrease vectors Decrease thin line vector icon set. Decrease vector icon on the white background. EPS 10
Free with trial Decrease vector icon on the white background. EPS 10. Bar chart decrease vectors Decrease thin line vector icon set. Decrease vector icon on the white background. EPS 10
Free with trial Decrease vector icon on the white background. EPS 10. Bar chart decrease vectors Decrease thin line vector icon set. Decrease vector icon on the white background. EPS 10
Free with trial Decrease vector icon on the white background. EPS 10. Bar chart decrease vectors Decrease thin line vector icon set. Decrease vector icon on the white background. EPS 10
Free with trial Decrease vector icon on the white background. EPS 10. Bar chart decrease vectors Decrease thin line vector icon set. Decrease vector icon on the white background. EPS 10
Free with trial Decrease vector icon on the white background. EPS 10. Bar chart decrease vectors Decrease thin line vector icon set. Decrease vector icon on the white background. EPS 10
Free with trial A 3D rendering depicts a large red arrow pointing sharply downward, superimposed on a bar graph. The graph's bars are alternating gray and white, creating a textured pattern. The graph is positioned against a blurred backdrop of modern city skyscrapers. The overall color palette is cool, with the red arrow providing a stark contrast. The image suggests a negative economic trend or market decline. , generated by AI. Bar chart decrease illustrations Red Downward Trend Arrow on Gray White Bar Graph Cityscape Background. A 3D rendering depicts a large red arrow pointing sharply downward, superimposed on a bar graph. The graph's bars are alternating gray and white, creating a textured pattern. The graph is positioned against a blurred backdrop of modern city skyscrapers. The overall color palette is cool, with the red arrow providing a stark contrast. The image suggests a negative economic trend or market decline., generated by AI.
Free with trial Vector illustration of decreasing bar graph with arrow, financial concept. Bar chart decrease vectors Vector illustration of decreasing bar graph with arrow, financial concept
Free with trial Illustrating market decline and data analysis with modern visual elements. Bar chart decrease vectors Red arrow downtrend graph and bar chart in digital and tech theme. Illustrating market decline and data analysis with modern visual elements.
Free with trial Illustrating market decline and data analysis with modern visual elements. Bar chart decrease vectors Red arrow downtrend graph and bar chart in digital and tech theme. Illustrating market decline and data analysis with modern visual elements.
Free with trial Graph line icon. Neumorphic, Orange gradient, 3d pin buttons. Column chart sign. Ab test diagram symbol. Line icons. Neumorphic buttons with outline signs. Vector. Bar chart decrease vectors Graph line icon. Column chart sign. Line icons. Vector. Graph line icon. Neumorphic, Orange gradient, 3d pin buttons. Column chart sign. Ab test diagram symbol. Line icons. Neumorphic buttons with outline signs. Vector
Free with trial Graph line icon. Neumorphic, Blue gradient, 3d pin buttons. Column chart sign. Growth diagram symbol. Line icons. Neumorphic buttons with outline signs. Vector. Bar chart decrease vectors Graph line icon. Column chart sign. Line icons. Vector. Graph line icon. Neumorphic, Blue gradient, 3d pin buttons. Column chart sign. Growth diagram symbol. Line icons. Neumorphic buttons with outline signs. Vector
Free with trial Decrease vector icon on the white background. EPS 10. Bar chart decrease vectors Decrease thin line vector icon set. Decrease vector icon on the white background. EPS 10
Free with trial Decrease vector icon on the white background. EPS 10. Bar chart decrease vectors Decrease thin line vector icon set. Decrease vector icon on the white background. EPS 10
Free with trial Charts and Diagrams line icons. Interest rate, AI generate, Inflation icons. Report, 3D Chart, Block diagram and Dot Plot graph linear icons. Trend, Pyramid and Pie chart report symbols. Vector. Bar chart decrease vectors Charts and Diagrams line icons. Set of 3D Chart, Block diagram and Dot Plot graph icons. App line icons. Vector. Charts and Diagrams line icons. Interest rate, AI generate, Inflation icons. Report, 3D Chart, Block diagram and Dot Plot graph linear icons. Trend, Pyramid and Pie chart report symbols. Vector
Free with trial Statistics line icon. Continuous line with share plane. Column chart sign. Growth graph diagram symbol. 3d star in speech bubble. Graph chart single line ribbon. Loop curve pattern. Vector. Bar chart decrease illustrations Statistics line icon. Column graph chart sign. Continuous line with plane. Vector. Statistics line icon. Continuous line with share plane. Column chart sign. Growth graph diagram symbol. 3d star in speech bubble. Graph chart single line ribbon. Loop curve pattern. Vector
Free with trial Statistics line icon. Continuous line with share plane. Column chart sign. Growth graph diagram symbol. 3d star in speech bubble. Graph chart single line ribbon. Loop curve pattern. Vector. Bar chart decrease illustrations Statistics line icon. Column graph chart sign. Continuous line with plane. Vector. Statistics line icon. Continuous line with share plane. Column chart sign. Growth graph diagram symbol. 3d star in speech bubble. Graph chart single line ribbon. Loop curve pattern. Vector
Free with trial This 3D rendering shows vibrant bar and pie charts illustrating business growth, data analysis, and statistical visualization. Perfect for presentations, reports, or marketing materials. Bar chart decrease illustrations Colorful 3D Bar and Pie Charts Representing Business Growth and Data Analysis. This 3D rendering shows vibrant bar and pie charts illustrating business growth, data analysis, and statistical visualization. Perfect for presentations, reports, or marketing materials.
Free with trial Abstract 3D bar graph with red and teal bars on a white background. Illustrates data visualization and financial concepts. Bar chart decrease illustrations Abstract 3D Bar Graph Red and Teal Data Visualization on White. Abstract 3D bar graph with red and teal bars on a white background. Illustrates data visualization and financial concepts
Free with trial A hand uses a stylus to draw a glowing bar graph. The graph illustrates increasing income and decreasing expenses, symbolizing financial management and growth. Bar chart decrease illustrations Hand drawing a financial graph showing income growth and expense decrease. A hand uses a stylus to draw a glowing bar graph. The graph illustrates increasing income and decreasing expenses, symbolizing financial management and growth
Free with trial Declining Bar Graph with Red Arrow Down and Sad Emoji, Financial Loss Symbol. Bar chart decrease vectors Declining Bar Graph with Red Arrow Down and Sad Emoji, Financial Loss Symbol
Free with trial Growth and decline. Business chart icon. Profit loss symbol. Vector illustration. EPS 10. Bar chart decrease vectors Growth and decline. Business chart icon. Profit loss symbol. Vector illustration.
Free with trial Prohibition sign with declining bar chart and people icons. No decline concept. EPS 10. Bar chart decrease vectors Prohibition sign with declining bar chart and people icons. No decline concept.
Free with trial Glowing red financial chart with percentage symbols, stock market decline concept. Bar chart decrease illustrations Glowing red financial chart with percentage symbols, stock market decline concept
Free with trial Uptrend and downtrend business chart icon. Economic growth and decline symbol with green up and red down arrow vector. Bar chart decrease vectors Uptrend and downtrend business chart icon. Economic growth and decline symbol with green up and red down arrow
Free with trial CO2 inside cloud shape with blue downward arrows indicating reduction, next to bar chart and small cloud. Ideal for sustainability, environment, data, carbon reduction, climate change, eco-friendly. Bar chart decrease vectors Reducing Carbon Emissions with Data Analysis Highlighted by Cloud Imagery and Downward Arrows. CO2 inside cloud shape with blue downward arrows indicating reduction, next to bar chart and small cloud. Ideal for sustainability, environment, data, carbon reduction, climate change, eco-friendly
Free with trial Hand drawn bar graph showing a downward trend with an arrow indicating decline. Bar chart decrease vectors Hand drawn bar graph showing a downward trend with an arrow indicating decline
Free with trial A 3d stylized financial chart displays a downward red arrow over blue and orange bars. Two gold coins with dollar signs flank the chart. Bar chart decrease illustrations 3d stylized financial chart with downward red arrow and gold coins illustration. A 3d stylized financial chart displays a downward red arrow over blue and orange bars. Two gold coins with dollar signs flank the chart
Free with trial Bar graph with downward trend, arrows indicating loss, and coins falling. Ideal for finance, economics, business, investment, budgeting revenue loss and decline concepts. Simple flat metaphor. Bar chart decrease illustrations Revenue Decline Illustration with Bar Graph, Arrows, and Falling Coins Symbolizing Financial Loss. Bar graph with downward trend, arrows indicating loss, and. Bar graph with downward trend, arrows indicating loss, and coins falling. Ideal for finance, economics, business, investment, budgeting revenue loss and decline concepts. Simple flat metaphor
Free with trial A hand in a suit holds a glowing red bar graph with a downward arrow indicating a decline. The image is lit with red and blue light. Bar chart decrease illustrations Hand holding glowing red downward trending bar graph with arrow chart business. A hand in a suit holds a glowing red bar graph with a downward arrow indicating a decline. The image is lit with red and blue light
Free with trial Set of Chart presentation, Report, Increase growth graph icons. Design shape elements. Graph line icons. Analytics testing, Falling demand, Pie chart report. Calendar statistics, Stats. Vector. Bar chart decrease vectors Graph line icons. Set of Chart presentation, Report and Increase growth graph icons. Design elements. Vector. Set of Chart presentation, Report, Increase growth graph icons. Design shape elements. Graph line icons. Analytics testing, Falling demand, Pie chart report. Calendar statistics, Stats. Vector
Free with trial Statistic graph progress, financial profit growth, increase and decrease line icons set. Infographic charts with arrow, circles and bars thin black and red outline symbols vector illustration. Bar chart decrease vectors Statistic graph progress, financial profit growth, increase and decrease line icons set
Free with trial Hand Drawn Illustration Showing Bar Graph and Downward Arrow for Losses or Declines. Bar chart decrease vectors Hand Drawn Illustration Showing Bar Graph and Downward Arrow for Losses or Declines
Free with trial A Red bar graph representing data growth on wooden surface, showcasing trends and analysis, Generative AI. Bar chart decrease illustrations Red bar graph representing data growth on wooden surface, showcasing trends and analysis
Free with trial Visualize decreasing business performance with this striking image. A pink 3D bar chart graphically represents a decline in financial data, highlighting loss and reduction. The falling graph is juxtaposed with a healthy green plant in a pot, emphasizing the contrast between success and setbacks. Ideal for illustrating economic concepts, investment challenges, or business performance issues, Created AI. Bar chart decrease illustrations Decreasing business performance represented by pink graphic and potted green plant. Visualize decreasing business performance with this striking image. A pink 3D bar chart graphically represents a decline in financial data, highlighting loss and reduction. The falling graph is juxtaposed with a healthy green plant in a pot, emphasizing the contrast between success and setbacks. Ideal for illustrating economic concepts, investment challenges, or business performance issues, Created AI