Free with trial Decrease vector icon on the white background. EPS 10. Bar chart decrease vectors Decrease thin line vector icon set. Decrease vector icon on the white background. EPS 10
Free with trial Productivity , diagram bar with gear icon symbol. Vector illustration. Bar chart decrease vectors Productivity , diagram bar with gear icon. Vector illustration
Free with trial The pink chart for business concept 3d rendering. Bar chart decrease illustrations The pink chart for business concept 3d rendering
Free with trial Decrease vector icon on the white background. EPS 10. Bar chart decrease vectors Decrease thin line vector icon set. Decrease vector icon on the white background. EPS 10
Free with trial Decrease vector icon on the white background. EPS 10. Bar chart decrease vectors Decrease thin line vector icon set. Decrease vector icon on the white background. EPS 10
Free with trial Financial report with a declining bar graph, suggesting a negative trend in business performance. Bar chart decrease vectors Financial report showing declining bar graph and statistics. Financial report with a declining bar graph, suggesting a negative trend in business performance
Free with trial A hand pushes a stack of coins downward while a declining trend graph and bar chart illustrate economic decline. Bar chart decrease illustrations Hand pointing at falling stack of coins with downward market trend graph illustration depicting financial loss. A hand pushes a stack of coins downward while a declining trend graph and bar chart illustrate economic decline
Free with trial Economic critical crisis concept. The bar graph on red world map background. Recession financial, cryptocurrency, gold, and the stock market. Losing money and cash. Bearish. Bar chart decrease vectors Economic critical crisis concept. The bar graph on red world map background. Recession financial, cryptocurrency, gold, and the
Free with trial A red stock market chart displayed against a dark background depicting a significant financial decline. The image conveys a sense of crisis and economic downturn. Bar chart decrease illustrations Red Stock Market Chart Showing Financial Decline with Dark Background Depicting Crisis. A red stock market chart displayed against a dark background depicting a significant financial decline. The image conveys a sense of crisis and economic downturn
Free with trial Graph line icon. Neumorphic, Orange gradient, 3d pin buttons. Column chart sign. Growth diagram symbol. Line icons. Neumorphic buttons with outline signs. Vector. Bar chart decrease illustrations Graph line icon. Column chart sign. Line icons. Vector. Graph line icon. Neumorphic, Orange gradient, 3d pin buttons. Column chart sign. Growth diagram symbol. Line icons. Neumorphic buttons with outline signs. Vector
Free with trial A 3D graphic illustrating a declining red trend line against the backdrop of a bar chart, representing the volatility and risks associated with high-yield investment (HYIP) programs. Bar chart decrease illustrations Graph depicting the downward trend in high-yield investment programs highlighting financial risk and instability. A 3D graphic illustrating a declining red trend line against the backdrop of a bar chart, representing the volatility and risks associated with high-yield investment (HYIP) programs.
Free with trial Business Woman hands typing on laptop with digital falling bar chart and cost percentage icon. Concept of financial cost reduction, business expense management and economic crisis strategy. Bar chart decrease illustrations Business Woman hands typing on laptop with digital falling bar chart and cost percentage icon. Concept of financial cost reduction
Free with trial A document with bar and line graphs is being examined with a magnifying glass. This suggests a detailed analysis of data, trends, and insights. It is isolated on white background. Bar chart decrease vectors Vector art of analyzing data with a magnifying glass on a report it shows bar graphs and a line graph indicating trends and. A document with bar and line graphs is being examined with a magnifying glass. This suggests a detailed analysis of data, trends, and insights. It is isolated on white background
Free with trial Analytics graph line icon. Neumorphic, Green gradient, 3d pin buttons. Column chart sign. Growth diagram symbol. Line icons. Neumorphic buttons with outline signs. Vector. Bar chart decrease vectors Analytics graph line icon. Column chart sign. Line icons. Vector. Analytics graph line icon. Neumorphic, Green gradient, 3d pin buttons. Column chart sign. Growth diagram symbol. Line icons. Neumorphic buttons with outline signs. Vector
Free with trial A close-up shot shows a businessman in a suit using a marker to draw a sharp downward trend line over a bar graph, symbolizing significant cost reduction and a decrease in percentage. Bar chart decrease illustrations Businessman drawing a downward trend graph indicating cost reduction and percentage decrease with a marker background image. A close-up shot shows a businessman in a suit using a marker to draw a sharp downward trend line over a bar graph, symbolizing significant cost reduction and a decrease in percentage
Free with trial This image shows a colorful bar graph with a downward trend line, symbolizing decline, loss, or negative performance in a business or financial context on a white background. Bar chart decrease vectors Vector art of colorful bar graph with downward trend line, depicting decline, loss, or negative performance in business or. This image shows a colorful bar graph with a downward trend line, symbolizing decline, loss, or negative performance in a business or financial context on a white background
Free with trial Decrease vector icon on the white background. EPS 10. Bar chart decrease vectors Decrease thin line vector icon set. Decrease vector icon on the white background. EPS 10
Free with trial Decrease vector icon on the white background. EPS 10. Bar chart decrease vectors Decrease thin line vector icon set. Decrease vector icon on the white background. EPS 10
Free with trial The background is a grid with declining line and bar graphs. A 3D rendering is shown. Bar chart decrease illustrations The background is a grid with declining line and bar graphs. A 3D rendering is shown
Free with trial Falling red arrow superimposed on a bar graph showing business decline negative growth insolvency financial crisis Can be used as a banner or header image. Bar chart decrease illustrations Falling red arrow superimposed on a bar graph showing business decline , negative growth, insolvency, financial crisis. Falling red arrow superimposed on a bar graph showing business decline negative growth insolvency financial crisis Can be used as a banner or header image
Free with trial A vibrant illustration of a bar graph with arrows, representing financial trends and market analysis. The image conveys economic performance and business insights. Bar chart decrease vectors Vector art of colorful bar graph with arrows indicating growth and decline, symbolizing financial trends, market analysis, and. A vibrant illustration of a bar graph with arrows, representing financial trends and market analysis. The image conveys economic performance and business insights
Free with trial The image depicts two business professionals standing beside a bar chart that shows a downward trend, indicating a decline. In front of them, a pile of gold coins is also decreasing in size, symbolizing a reduction in financial assets or market value. Bar chart decrease illustrations Business professionals observing a declining market trend with diminishing financial assets isolated on white background. The image depicts two business. The image depicts two business professionals standing beside a bar chart that shows a downward trend, indicating a decline. In front of them, a pile of gold coins is also decreasing in size, symbolizing a reduction in financial assets or market value
Free with trial A decreasing bar graph with a downward arrow and coin, symbolizing financial loss and economic decline. This image represents negative growth and market downturns. Bar chart decrease vectors Vector art of decreasing bar graph with a downward arrow and coin, symbolizing financial loss and economic decline, , indicating. A decreasing bar graph with a downward arrow and coin, symbolizing financial loss and economic decline. This image represents negative growth and market downturns
Free with trial Businessman Hunting Piggy Bank Jumping Down on Falling Stack of Gold Bars Bar Graph with Red Arrow Spear Representing Gold Market Crash Financial Loss and Asset Devaluation. Bar chart decrease vectors Businessman Hunting Piggy Bank Jumping Down on Falling Stack of Gold Bars Bar Graph with Red Arrow Spear Representing Gold Market
Free with trial 3d rendering red arrow crashing ground with financial chart background. Concept of stock market crash, economic recession and investment loss in dark blue tone. Generative AI. Bar chart decrease illustrations 3d rendering red arrow crashing ground with financial chart background Concept of stock market crash economic recession and. 3d rendering red arrow crashing ground with financial chart background. Concept of stock market crash, economic recession and investment loss in dark blue tone. Generative AI
Free with trial Professional vector illustration of downward sloping bar graph and connected dots line represents decreasing profits market loss economic recession data analysis results reduction in growth levels and monthly revenue falling. Bar chart decrease illustrations Descending bar chart icon with line graph showing negative business trends and financial decline on transparent background. Professional vector illustration of downward sloping bar graph and connected dots line represents decreasing profits market loss economic recession data analysis results reduction in growth levels and monthly revenue falling
Free with trial This vibrant image features a collection of colorful 3D bar graphs representing data trends, perfect for visualizing statistics in business presentations and analyses. Bar chart decrease illustrations Colorful Bar Graph with 3D Shapes Representing Data Trends and Visualizing Statistics in Business and Finance Environments. This vibrant image features a collection of colorful 3D bar graphs representing data trends, perfect for visualizing statistics in business presentations and analyses
Free with trial Businessman Hunting Piggy Bank Jumping Down on Falling Stack of Gold Coins Bar Graph with Red Arrow Spear Representing Savings Depletion Financial Loss and Economic Downturn. Bar chart decrease vectors Businessman Hunting Piggy Bank Jumping Down on Falling Stack of Gold Coins Bar Graph with Red Arrow Spear Representing Savings
Free with trial This image features an intricate bar graph displaying colorful statistical data trends, perfect for business reports and presentations. Analyze metrics effectively. Bar chart decrease illustrations Colorful Data Visualization with Bar Graphs and Trends Displaying Statistical Information on a White Background. This image features an intricate bar graph displaying colorful statistical data trends, perfect for business reports and presentations. Analyze metrics effectively
Free with trial Economic critical crisis concept. The bar garph with dropdown arrow on red table background. Recession financial, cryptocurrency, gold, and the stock market. Losing money and cash. Bearish. Bar chart decrease vectors Economic critical crisis concept. The bar garph with dropdown arrow on red table background. Recession financial, cryptocurrency
Free with trial Businessman Hunting Piggy Bank Jumping Down on Falling Stack of Banknotes Bar Graph with Red Arrow Spear Representing Cash Flow Loss Economic Recession and Financial Crisis. Bar chart decrease vectors Businessman Hunting Piggy Bank Jumping Down on Falling Stack of Banknotes Bar Graph with Red Arrow Spear Representing Cash Flow
Free with trial Economic critical crisis concept. The bar graph with a down arrow on red world map background. Recession financial, cryptocurrency, gold, and the stock market. Losing money and cash. Bearish. Bar chart decrease vectors Economic critical crisis concept. The bar graph with a down arrow on red world map background. Recession financial, cryptocurrency
Free with trial Global decline icon. Downward financial chart. Dollar and globe image. Black vector. EPS 10. Bar chart decrease vectors Global decline icon. Downward financial chart. Dollar and globe image. Black vector.
Free with trial Calendar graph line icon. Neumorphic, Orange gradient, 3d pin buttons. Column chart sign. Growth diagram symbol. Line icons. Neumorphic buttons with outline signs. Vector. Bar chart decrease vectors Calendar graph line icon. Column chart sign. Line icons. Vector. Calendar graph line icon. Neumorphic, Orange gradient, 3d pin buttons. Column chart sign. Growth diagram symbol. Line icons. Neumorphic buttons with outline signs. Vector
Free with trial Minimalistic animated red bar chart visualizing steady decline and downward performance. Represents business losses, market downturn, economic slowdown, financial risk, crisis scenarios, and negative growth in a modern digital style. Bar chart decrease illustrations Declining Business Chart Showing Negative Market Trend. Minimalistic animated red bar chart visualizing steady decline and downward performance. Represents business losses, market downturn, economic slowdown, financial risk, crisis scenarios, and negative growth in a modern digital style.
Free with trial This illustration features two colorful bar graphs on a white background, showcasing data comparison with distinct color palettes for engaging visual analysis and presentations. Bar chart decrease illustrations Colorful Bar Graphs on White Background Representing Data Comparison and Growth with Different Color Schemes for Visual Analysis. This illustration features two colorful bar graphs on a white background, showcasing data comparison with distinct color palettes for engaging visual analysis and presentations
Free with trial This vibrant bar graph displays data trends through colorful segments, ideal for marketing and business presentations. Utilize this minimalistic design for impactful insights. Bar chart decrease illustrations Colorful Bar Graph Showing Data Trends with Various Heights and Colors in a Minimalistic Style for Business and Marketing. This vibrant bar graph displays data trends through colorful segments, ideal for marketing and business presentations. Utilize this minimalistic design for impactful insights
Free with trial This vibrant image features a collection of colorful 3D bar graphs representing data trends, perfect for visualizing statistics in business presentations and analyses. Bar chart decrease illustrations Colorful Bar Graph with 3D Shapes Representing Data Trends and Visualizing Statistics in Business and Finance Environments. This vibrant image features a collection of colorful 3D bar graphs representing data trends, perfect for visualizing statistics in business presentations and analyses
Free with trial Dark blue background as EU European Union, Europe, silhouette outline map of Germany and increasing rising uptrend bar-chart as economy and industry success image symbolic. Bar chart decrease illustrations Dark blue background as EU European Union, Europe, silhouette outline map of Germany and increasing rising uptrend bar-chart as
Free with trial This monochromatic bar graph illustrates data trends over time, showcasing variations in performance and metrics, ideal for presentations and business reports. Bar chart decrease illustrations Black and White Bar Graph with Trend Line Showing Data Variations Over Time for Analysis and Reporting Purposes in Business. This monochromatic bar graph illustrates data trends over time, showcasing variations in performance and metrics, ideal for presentations and business reports
Free with trial This illustration features two colorful bar graphs on a white background, showcasing data comparison with distinct color palettes for engaging visual analysis and presentations. Bar chart decrease illustrations Colorful Bar Graphs on White Background Representing Data Comparison and Growth with Different Color Schemes for Visual Analysis. This illustration features two colorful bar graphs on a white background, showcasing data comparison with distinct color palettes for engaging visual analysis and presentations
Free with trial This image features a conceptual bar graph, illustrating contrasting trends of growth and decline in business performance, ideal for data analysis presentations. Bar chart decrease illustrations Growth and Decline: Conceptual Bar Graph Illustrating Positive and Negative Trends in Business Performance Data Visualization. This image features a conceptual bar graph, illustrating contrasting trends of growth and decline in business performance, ideal for data analysis presentations
Free with trial This image features colorful 3D bar graphs representing both growth and decline trends, ideal for business analytics and financial performance visualizations. Bar chart decrease illustrations Colorful 3D Bar Graphs Displaying Growth and Decline Trends in Business Analytics and Financial Performance on a Clean White. This image features colorful 3D bar graphs representing both growth and decline trends, ideal for business analytics and financial performance visualizations
Free with trial Statistic graph progress, financial profit growth, increase, and decrease line icons set. Infographic charts with arrows, circles, and bars thin black outline symbols vector illustration. Bar chart decrease vectors Statistic graph progress, financial profit growth, increase and decrease line icons set. Statistic graph progress, financial profit growth, increase, and decrease line icons set. Infographic charts with arrows, circles, and bars thin black outline symbols vector illustration.
Free with trial A chart that shows a decline. A falling chart that goes down sharply, a market crash. Vector illustration. Bar chart decrease vectors A chart that shows a decline. A falling chart that goes down sharply, a market crash. Vector
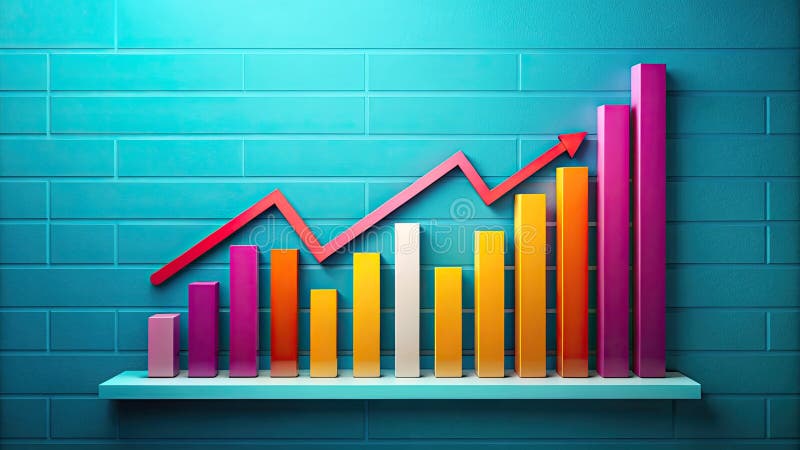
Free with trial This vibrant illustration features colorful bar graphs that visualize business growth and performance metrics, ideal for presentations, reports, and analysis. Bar chart decrease illustrations Colorful Bar Graphs Representing Business Growth and Performance Metrics in Vibrant Tones of Red, Orange, Yellow, White, and Green. This vibrant illustration features colorful bar graphs that visualize business growth and performance metrics, ideal for presentations, reports, and analysis
Free with trial Business and financial concept. Bar graph with upper and lower arrows to show low cost and high quality on black background. Bar chart decrease vectors Business and financial concept. Bar graph with upper and lower arrow to show low cost and high quality on black background
Free with trial This vibrant bar graph showcases varying heights for data visualization, perfect for representing trends in finance or business analysis against a clean white background. Bar chart decrease illustrations Colorful Bar Graph with Varying Heights Representing Data Trends and Insights in a Minimalist Art Style on White Background. This vibrant bar graph showcases varying heights for data visualization, perfect for representing trends in finance or business analysis against a clean white background
Free with trial A vibrant 3D bar graph illustration shows financial growth trends with colorful bars. Perfect for business presentations, analytics, and creative projects. Bar chart decrease illustrations Colorful 3D bar graph illustration depicting financial growth and performance trends with vibrant hues and clean modern design for. A vibrant 3D bar graph illustration shows financial growth trends with colorful bars. Perfect for business presentations, analytics, and creative projects
Free with trial Abstract 3D bar graph representation showcasing various data trends with vibrant colors and shadows. Ideal for presentations, reports, and analytics purposes. Bar chart decrease illustrations 3D Visualization of Colorful Bar Graph Illustrating Data Trends with Shadows and Depth in a Minimalistic Style for Data Analysis. Abstract 3D bar graph representation showcasing various data trends with vibrant colors and shadows. Ideal for presentations, reports, and analytics purposes
Free with trial Graph depicting 3D line and bar data visualization in red, white background, financial trends concept. Bar chart decrease illustrations Graph showing 3D line and bar data visualization in red, white background, financial trends concept
Free with trial Bright and colorful bar graph created with blocks illustrates data visualization in a contemporary business context. Ideal for finance and marketing materials. Bar chart decrease illustrations Colorful bar graph made of building blocks representing data visualization and analysis in modern business graphics on a clean. Bright and colorful bar graph created with blocks illustrates data visualization in a contemporary business context. Ideal for finance and marketing materials
Free with trial This vibrant 3D bar graph showcases data trends with a colorful aesthetic, perfect for presentations in business, finance, or technology sectors emphasizing analytics. Bar chart decrease illustrations Colorful Bar Graph Visualization of Data Trends in Modern Business Environment with 3D Perspective and Vibrant Gradient Colors. This vibrant 3D bar graph showcases data trends with a colorful aesthetic, perfect for presentations in business, finance, or technology sectors emphasizing analytics
Free with trial This sleek, minimalist linear bar graph is perfect for showcasing downward trends in your business data. Ideal for presentations, reports, and dashboards, this editable graphic allows you to easily customize stroke width and colors to match your brand. The clean design and simple layout make complex data easily digestible, highlighting key performance indicators and areas needing attention. Bar chart decrease illustrations Editable Linear Bar Graph Visualize Downward Trends for Powerful Business Analytics Reports and Presentations. This sleek, minimalist linear bar graph is perfect for showcasing downward trends in your business data. Ideal for presentations, reports, and dashboards, this editable graphic allows you to easily customize stroke width and colors to match your brand. The clean design and simple layout make complex data easily digestible, highlighting key performance indicators and areas needing attention.
Free with trial Graph line icon. Neumorphic, Green gradient, 3d pin buttons. Column chart sign. Growth diagram symbol. Line icons. Neumorphic buttons with outline signs. Vector. Bar chart decrease vectors Graph line icon. Column chart sign. Line icons. Vector. Graph line icon. Neumorphic, Green gradient, 3d pin buttons. Column chart sign. Growth diagram symbol. Line icons. Neumorphic buttons with outline signs. Vector
Free with trial Analytics graph line icon. Neumorphic, Red gradient, 3d pin buttons. Column chart sign. Growth diagram symbol. Line icons. Neumorphic buttons with outline signs. Vector. Bar chart decrease illustrations Analytics graph line icon. Column chart sign. Line icons. Vector. Analytics graph line icon. Neumorphic, Red gradient, 3d pin buttons. Column chart sign. Growth diagram symbol. Line icons. Neumorphic buttons with outline signs. Vector
Free with trial Decrease icon or logo isolated sign symbol vector illustration - Collection of high quality black style vector icons, seles chart icon isolated sign symbol vector illustration - Collection of high quality. Bar chart decrease vectors Decrease icon or logo isolated sign symbol vector illustration
Free with trial Image displaying stock market chart, rising or falling trends Generative AI. Bar chart decrease illustrations Image displaying stock market chart, rising or falling trends
Free with trial Reduction chart icon. eps. Bar chart decrease vectors Chart Icon Demonstrating Reduction in Data, Business Decline, and Statistical Analysis. Reduction chart icon.eps
Free with trial The pink chart for business concept 3d rendering. Bar chart decrease illustrations The pink chart for business concept 3d rendering
Free with trial The decline in the bar graph is due to the stock market falling, economic crash, investing failure or mistake, price drop, recession, investment risk concept, stock price decline concept flat design. Bar chart decrease vectors The decline in the bar graph is due to the stock market falling, economic crash, investing failure or mistake, , price drop. The decline in the bar graph is due to the stock market falling, economic crash, investing failure or mistake, price drop, recession, investment risk concept, stock price decline concept flat design
Free with trial Graph line icon. Neumorphic, Purple gradient, 3d pin buttons. Column chart sign. Growth diagram symbol. Line icons. Neumorphic buttons with outline signs. Vector. Bar chart decrease vectors Graph line icon. Column chart sign. Line icons. Vector. Graph line icon. Neumorphic, Purple gradient, 3d pin buttons. Column chart sign. Growth diagram symbol. Line icons. Neumorphic buttons with outline signs. Vector
Free with trial Scissors cutting financial chart economic crisis downturn coins graph falling trend abstract background website banner Vector illustration. Bar chart decrease vectors Scissors cutting financial chart economic crisis downturn coins graph falling trend abstract background website banner
Free with trial Open laptop displaying colorful bar graphs and data analysis on screen, representing growth and business analytics ,Generative AI. Bar chart decrease illustrations Open laptop displaying colorful bar graphs and data analysis on screen, representing growth and business analytics
Free with trial Chat arrow down icon Vector set on white background. EPS 10. Bar chart decrease vectors Chart arrow down icon set. decline downward chart vector symbol. stock trend downturn graph sign. negative economy bar Chart. Chat arrow down icon Vector set on white background. EPS 10
Free with trial Chat arrow down icon Vector set on white background. EPS 10. Bar chart decrease vectors Chart arrow down icon set. decline downward chart vector symbol. stock trend downturn graph sign. negative economy bar Chart. Chat arrow down icon Vector set on white background. EPS 10
Free with trial Graph chart going up and down sign arrows flat design vector illustration on white background. Bar chart decrease vectors Graph chart going up and down sign arrows flat design vector illustration
Free with trial Graph chart infographic report set with statistic arrow data elements for financial market analysis and planning in business performance research for your illustration. Bar chart decrease vectors Graph chart infographic report set
Free with trial Graph chart infographic report set with statistic arrow data elements for financial market analysis and planning in business performance research for your illustration. Bar chart decrease vectors Graph chart infographic report set
Free with trial Graph chart infographic report set with statistic arrow data elements for financial market analysis and planning in business performance research for your illustration. Bar chart decrease vectors Graph chart infographic report set
Free with trial This image shows a 3D bar graph, generated by AI, depicting a rise and subsequent fall in values. The red bars illustrate a peak, followed by a sharp decline, possibly representing a trend in data or market fluctuations. The visual is clean and easy to understand, highlighting the dramatic change i. Bar chart decrease illustrations Red 3D Bar Graph. This image shows a 3D bar graph, generated by AI, depicting a rise and subsequent fall in values. The red bars illustrate a peak, followed by a sharp decline, possibly representing a trend in data or market fluctuations. The visual is clean and easy to understand, highlighting the dramatic change i
Free with trial A black and white line illustration features a speech bubble with a downward arrow and a dollar sign, indicating a decrease in value. Below, a stylized gold bar is depicted, flanked by two sparkles. The minimalistic design suggests an economic theme, likely related to changes in gold prices. Bar chart decrease vectors Gold Price Down. A black and white line illustration features a speech bubble with a downward arrow and a dollar sign, indicating a decrease in value. Below, a stylized gold bar is depicted, flanked by two sparkles. The minimalistic design suggests an economic theme, likely related to changes in gold prices.
Free with trial A graphic icon shows a stylized gold bar with two sparkle symbols on either side, suggesting value or shine. Above, a speech bubble contains a downward-facing arrow and a dollar sign, indicating a decrease or decline in value or price. The design uses a simple black and white color scheme, conveying information clearly and directly. Bar chart decrease vectors Gold Price Down. A graphic icon shows a stylized gold bar with two sparkle symbols on either side, suggesting value or shine. Above, a speech bubble contains a downward-facing arrow and a dollar sign, indicating a decrease or decline in value or price. The design uses a simple black and white color scheme, conveying information clearly and directly.
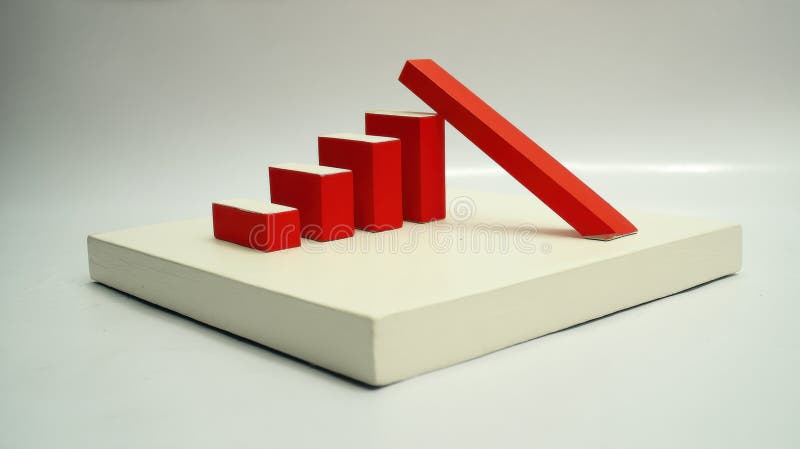
Free with trial This image shows a 3D model of a bar graph, where one bar is falling, symbolizing decline or failure. This striking visual representation was generated by AI, offering a unique perspective on downward trends and economic instability. The clean design makes it ideal for illustrating various concepts. Bar chart decrease illustrations Falling Bar Graph. This image shows a 3D model of a bar graph, where one bar is falling, symbolizing decline or failure. This striking visual representation was generated by AI, offering a unique perspective on downward trends and economic instability. The clean design makes it ideal for illustrating various concepts
Free with trial Chat arrow down icon Vector set on white background. EPS 10. Bar chart decrease vectors Chart arrow down icon set. decline downward chart vector symbol. stock trend downturn graph sign. negative economy bar Chart. Chat arrow down icon Vector set on white background. EPS 10
Free with trial A person is analyzing a bar graph with a downward trend line, indicating a decrease in stock value. Vector art design using ai tool. Bar chart decrease vectors Sell Stock Graph Illustration. A person is analyzing a bar graph with a downward trend line, indicating a decrease in stock value. Vector art design using ai tool.
Free with trial A minimalist black and white icon representing a financial growth chart. It features a series of vertical bars of varying heights, symbolizing data points or periods, overlaid with a line graph connecting circular nodes. This graphic effectively conveys concepts of financial analysis, business growth, performance tracking, and data visualization. Ideal for presentations, reports, websites, and applications related to finance, economics, and business intelligence. Bar chart decrease vectors Growth Analysis Finance Chart Icon. A minimalist black and white icon representing a financial growth chart. It features a series of vertical bars of varying heights, symbolizing data points or periods, overlaid with a line graph connecting circular nodes. This graphic effectively conveys concepts of financial analysis, business growth, performance tracking, and data visualization. Ideal for presentations, reports, websites, and applications related to finance, economics, and business intelligence.
Free with trial Trend and Candlestick Chart vector Crypto Investment concept icon or symbol. Bar chart decrease vectors Trend and Candlestick Chart vector Crypto Investment icon or symbol
Free with trial Range Breakout vector Candlestick Chart concept icon or symbol. Bar chart decrease vectors Range Breakout vector Candlestick Chart icon or symbol
Free with trial This image features two variations of a decreasing graph icon. One is an outline version, and the other is a solid black version. Both show a bar graph with descending bars and a curved arrow pointing downwards, symbolizing a decline or decrease. These icons are suitable for illustrating concepts like loss, recession, negative trends, or falling statistics in various contexts. Bar chart decrease illustrations Decreasing Graph Icon Set. This image features two variations of a decreasing graph icon. One is an outline version, and the other is a solid black version. Both show a bar graph with descending bars and a curved arrow pointing downwards, symbolizing a decline or decrease. These icons are suitable for illustrating concepts like loss, recession, negative trends, or falling statistics in various contexts.