Free with trial A comprehensive set of financial and data visualization icons, perfect for illustrating business and economic concepts. This collection includes a growing bar chart with an upward trend, a declining bar chart with a downward trend, and a mixed bar chart. Also featured are stacks of global currencies (USD, Euro, INR), a segmented pie chart, and a world map colored green and red to signify global market conditions or data distribution. Ideal for presentations, reports, websites, and educational materials related to economics, finance, and market analysis. Bar chart decrease vectors Global Financial and Business Data Visualization Icons Set. A comprehensive set of financial and data visualization icons, perfect for illustrating business and economic concepts. This collection includes a growing bar chart with an upward trend, a declining bar chart with a downward trend, and a mixed bar chart. Also featured are stacks of global currencies (USD, Euro, INR), a segmented pie chart, and a world map colored green and red to signify global market conditions or data distribution. Ideal for presentations, reports, websites, and educational materials related to economics, finance, and market analysis.
Free with trial Marketing. A vibrant and modern bar graph with glowing neon colors represents data and business growth. Bar chart decrease illustrations Glowing Bar Graph Data Visualization, Business Growth, Statistics, marketing. marketing. A vibrant and modern bar graph with glowing neon colors represents data and business growth.
Free with trial An image of a wooden easel holding a whiteboard with a bar graph and a red arrow indicating a downward trend, symbolizing a decrease or decline. Bar chart decrease illustrations A graph on an easel showing a decline in values over time with a downward trend. An image of a wooden easel holding a whiteboard with a bar graph and a red arrow indicating a downward trend, symbolizing a decrease or decline
Free with trial Easel holds a financial chart showing upward green and downward red arrows. Bar chart decrease vectors Easel Displaying Financial Chart With Green And Red Arrows. Easel holds a financial chart showing upward green and downward red arrows
Free with trial Red falling bar chart with arrow, business decline concept, loss and failure symbol. Economic recession illustration. Bar chart decrease illustrations Red bar graph with declining arrow on white background grid. Red falling bar chart with arrow, business decline concept, loss and failure symbol. Economic recession illustration
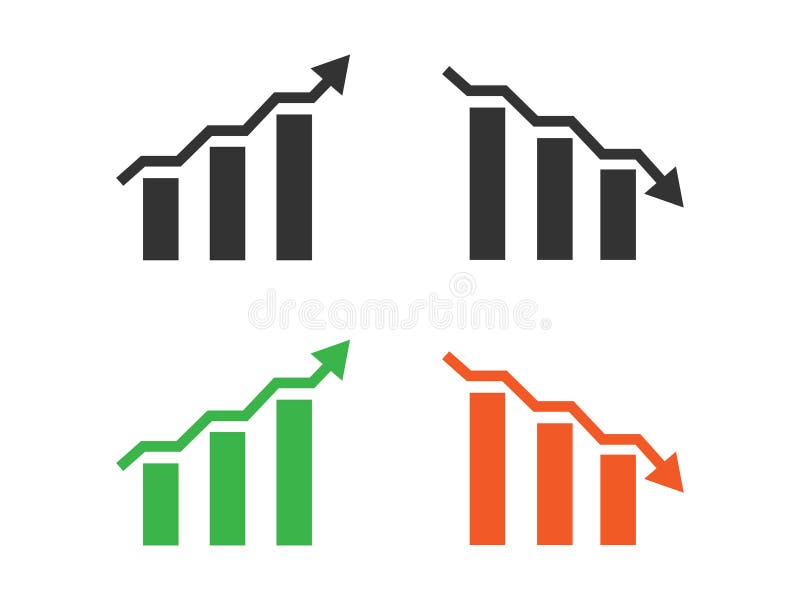
Free with trial Icons representing financial growth, decline, and trends. Perfect for business presentations and data visualization design. Bar chart decrease illustrations Four business growth and decline bar chart icons with arrows. Icons representing financial growth, decline, and trends. Perfect for business presentations and data visualization design
Free with trial A pen rests on piece of paper with bar chart, suggesting data analysis, business planning, or financial reporting ,Generative ai. Bar chart decrease illustrations Pen and paper with bar chart, a visual representation of data analysis. A pen rests on piece of paper with bar chart, suggesting data analysis, business planning, or financial reporting ,Generative ai
Free with trial This image is a bar chart titled 'Decline Chart' showing the decline of a certain metric over a range. The x-axis represents different intervals, while the y-axis represents the quantity, ranging from 0 to 1000. There are three different data series represented by different colors: dark blue for 'Etb,' gray for 'Decline,' and orange for 'Dec Chart. ' Each interval on the x-axis shows a decline in. Bar chart decrease illustrations Visual representation of data decline over a specific range. This image is a bar chart titled 'Decline Chart' showing the decline of a certain metric over a range. The x-axis represents different intervals, while the y-axis represents the quantity, ranging from 0 to 1000. There are three different data series represented by different colors: dark blue for 'Etb,' gray for 'Decline,' and orange for 'Dec Chart.' Each interval on the x-axis shows a decline in
Free with trial Hand pointing at the smallest bar in a declining bar graph on a table. Bar chart decrease illustrations Hand pointing at the smallest bar in a declining bar graph on a table
Free with trial Dual trend line graph bar business growth and decline visualization. Bar chart decrease vectors Profit growth and loss decline business graph bar. Dual trend line graph bar business growth and decline visualization
Free with trial Simple bar graph illustrating a sharp declining trend with a prominent downward red arrow, symbolizing economic downturn and financial loss. Bar chart decrease vectors Simple bar graph illustrating a sharp declining trend with a prominent downward red arrow, symbolizing economic downturn
Free with trial Budget cut strategy cost reduction meeting with declining chart. Generative AI. Bar chart decrease illustrations Budget cut strategy cost reduction meeting with declining chart
Free with trial Bar chart and red arrow indicate a negative trend and economic recession. Represents financial crisis and business loss. Bar chart decrease vectors Financial graph showing declining sales and economic downturn. Bar chart and red arrow indicate a negative trend and economic recession. Represents financial crisis and business loss
Free with trial This image features a 3D bar graph with a downward trend isolated on a white background. The graph consists of green bars that decrease in height from left to right, with a red arrow pointing downward to emphasize the declining trend. The image is clean and visually appealing, suitable for business and financial contexts. Bar chart decrease illustrations 3d bar graph with downward trend isolated on white background. This image features a 3D bar graph with a downward trend isolated on a white background. The graph consists of green bars that decrease in height from left to right, with a red arrow pointing downward to emphasize the declining trend. The image is clean and visually appealing, suitable for business and financial contexts
Free with trial A line art image depicting a magnifying glass focused on a person icon and a downward trending bar chart. Bar chart decrease illustrations Declining Sales Analysis Magnifying Glass, Downward Trend Chart. A line art image depicting a magnifying glass focused on a person icon and a downward trending bar chart.
Free with trial This image presents an abstract view of financial trends through black and orange bar graphs, symbolizing data analysis and market metrics. Bar chart decrease illustrations Abstract representation of financial trends with black and orange bar graphs on dark background. This image presents an abstract view of financial trends through black and orange bar graphs, symbolizing data analysis and market metrics
Free with trial A declining bar graph with a sad face emoticon conveys financial loss. Flat design, business and data analytics theme. Bar chart decrease vectors Downward Trending Bar Graph with Sad Emoticon Represents Financial Loss and Negative Performance. A declining bar graph with a sad face emoticon conveys financial loss. Flat design, business and data analytics theme.
Free with trial A vertical bar graph composed of small cubes in pink, green, and light green is arranged in a pyramid-like structure on a plain white background, with pink cubes on the left, green cubes in the middle, and a downward-pointing arrow on the right side indicating a decreasing trend in the data visualization. Bar chart decrease illustrations A vertical bar graph made of colorful cubes in pink and green showing a downward trend with a descending arrow on a white. A vertical bar graph composed of small cubes in pink, green, and light green is arranged in a pyramid-like structure on a plain white background, with pink cubes on the left, green cubes in the middle, and a downward-pointing arrow on the right side indicating a decreasing trend in the data visualization
Free with trial This image features a bar graph with two sections. The left section shows an upward trend with a green arrow pointing upwards, indicating growth or increase. The right section displays a downward trend with a red arrow pointing downwards, indicating decline or decrease. The image is set against a transparent background, making it suitable for various design applications. Bar chart decrease illustrations Bar graph with up and down arrows isolated on white background. This image features a bar graph with two sections. The left section shows an upward trend with a green arrow pointing upwards, indicating growth or increase. The right section displays a downward trend with a red arrow pointing downwards, indicating decline or decrease. The image is set against a transparent background, making it suitable for various design applications
Free with trial The image shows a bar chart with progressively shorter bars from left to right, indicating a downward trend. A bold red arrow points diagonally from the top left to the bottom right, emphasizing the decline. Bar chart decrease illustrations Graphic illustrating a declining trend with a downward red arrow. The image shows a bar chart with progressively shorter bars from left to right, indicating a downward trend. A bold red arrow points diagonally from the top left to the bottom right, emphasizing the decline
Free with trial This image depicts a bar graph with a series of bars decreasing in height from left to right, accompanied by a large red downward-pointing arrow, symbolizing a downward trend or decline. Bar chart decrease illustrations A downward trending bar graph with a red arrow indicating decline. This image depicts a bar graph with a series of bars decreasing in height from left to right, accompanied by a large red downward-pointing arrow, symbolizing a downward trend or decline
Free with trial Declining Bar Graph with Arrow Shows Downtrend and Loss in Business. Bar chart decrease vectors Declining Bar Graph with Arrow Shows Downtrend and Loss in Business
Free with trial The image displays a series of nine rectangular blocks arranged in descending order of height. Each block is a different color, transitioning from green at the tallest to red at the shortest. The visual representation emphasizes a gradient decrease in height, suggesting a decline or comparison metric. The blocks are uniformly spaced and have a sleek, modern design, making them suitable for use in. Bar chart decrease illustrations Colorful descending bar chart visualization with vibrant blocks. The image displays a series of nine rectangular blocks arranged in descending order of height. Each block is a different color, transitioning from green at the tallest to red at the shortest. The visual representation emphasizes a gradient decrease in height, suggesting a decline or comparison metric. The blocks are uniformly spaced and have a sleek, modern design, making them suitable for use in
Free with trial The image presents a colorful bar graph with a downward trending line, symbolizing a decline in performance or an economic downturn on a white background. Bar chart decrease vectors Vector art of colorful bar graph with a downward trending line, indicating a decline in performance or economic downturn. The image presents a colorful bar graph with a downward trending line, symbolizing a decline in performance or an economic downturn on a white background
Free with trial Graph and Chart icon set. Containing data, increase, growth, pie chart, data analytics, business and more. Vector graph icon set. Bar chart decrease vectors Graph and Chart icon set. Containing data, increase, growth, pie chart, data analytics, business and more.
Free with trial A black bar graph shows two bars labeled COST and REVENUE on a white background. Clear details and vibrant col. Bar chart decrease illustrations Black bar graph with COST and REVENUE labels on white background cost revenue. A black bar graph shows two bars labeled COST and REVENUE on a white background. Clear details and vibrant col
Free with trial Modern laptop shows real time financial data analytics with line graphs bar charts and a pie chart. Bar chart decrease illustrations Laptop Screen Displaying Live Business Data Charts and Analytics. Modern laptop shows real time financial data analytics with line graphs bar charts and a pie chart
Free with trial Declining Bar Graph Representing Downturn or Reduction in Statistics. Bar chart decrease vectors Declining Bar Graph Representing Downturn or Reduction in Statistics
Free with trial A bar graph shows decreasing values with a downward trending arrow representing business failure and economic loss. Bar chart decrease vectors Declining Bar Graph with Downward Arrow: Business Loss and Failure. A bar graph shows decreasing values with a downward trending arrow representing business failure and economic loss.
Free with trial The image illustrates a descending trend using a series of progressively shorter vertical bars. A bold red downward-sloping arrow emphasizes the decline, suggesting a significant drop in values or performance over time. This visual metaphor is often used in business, finance, and analytics to depict negative growth or reduction. Bar chart decrease illustrations Decline in performance represented by bar chart and downward arrow. The image illustrates a descending trend using a series of progressively shorter vertical bars. A bold red downward-sloping arrow emphasizes the decline, suggesting a significant drop in values or performance over time. This visual metaphor is often used in business, finance, and analytics to depict negative growth or reduction
Free with trial The image displays a series of blocks in a gradient of colors from yellow to purple, arranged in a descending order of height. The blocks decrease in size progressively, forming a visual representation of a gradient bar chart. Bar chart decrease illustrations Graduated colorful blocks arranged in a descending height sequence. The image displays a series of blocks in a gradient of colors from yellow to purple, arranged in a descending order of height. The blocks decrease in size progressively, forming a visual representation of a gradient bar chart
Free with trial The image shows a bar chart with a downward trend line overlaid in red, indicating a decline. A green dollar symbol is positioned at the end of the chart, suggesting a connection to financial loss or decreasing revenue. Bar chart decrease illustrations Graphic depicting a declining financial trend with a dollar symbol. The image shows a bar chart with a downward trend line overlaid in red, indicating a decline. A green dollar symbol is positioned at the end of the chart, suggesting a connection to financial loss or decreasing revenue
Free with trial A visually appealing bar graph illustration against a sleek black background, showcasing business growth, data analysis, and statistical trends. The illustration is suitable for presentations, reports, and web content related to finance, marketing, and technology. Bar chart decrease illustrations Bar Graph Illustration Business Growth, Data Analysis, and Statistics. A visually appealing bar graph illustration against a sleek black background, showcasing business growth, data analysis, and statistical trends. The illustration is suitable for presentations, reports, and web content related to finance, marketing, and technology.
Free with trial A red downward-pointing arrow sits atop a blue bar graph labeled GDP, with white financial data and numbers below on a dark background with a gradient light effect. red, down, arrow. Bar chart decrease illustrations Red down arrow on blue bar graph with g d p text and financial data. A red downward-pointing arrow sits atop a blue bar graph labeled GDP, with white financial data and numbers below on a dark background with a gradient light effect. red, down, arrow
Free with trial Falling Bar Graph with Downward Arrow Indicating Decline or Recession. Bar chart decrease vectors Falling Bar Graph with Downward Arrow Indicating Decline or Recession
Free with trial Four 3D bar graphs with arrows indicating upward and downward trends on white. Clear details and vibrant colors enhance visual. Bar chart decrease illustrations Four 3D Bar Graphs Showing Upward and Downward Trends with Arrows on White Keywords: bar graph, chart, data, statistics, analysis. Four 3D bar graphs with arrows indicating upward and downward trends on white. Clear details and vibrant colors enhance visual
Free with trial A visually striking bar graph illustration depicting both upward and downward trends, set against a clean white background, representing market dynamics and data analysis. Bar chart decrease vectors Vector art of a dynamic bar graph illustration showcasing both upward and downward trends, , symbolizing market fluctuations and. A visually striking bar graph illustration depicting both upward and downward trends, set against a clean white background, representing market dynamics and data analysis
Free with trial A 3d rendering of a bar graph with green bars and a red downward-pointing arrow, illustrating a decline or negative. Bar chart decrease illustrations 3d bar graph with downward arrow showing decline on white background. A 3d rendering of a bar graph with green bars and a red downward-pointing arrow. A 3d rendering of a bar graph with green bars and a red downward-pointing arrow, illustrating a decline or negative
Free with trial This is a 3D render of a descending bar graph. The bars are blue, purple, yellow, and orange on a transparent background. Bar chart decrease vectors Colorful descending bar graph illustration on transparent background. This is a 3D render of a descending bar graph. The bars are blue, purple, yellow, and orange on a transparent background.
Free with trial A golden bar graph illustrates a downward financial trend, with each bar decreasing in height from left to right. A large, shiny golden coin with a dollar sign is positioned on top of the graph, and a golden arrow points downwards, signifying a loss or decline in value. The entire composition is set against a clean white background. Bar chart decrease illustrations Golden Bar Graph Showing Downward Trend with Dollar Coin and Arrow on White Background finance. A golden bar graph illustrates a downward financial trend, with each bar decreasing in height from left to right. A large, shiny golden coin with a dollar sign is positioned on top of the graph, and a golden arrow points downwards, signifying a loss or decline in value. The entire composition is set against a clean white background
Free with trial A set of twelve diverse and versatile vector icons depicting various types of charts commonly used in business and data analysis. These include line graphs showing upward and fluctuating trends, bar charts illustrating data comparisons, and pie charts representing proportions. Ideal for presentations, reports, websites, and infographics related to finance, marketing, and statistics. Bar chart decrease vectors Collection of Line and Bar Charts & Pie Charts - Business Data Visualization Icons. A set of twelve diverse and versatile vector icons depicting various types of charts commonly used in business and data analysis. These include line graphs showing upward and fluctuating trends, bar charts illustrating data comparisons, and pie charts representing proportions. Ideal for presentations, reports, websites, and infographics related to finance, marketing, and statistics.
Free with trial A 3D rendered illustration displays a decreasing bar graph composed of blue, purple, and yellow bars, indicating declining numerical data and trends. Bar chart decrease vectors Glossy bar graph with descending data trend on transparent background. A 3D rendered illustration displays a decreasing bar graph composed of blue, purple, and yellow bars, indicating declining numerical data and trends.
Free with trial The image depicts a wooden easel holding a white canvas. On the canvas, there is a red bar graph illustrating a downward trend. The bars decrease in height from left to right, and a red arrow at the top right corner of the graph further emphasizes the downward direction. The overall scene is set against a plain white background, drawing attention to the graph and its message of decline. Bar chart decrease illustrations Decline in data represented by a red downward trend graph on an easel. The image depicts a wooden easel holding a white canvas. On the canvas, there is a red bar graph illustrating a downward trend. The bars decrease in height from left to right, and a red arrow at the top right corner of the graph further emphasizes the downward direction. The overall scene is set against a plain white background, drawing attention to the graph and its message of decline
Free with trial The image shows a bar graph with a series of descending bars, each one shorter than the previous, indicating a downward trend. A large red arrow points diagonally downward from the top left to the bottom right, emphasizing the decline. Bar chart decrease illustrations A downward trending graph with a red arrow indicating a decrease in value. The image shows a bar graph with a series of descending bars, each one shorter than the previous, indicating a downward trend. A large red arrow points diagonally downward from the top left to the bottom right, emphasizing the decline
Free with trial Red wooden blocks forming a declining bar graph on a financial document. Shows a negative trend in business or market data. Bar chart decrease illustrations Red Wooden Blocks Showing Declining Bar Graph on Financial Report Ai generated. Red wooden blocks forming a declining bar graph on a financial document. Shows a negative trend in business or market data
Free with trial Two sets of rounded rectangular bars are displayed side by side on a white background. The left set is solid black, with bars decreasing in height from left to right. The right set is an outline. Bar chart decrease vectors Black and white bar graph showing downward trend on white background Keywords: bar chart, graph. Two sets of rounded rectangular bars are displayed side by side on a white background. The left set is solid black, with bars decreasing in height from left to right. The right set is an outline
Free with trial A blue bar graph with a red downward-pointing arrow labeled GDP displayed on a digital screen with a dark background and subtle grid lines bar, graph, blue. blue bar graph with red. Bar chart decrease illustrations Blue bar graph with red downward arrow labeled g d p on digital screen. A blue bar graph with a red downward-pointing arrow labeled GDP displayed on a digital screen with a dark background and subtle grid lines bar, graph, blue. blue bar graph with red
Free with trial Business stock market chart with a downward trend arrow, set against a white background. Concept of financial loss or market decline. 3D Rendering. Bar chart decrease illustrations Business stock market chart with downward trend arrow on white background. 3D Rendering. Business stock market chart with a downward trend arrow, set against a white background. Concept of financial loss or market decline. 3D Rendering
Free with trial Graph chart going up and down sign arrows flat design vector illustration on white background. Bar chart decrease vectors Graph chart going up and down sign arrows flat design vector illustration
Free with trial Black bar graph with disinflation text showing a downward trend on white background. Bar chart decrease illustrations Black bar graph showing declining trend with disinflation text Keywords: disinflation, graph. Black bar graph with disinflation text showing a downward trend on white background
Free with trial Hand drawn bar graph showing a sharp downward trend with a descending arrow. Bar chart decrease vectors Hand drawn bar graph showing a sharp downward trend with a descending arrow
Free with trial A 3D bar chart visually represents a significant financial decline. A red arrow sharply descends, indicating a negative trend and a downward trajectory for market performance. Bar chart decrease illustrations Financial decline graph showing downturn and decreasing trend with arrow. A 3D bar chart visually represents a significant financial decline. A red arrow sharply descends, indicating a negative trend and a downward trajectory for market performance
Free with trial Online Crypto Trading vector Candlestick Chart concept outline icon or sign. Bar chart decrease illustrations Online Crypto Trading vector Candlestick Chart outline icon or sign
Free with trial This abstract digital artwork features a blue and gray bar graph with data points highlighting growth trends on a dark background, ideal for business and analytics themes Generative AI. Bar chart decrease illustrations Blue and Gray Bar Graph with Data Points Representing Growth Trends and Statistical Analysis in Digital Format on Dark Background. This abstract digital artwork features a blue and gray bar graph with data points highlighting growth trends on a dark background, ideal for business and analytics themes Generative AI
Free with trial A 3D bar graph with red bars decreasing in height from left to right, accompanied by a red arrow pointing downwards, indicating a decline or decrease in the represented values. Bar chart decrease illustrations A graph showing a decline in values over time with a red downward trend arrow. A 3D bar graph with red bars decreasing in height from left to right, accompanied by a red arrow pointing downwards, indicating a decline or decrease in the represented values
Free with trial The image shows a white easel holding a presentation board with a combination of a red bar and line graph. The graph illustrates a downward trend, starting with high values that progressively decrease over time. The bars are tall initially and shorten as they move rightward, while the line graph follows a similar declining pattern, emphasizing a significant drop in values. Bar chart decrease illustrations Declining trend represented by a bar and line graph on an easel display. The image shows a white easel holding a presentation board with a combination of a red bar and line graph. The graph illustrates a downward trend, starting with high values that progressively decrease over time. The bars are tall initially and shorten as they move rightward, while the line graph follows a similar declining pattern, emphasizing a significant drop in values
Free with trial Decrease graph icon on circle line. Statistic illustration concept. Bar chart decrease vectors Decrease graph icon on circle line. Statistic concept. Decrease graph icon on circle line. Statistic illustration concept
Free with trial Statistic icon in generic style. Decrease graph symbol illustration. Bar chart decrease vectors Statistic icon in generic style. Decrease graph symbol
Free with trial The image illustrates a combination of bar and line graphs to represent business performance trends. The bars show an overall upward trend in growth, while the red line indicates a recent decline after a period of increase. This visualization is often used in financial reports, market analysis, or business presentations to depict fluctuations in data over time, such as revenue, market share, or. Bar chart decrease illustrations Growth and decline in business performance visualized with bar and line graphs. The image illustrates a combination of bar and line graphs to represent business performance trends. The bars show an overall upward trend in growth, while the red line indicates a recent decline after a period of increase. This visualization is often used in financial reports, market analysis, or business presentations to depict fluctuations in data over time, such as revenue, market share, or
Free with trial The image shows a bar graph with a red line trending downward, indicating a significant decline in data points over time. The bars start tall on the left and gradually decrease in height towards the right, with the red line following the same downward trajectory, ending with a large red arrow pointing downwards. Bar chart decrease illustrations A downward trending graph illustrating a significant decline in data points. The image shows a bar graph with a red line trending downward, indicating a significant decline in data points over time. The bars start tall on the left and gradually decrease in height towards the right, with the red line following the same downward trajectory, ending with a large red arrow pointing downwards
Free with trial Colorful bar graph showing market growth and success over time. Bar chart decrease vectors Colorful bar graph showing market growth and success
Free with trial Illustration of a line graph connecting points above bar graph on black. Flat design with blue outlines, orange points, and blue and green bars. Bar chart decrease vectors Line graph and bar graph showing growth and trends, isolated on black background. Illustration of a line graph connecting points above bar graph on black. Flat design with blue outlines, orange points, and blue and green bars.
Free with trial The image shows a bar graph with bars decreasing in height from left to right. The bars transition from light blue to dark blue to red. A prominent red arrow points downwards from the top right corner of the image, emphasizing the downward trend. Bar chart decrease illustrations A downward trending bar graph with a prominent red arrow pointing downwards. The image shows a bar graph with bars decreasing in height from left to right. The bars transition from light blue to dark blue to red. A prominent red arrow points downwards from the top right corner of the image, emphasizing the downward trend
Free with trial A business professional analyzes a cost reduction strategy presented as a decreasing bar graph pointing downwards indicating financial efficiency improvement and effective planning He is using a digital pen to examine the data and implement solutions while utilizing a laptop suggesting technological integration for business growth. Bar chart decrease illustrations Cost Reduction Strategy Analysis with Decreasing Bar Graph and Executive Action Plan Showing Efficiency Improvement and Financial. A business professional analyzes a cost reduction strategy presented as a decreasing bar graph pointing downwards indicating financial efficiency improvement and effective planning He is using a digital pen to examine the data and implement solutions while utilizing a laptop suggesting technological integration for business growth
Free with trial The image features a line graph showing upward trends and a bar chart with various colored bars representing different data points. Bar chart decrease illustrations Graphs and charts illustrating data trends and comparisons in a colorful display. The image features a line graph showing upward trends and a bar chart with various colored bars representing different data points
Free with trial A bar graph showing a downward trend with blue bars and a red arrow pointing downwards, indicating a decline in value over different categories or time periods. Bar chart decrease illustrations Declining trend in sales and revenue over time periods indicated by bar graph. A bar graph showing a downward trend with blue bars and a red arrow pointing downwards, indicating a decline in value over different categories or time periods
Free with trial The image shows three vertical bars with a gradient color scheme from pink to yellow. Each subsequent bar is shorter than the previous one, and there is a right-pointing arrow originating from the shortest bar, suggesting a trend or transition. Bar chart decrease illustrations Gradual decrease in bar heights with directional arrow indicating progression. The image shows three vertical bars with a gradient color scheme from pink to yellow. Each subsequent bar is shorter than the previous one, and there is a right-pointing arrow originating from the shortest bar, suggesting a trend or transition
Free with trial The image shows four separate bar charts, each with bars of different colors and heights. The first chart features a gradient from orange to red, showing an increasing trend. The second chart has blue bars that increase and then decrease slightly. The third chart uses green bars with a steady upward trend. The fourth chart combines purple and blue bars, showing a fluctuating pattern with an. Bar chart decrease illustrations Colorful bar charts displaying varying data trends across four distinct sets. The image shows four separate bar charts, each with bars of different colors and heights. The first chart features a gradient from orange to red, showing an increasing trend. The second chart has blue bars that increase and then decrease slightly. The third chart uses green bars with a steady upward trend. The fourth chart combines purple and blue bars, showing a fluctuating pattern with an
Free with trial Vector Candlestick Chart Pattern on Laptop Screen concept outline icon or sign. Bar chart decrease illustrations Vector Candlestick Chart Pattern on Laptop Screen outline icon or sign
Free with trial Hand drawn bar chart set featuring growth and decline arrows for business analytics. Bar chart decrease vectors Hand drawn bar chart set featuring growth and decline arrows for business analytics
Free with trial The image depicts two sets of bar graphs with upward and downward arrows, illustrating contrasting financial trends. The left side shows a positive growth trend with increasing green bars and upward arrows, while the right side displays a mix of declining and rising red bars with both downward and upward arrows, indicating volatility or mixed performance in financial metrics. Bar chart decrease illustrations Contrasting trends in financial growth and decline through bar and arrow graphics. The image depicts two sets of bar graphs with upward and downward arrows, illustrating contrasting financial trends. The left side shows a positive growth trend with increasing green bars and upward arrows, while the right side displays a mix of declining and rising red bars with both downward and upward arrows, indicating volatility or mixed performance in financial metrics
Free with trial The image shows a bar graph with three bars of decreasing height, representing a downward trend. A red arrow is pointing downwards, emphasizing the decline in values over time. Bar chart decrease illustrations A downward trend graph with a red arrow indicating a decrease in values over time. The image shows a bar graph with three bars of decreasing height, representing a downward trend. A red arrow is pointing downwards, emphasizing the decline in values over time
Free with trial Icon showing black bar graph icon between two horizontal lines on white background keywords: graph, bar. Bar chart decrease illustrations Black bar graph icon between two horizontal lines on white background Keywords: graph, bar
Free with trial A 3D rendered bar graph in descending order shows decline or trend, rendered in pastel shades of blue, green, and purple. Bar chart decrease vectors Colorful descending bar graph illustration, 3D render, on transparent background. A 3D rendered bar graph in descending order shows decline or trend, rendered in pastel shades of blue, green, and purple.
Free with trial A 3d blue bar graph with a downward trend shown by a red arrow. Bar chart decrease illustrations A blue bar graph with a red arrow pointing downward isolated on white background. a 3d blue bar graph with a downward trend shown by a red arrow
Free with trial This stylized bar graph shows a downward trending line, representing decrease or loss in a flat graphic style with blue and gray hues. Bar chart decrease vectors Downward trend graph indicating loss or decline in a modern simple style. This stylized bar graph shows a downward trending line, representing decrease or loss in a flat graphic style with blue and gray hues.
Free with trial Online Crypto Trading vector Candlestick Chart concept outline seamless pattern. Bar chart decrease illustrations Online Crypto Trading vector Candlestick Chart outline seamless pattern
Free with trial A bar graph shows a downward trend line and a flame to represent loss on a black background. Bar chart decrease vectors Burning Losses: Downward Trend Chart with Flame Symbol on Black Background. A bar graph shows a downward trend line and a flame to represent loss on a black background.
Free with trial This image shows a simple 3D bar graph made up of four colorful bars, decreasing in height. The colors are purple, blue, and green. Bar chart decrease vectors Colorful stylized bar graph showing decreasing trends on transparent background. This image shows a simple 3D bar graph made up of four colorful bars, decreasing in height. The colors are purple, blue, and green.
Free with trial A flat illustration showing a financial decline with a bar graph, falling line, and arrow pointing down. It is in a colorful style. Bar chart decrease vectors Financial Downturn Graphic: Stock Chart with Decreasing Value and Falling Arrow. A flat illustration showing a financial decline with a bar graph, falling line, and arrow pointing down. It is in a colorful style.