Free with trial A 3D graphic shows a gold Bitcoin coin next to a blue bar graph with a red downward arrow indicating a trend. Bar chart decrease illustrations 3 D Bitcoin coin with blue bar graph and red downward arrow cryptocurrency finance. A 3D graphic shows a gold Bitcoin coin next to a blue bar graph with a red downward arrow indicating a trend
Free with trial Dark blue background as EU European Union, Europe, silhouette outline map of Germany and increasing rising uptrend bar-chart as economy and industry success. Bar chart decrease illustrations Dark blue background as EU European Union, Europe, silhouette outline map of Germany and increasing rising uptrend bar-chart as
Free with trial Young businessman analyzing a descending financial candlestick chart on a computer screen. Financial Instability concept. trend modern vector flat illustration. Bar chart decrease vectors Young businessman analyzing a descending financial candlestick chart on a computer screen. Financial Instability concept.
Free with trial A visual representation of a financial downturn, featuring a downward-pointing arrow, a dollar coin, and a bar graph indicating a decline. this image depicts economic challenges and potential losses. Bar chart decrease vectors A downward trend with a yellow arrow and a dollar coin in a bar graph on a white background. a visual representation of a financial downturn, featuring a downward-pointing arrow, a dollar coin, and a bar graph indicating a decline. this image depicts economic challenges and potential losses.
Free with trial Analytics graph line icon. Continuous one line with curl. Column chart sign. Growth diagram symbol. Analytics graph single outline ribbon. Loop curve pattern. Vector. Bar chart decrease illustrations Analytics graph line icon. Column chart sign. Continuous line with curl. Vector. Analytics graph line icon. Continuous one line with curl. Column chart sign. Growth diagram symbol. Analytics graph single outline ribbon. Loop curve pattern. Vector
Free with trial The pink chart for business concept 3d rendering. Bar chart decrease illustrations The pink chart for business concept 3d rendering
Free with trial The pink chart for business concept 3d rendering. Bar chart decrease illustrations The pink chart for business concept 3d rendering
Free with trial The pink chart for business concept 3d rendering. Bar chart decrease illustrations The pink chart for business concept 3d rendering
Free with trial The pink chart for business concept 3d rendering. Bar chart decrease illustrations The pink chart for business concept 3d rendering
Free with trial Cylinder objects pattern. Stacked bar elements. Data visualization Vector. Storage capacity illustration. EPS 10. Bar chart decrease vectors Cylinder objects pattern. Stacked bar elements. Data visualization Vector. Storage capacity illustration.
Free with trial A 3D illustration of a bar graph with a blue downward arrow, symbolizing financial decline or loss, isolated on white. Bar chart decrease illustrations Bar Graph with Blue Arrow Pointing Down 3D Illustration Isolated on White Background. A 3D illustration of a bar graph with a blue downward arrow, symbolizing financial decline or loss, isolated on white.
Free with trial Displaying 3D bar columns on analytics dashboard, with overlaid line graph and numeric labels. Data, visualization, dashboard, analytics, infographic, 3d, abstract. Bar chart decrease illustrations Displaying 3D bar columns on analytics dashboard, with overlaid line graph and numeric labels
Free with trial This image features a bar graph representing an economic recession, highlighted by a red downward arrow indicating a decline. The visualization illustrates the negative trend in financial performance and the risks associated with an economic downturn. The background is transparent, making it suitable for various presentations. This image has been created using AI. Bar chart decrease vectors Economic Recession Concept Bar Graph With Red Downward Arrow On Transparent Background. This image features a bar graph representing an economic recession, highlighted by a red downward arrow indicating a decline. The visualization illustrates the negative trend in financial performance and the risks associated with an economic downturn. The background is transparent, making it suitable for various presentations. This image has been created using AI.
Free with trial Graph line icon. Neumorphic, Flat shadow, 3d buttons. Column chart sign. Growth diagram symbol. Line graph chart icon. Social media icons. Vector. Bar chart decrease vectors Graph line icon. Column chart sign. Neumorphic buttons. Vector. Graph line icon. Neumorphic, Flat shadow, 3d buttons. Column chart sign. Growth diagram symbol. Line graph chart icon. Social media icons. Vector
Free with trial Graph line icon. Neumorphic, Flat shadow, 3d buttons. Column chart sign. Ab test diagram symbol. Line graph chart icon. Social media icons. Vector. Bar chart decrease vectors Graph line icon. Column chart sign. Neumorphic buttons. Vector. Graph line icon. Neumorphic, Flat shadow, 3d buttons. Column chart sign. Ab test diagram symbol. Line graph chart icon. Social media icons. Vector
Free with trial Report, 3D Chart, Block diagram and Dot Plot graph linear icons. Design shape elements. Charts and Diagrams line icons. Trend, Pyramid and Pie chart report symbols. Vector. Bar chart decrease vectors Charts and Diagrams line icons. Set of 3D Chart, Block diagram and Dot Plot graph icons. Design elements. Vector. Report, 3D Chart, Block diagram and Dot Plot graph linear icons. Design shape elements. Charts and Diagrams line icons. Trend, Pyramid and Pie chart report symbols. Vector
Free with trial A 3D rendered pink bar graph stands on a white background, with three bars of decreasing height from left to right. A curved pink arrow, also trending downwards, originates from the top of the tallest bar and points towards the right, visually representing a decline or negative trend. Bar chart decrease illustrations Pink bar graph with a downward trending arrow indicating decline on a white background. A 3D rendered pink bar graph stands on a white background, with three bars of decreasing height from left to right. A curved pink arrow, also trending downwards, originates from the top of the tallest bar and points towards the right, visually representing a decline or negative trend
Free with trial A 3D illustration depicting financial concepts. A purple rectangular bar shows a sharp red downward trending arrow. Below it, another purple bar displays a candlestick chart with red and blue bars. To the right, a magnifying glass with an orange handle and turquoise lens hovers, suggesting analysis. A small, colorful pie chart with red, yellow, and blue segments is positioned to the left. The. Bar chart decrease illustrations 3D Financial Downward Trend Chart with Magnifying Glass and Pie Chart finance stock market. A 3D illustration depicting financial concepts. A purple rectangular bar shows a sharp red downward trending arrow. Below it, another purple bar displays a candlestick chart with red and blue bars. To the right, a magnifying glass with an orange handle and turquoise lens hovers, suggesting analysis. A small, colorful pie chart with red, yellow, and blue segments is positioned to the left. The
Free with trial A 3D bar chart displays four bars in descending order of height: green, purple, blue, and pink, set against a white background. Clear details and vibrant colors enhance visual appeal. Bar chart decrease illustrations 3D Bar Chart With Green Purple Blue And Pink Bars In Descending Order graph decrease. A 3D bar chart displays four bars in descending order of height: green. A 3D bar chart displays four bars in descending order of height: green, purple, blue, and pink, set against a white background. Clear details and vibrant colors enhance visual appeal
Free with trial 3D Pie chart icon. Circle divided into parts statistical diagram vector illustration. 3D render. Bar chart decrease vectors 3D Pie chart icon circle divided into parts statistical diagram vector illustration. 3D render.
Free with trial Abstract colorful bar charts display statistical data and financial trend analysis. Bar chart decrease vectors Colorful abstract bar charts representing data analysis and statistical visualization. Abstract colorful bar charts display statistical data and financial trend analysis.
Free with trial Arrangement shows white squares with bar charts, green and red squares with arrows indicating positive and negative trends, and a question mark, on a white background. Bar chart decrease illustrations Bar charts show mixed trends with positive and negative arrows beside a question mark. Arrangement shows white squares with bar charts, green and red squares with arrows indicating positive and negative trends, and a question mark, on a white background
Free with trial Financial chart arrow up and down icon illustration. Growth and decline graph symbol on black circle. Bar chart decrease vectors Financial chart arrow up and down icon. Growth and decline graph symbol on black circle
Free with trial Red bar graph showing a negative trend with a downward arrow against a red wall. Artistic render. Generative AI. Bar chart decrease illustrations Red bar graph showing a negative trend with a downward arrow against a red wall. Generative AI. Red bar graph showing a negative trend with a downward arrow against a red wall. Artistic render. Generative AI
Free with trial A 3D illustration depicting financial growth. A line graph with blue and red data points ascends across a light blue background. Interspersed are green and red candlestick bars, representing market fluctuations. Stacks of gold coins and individual coins with dollar signs are arranged at the base of the chart, symbolizing wealth and investment. Bar chart decrease illustrations 3D Financial Growth Chart with Stacks of Gold Coins and Candlestick Bars finance graph. A 3D illustration depicting financial growth. A line graph with blue and red data points ascends across a light blue background. Interspersed are green and red candlestick bars, representing market fluctuations. Stacks of gold coins and individual coins with dollar signs are arranged at the base of the chart, symbolizing wealth and investment
Free with trial Graph line icon. Continuous one line with curl. Column chart sign. Growth diagram symbol. Graph chart single outline ribbon. Loop curve pattern. Vector. Bar chart decrease vectors Graph line icon. Column chart sign. Continuous line with curl. Vector. Graph line icon. Continuous one line with curl. Column chart sign. Growth diagram symbol. Graph chart single outline ribbon. Loop curve pattern. Vector
Free with trial Graph line icon. Continuous one line with curl. Column chart sign. Growth diagram symbol. Graph chart single outline ribbon. Loop curve pattern. Vector. Bar chart decrease vectors Graph line icon. Column chart sign. Continuous line with curl. Vector. Graph line icon. Continuous one line with curl. Column chart sign. Growth diagram symbol. Graph chart single outline ribbon. Loop curve pattern. Vector
Free with trial Toy figurines arranged on colorful blocks to create a bar graph, representing population growth, demographic trends, and social statistics. Bar chart decrease illustrations Toy figurines standing on colorful blocks forming a bar graph, symbolizing population growth, demographic trends, and social. Toy figurines arranged on colorful blocks to create a bar graph, representing population growth, demographic trends, and social statistics
Free with trial Hand interacting with a red downward trend line against a blue bar graph background image. Generative AI. Bar chart decrease illustrations Hand interacting with a red downward trend line against a blue bar graph background image
Free with trial Graph line icon. Continuous line with share plane. Column chart sign. Growth diagram symbol. 3d heart in speech bubble. Graph chart single line ribbon. Loop curve pattern. Vector. Bar chart decrease illustrations Graph line icon. Column chart sign. Continuous line with plane. Vector. Graph line icon. Continuous line with share plane. Column chart sign. Growth diagram symbol. 3d heart in speech bubble. Graph chart single line ribbon. Loop curve pattern. Vector
Free with trial A 3d rendering of a green bar graph with a red arrow pointing downwards and gold dollar coins. Bar chart decrease illustrations 3d rendering of a green bar graph with a downward trending red arrow and gold dollar coins. A 3d rendering of a green bar graph with a red arrow pointing downwards and gold dollar coins
Free with trial Loss chart outline icon in white and black colors. loss chart flat vector icon from business collection for web, mobile apps and ui. Bar chart decrease vectors Loss chart outline icon in white and black colors. loss chart flat vector icon from business collection for web, mobile apps and
Free with trial 3D rendering of declining bar and line graphs on a grid background. Bar chart decrease illustrations 3D rendering of declining bar and line graphs on a grid background
Free with trial Financial chart displaying a series of candlestick patterns on a digital screen, used for stock data analysis. The chart features vertical bars in orange against a blue background with grid lines. Each candlestick represents price movements within a specific time frame, showcasing market trends. The background includes a blurred assortment of lights and other graphical elements, indicating a financial data interface, likely used for investment portfolio analysis and trading activities. Bar chart decrease illustrations Financial Chart And Stock Data Analysis For Investment Portfolio. Candle Stick Graph For Trade. Financial chart displaying a series of candlestick patterns on a digital screen, used for stock data analysis. The chart features vertical bars in orange against a blue background with grid lines. Each candlestick represents price movements within a specific time frame, showcasing market trends. The background includes a blurred assortment of lights and other graphical elements, indicating a financial data interface, likely used for investment portfolio analysis and trading activities.
Free with trial Graph line icon. Halftone dotted pattern. Gradient icon with grain shadow. Column chart sign. Growth diagram symbol. Line graph chart icon. Various designs. Vector. Bar chart decrease vectors Graph line icon. Column chart sign. Halftone dotted pattern. Vector. Graph line icon. Halftone dotted pattern. Gradient icon with grain shadow. Column chart sign. Growth diagram symbol. Line graph chart icon. Various designs. Vector
Free with trial Declining bar graph on a trolley, showing a downward arrow, stock market trend, loss illustration. Bar chart decrease vectors Declining bar graph on a trolley, showing a downward arrow, stock market trend, loss illustration
Free with trial A colorful bar graph depicting an upward trend with a minor dip, presented as a document icon. The design uses bold colors and clean lines for a modern, data-driven aesthetic. Ideal for presentations or reports. Bar chart decrease illustrations Vibrant Bar Graph on Document Icon: Upward Trend with Slight Dip, Colorful Data Visualization. A colorful bar graph depicting an upward trend with a minor dip, presented as a document icon. The design uses bold colors and clean lines for a modern, data-driven aesthetic. Ideal for presentations or reports
Free with trial Up and down trend chart icon in black circle. Business growth and decline symbol illustration. Bar chart decrease vectors Up and down trend chart icon in black circle. Business growth and decline symbol
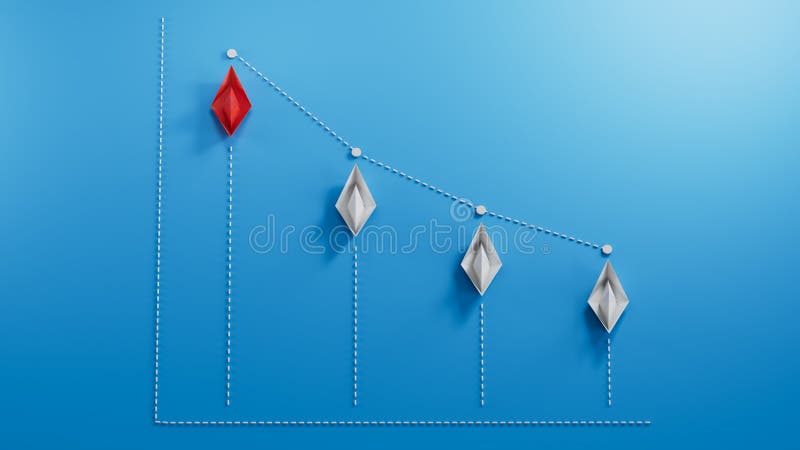
Free with trial Graph and diagram from boats with decrease. Finance and business concepts. 3D Illustration isolated. 3D rendering on blue background. Bar chart decrease illustrations Graph and diagram from boats with decrease. Finance and business concepts. 3D Illustration isolated.
Free with trial Concrete bar graph showing a decline with a downward arrow. Business loss and negative trend concept for financial downturn analysis. Bar chart decrease illustrations Concrete bar graph showing a decline with a downward arrow. Business loss and negative trend concept
Free with trial Germany map and EU design, bar-chart downtrend as black dark crisis of the economy or stock market and business, EU Europe background creative. Bar chart decrease illustrations Germany map and EU design, bar-chart downtrend as black dark crisis of the economy or stock market and business, EU Europe
Free with trial Reduction chart icon vector logo set collection for web app ui. Bar chart decrease vectors Reduction chart icon set depicting data reduction symbols, ideal for business analytics and performance visuals. Reduction chart icon vector logo set collection for web app ui
Free with trial Minimal set of Wholesale goods, Graph chart and Credit card line icons. Phone, cellphone ui interface mockup. Work home icons. For web development. Vector. Bar chart decrease vectors Minimal set of Wholesale goods, Graph chart and Credit card line icons. For web development. Vector. Minimal set of Wholesale goods, Graph chart and Credit card line icons. Phone, cellphone ui interface mockup. Work home icons. For web development. Vector
Free with trial Candlestick chart graph for stock market, financial investment, forex trading and business report concept. Vector illustration. Bar chart decrease vectors Candlestick chart graph for stock market, financial investment
Free with trial A red arrow points downwards over a bar graph indicating a significant financial decrease, isolated on white background. Bar chart decrease illustrations Red downward trending arrow and bar graph showing financial decline isolated on white background. A red arrow points downwards over a bar graph indicating a significant financial decrease, isolated on white background
Free with trial Bar chart with illuminated bars showing an upward trend, depicted against a blurred cityscape at night. Bars increase in height from left to right, symbolizing growth. The glowing blue bars stand out against the dark background, visually representing a bullish financial trend. Various structures and faint lights in the defocused cityscape add context, highlighting the analytical and financial theme. Bar chart decrease illustrations Dynamic stock market chart showing bullish trend after downturn for financial analysis reports and presentations. Bar chart with illuminated bars showing an upward trend, depicted against a blurred cityscape at night. Bars increase in height from left to right, symbolizing growth. The glowing blue bars stand out against the dark background, visually representing a bullish financial trend. Various structures and faint lights in the defocused cityscape add context, highlighting the analytical and financial theme.
Free with trial Falling red arrow superimposed on a bar graph showing business decline trading losses financial ruin Can be used as a banner or header image. Bar chart decrease illustrations Falling red arrow superimposed on a bar graph showing business decline , trading losses, financial ruin. Falling red arrow superimposed on a bar graph showing business decline trading losses financial ruin Can be used as a banner or header image
Free with trial Business and financial concept. Bar graph with a drop-down arrow to show low cost on black background. Bar chart decrease vectors Business and financial concept. Bar graph with drop-down arrow to show low cost on black background
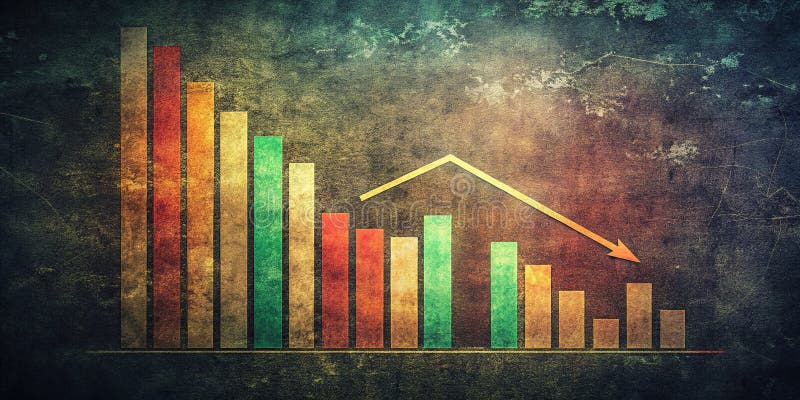
Free with trial This striking vintage-style bar graph, set against a dramatic dark background, visually represents a consistent downward trend in financial data. The muted colors and grainy texture add an authentic, analog feel to the digital visualization, emphasizing the impactful nature of the decline. Ideal for business presentations, financial reports, or investment analysis, this image powerfully. Bar chart decrease illustrations Vintage Bar Graph Depicts Consistent Market Decline A Financial Data Visualization for Trend Analysis. This striking vintage-style bar graph, set against a dramatic dark background, visually represents a consistent downward trend in financial data. The muted colors and grainy texture add an authentic, analog feel to the digital visualization, emphasizing the impactful nature of the decline. Ideal for business presentations, financial reports, or investment analysis, this image powerfully
Free with trial The image depicts a business professional in a suit interacting with a transparent digital chart displaying a declining trend in business performance. The visualization includes green bar charts and a line graph, complemented by a prominent downward arrow and percentage symbol indicating a decrease. This modern digital interface symbolizes data-driven decision-making, financial analysis, and real-time monitoring of business metrics for strategic planning. Bar chart decrease illustrations Business Performance Decline Visualization with Interactive Data Analytics and Percentage Drop Indicator. The image depicts a business professional in a suit interacting with a transparent digital chart displaying a declining trend in business performance. The visualization includes green bar charts and a line graph, complemented by a prominent downward arrow and percentage symbol indicating a decrease. This modern digital interface symbolizes data-driven decision-making, financial analysis, and real-time monitoring of business metrics for strategic planning.
Free with trial Business and financial concept. Bar graph with a drop-down arrow to show low cost on black background. Bar chart decrease vectors Business and financial concept. Bar graph with drop-down arrow to show low cost on black background
Free with trial Business and financial concept. Bar graph with green upper and red lower arrow to show low cost and high quality on black background. Bar chart decrease vectors Business and financial concept. Bar graph with green upper and red lower arrow to show low cost and high quality on black
Free with trial Two sets of three dimensional bar charts. One set shows ascending bars in light colors, shows bars in yellow, beige with decreasing trend. Visual representation aids in data analysis. Bar chart decrease illustrations Two sets of three dimensional bar charts. One set shows ascending bars in light colors, shows bars in yellow, beige with
Free with trial A flat vector illustration depicting a business or financial crisis. A worried man and a concerned woman stand beside a large bar chart. A bold red arrow trends downwards across the graph, symbolizing a market crash, loss, failure, or recession. The modern composition is isolated on a white background with decorative plant elements. This image was created with AI. Bar chart decrease vectors Conceptual illustration of a financial crisis with concerned people looking at a falling red arrow chart. A flat vector illustration depicting a business or financial crisis. A worried man and a concerned woman stand beside a large bar chart. A bold red arrow trends downwards across the graph, symbolizing a market crash, loss, failure, or recession. The modern composition is isolated on a white background with decorative plant elements. This image was created with AI.
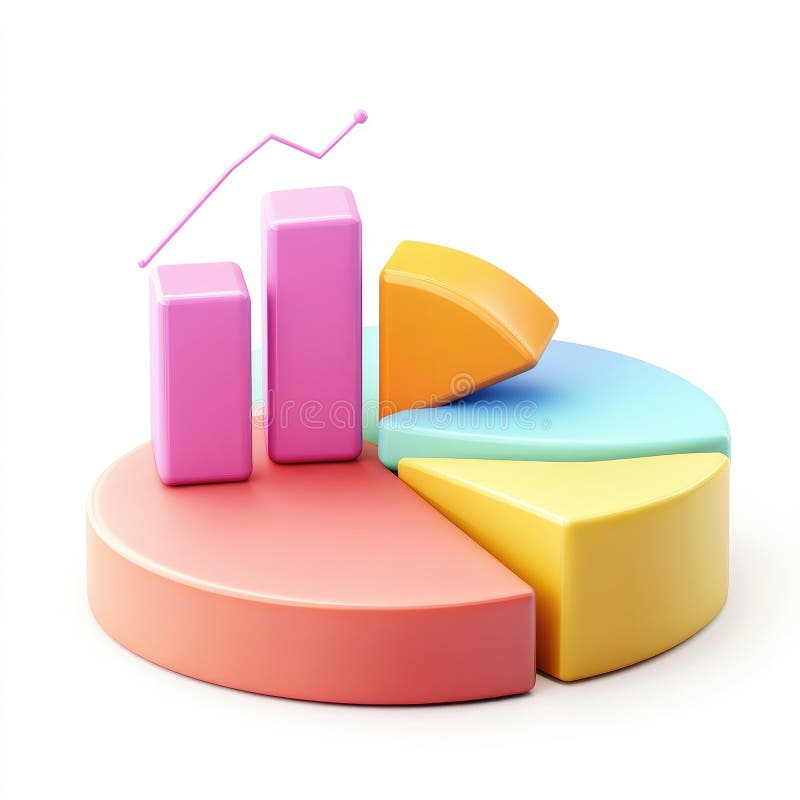
Free with trial This image showcases vibrant 3D bar and pie charts, illustrating growth and statistical data. Perfect for presentations or reports on financial success. Bar chart decrease illustrations Colorful 3D Bar and Pie Charts Showing Business Growth and Statistics. This image showcases vibrant 3D bar and pie charts, illustrating growth and statistical data. Perfect for presentations or reports on financial success.
Free with trial Three light-blue cylindrical shapes, vertically arranged, forming a bar graph, against a pale teal background. Bar chart decrease illustrations Three light-blue cylindrical shapes, vertically arranged, forming a bar graph, against a pale teal background
Free with trial Column chart sign. Salaryman, gender equality and alert bell outline icons. Decreasing graph line icon. Crisis diagram symbol. Spy or profile placeholder icon. Vector. Bar chart decrease vectors Decreasing graph line icon. Crisis chart sign. Salaryman, gender equality and alert bell. Vector. Column chart sign. Salaryman, gender equality and alert bell outline icons. Decreasing graph line icon. Crisis diagram symbol. Decreasing graph line sign. Spy or profile placeholder icon. Vector
Free with trial Column chart sign. Salaryman, gender equality and alert bell outline icons. Decreasing graph line icon. Crisis diagram symbol. Spy or profile placeholder icon. Vector. Bar chart decrease illustrations Decreasing graph line icon. Crisis chart sign. Salaryman, gender equality and alert bell. Vector. Column chart sign. Salaryman, gender equality and alert bell outline icons. Decreasing graph line icon. Crisis diagram symbol. Decreasing graph line sign. Spy or profile placeholder icon. Vector
Free with trial Colorful 3D bar graph illustrating contrasting trends: growth and decline. Symbolizes business fluctuations, market volatility, economic change, opposing forces, and progress. Ideal for promoting your services or creating eye-catching visuals. Open area for featuring your products, copy space, banner, advertisement. . Generative AI. Bar chart decrease illustrations Rising and Falling Bar Graph Colorful 3D bar graph illustrating contrasting trends growth and decline Symbolizes business. Colorful 3D bar graph illustrating contrasting trends: growth and decline. Symbolizes business fluctuations, market volatility, economic change, opposing forces, and progress. Ideal for promoting your services or creating eye-catching visuals. Open area for featuring your products, copy space, banner, advertisement. . Generative AI
Free with trial Businessman in a suit and a bar graph. Business and finance concept. Growth and investment idea. Copy space. Bar chart decrease illustrations Businessman in a suit and a bar graph. Business and finance concept. Growth and investment idea.
Free with trial Businessman in a suit and a bar graph. Business and finance concept. Growth and investment idea. Copy space. Bar chart decrease illustrations Businessman in a suit and a bar graph. Business and finance concept. Growth and investment idea.
Free with trial Businessman in a suit and a bar graph. Business and finance concept. Growth and investment idea. Copy space. Bar chart decrease illustrations Businessman in a suit and a bar graph. Business and finance concept. Growth and investment idea.
Free with trial Set line Browser window Server Data Cloud upload Search engine Graph chart infographic and Financial growth decrease icon. Vector. Bar chart decrease vectors Set line Browser window, Server, Data, Cloud upload, Search engine, Graph chart infographic and Financial growth. Set line Browser window Server Data Cloud upload Search engine Graph chart infographic and Financial growth decrease icon. Vector.
Free with trial A monitor displays a downward trending bar graph, symbolizing financial loss or economic decline. The visual representation emphasizes negative trends and potential risks. Bar chart decrease vectors Vector art of monitor displaying a downward trending bar graph, indicating financial loss or economic decline. A monitor displays a downward trending bar graph, symbolizing financial loss or economic decline. The visual representation emphasizes negative trends and potential risks
Free with trial Set line Laptop with browser window Browser Financial growth decrease and Website stocks market. Business infographic template. Vector. Bar chart decrease illustrations Set line Laptop with browser window, Browser, Financial growth decrease and Website stocks market. Business infographic
Free with trial Red arrow pointing downward on colorful vertical bars. Business financial crisis chart with decreasing trend line. Economic data visualization. Bar chart decrease illustrations Red arrow pointing downward on colorful vertical bars. Business financial crisis chart with decreasing trend line
Free with trial Eight circular icons with black backgrounds each feature a different chart or graph symbol. The frames are bordered by a sequence of colorful lines: red, green, blue, and yellow. The icons include bar graphs, line graphs, a pie chart, and scatter plots, all depicted in white. Each symbol includes axes and grid patterns, indicating statistical or financial data representation. The arrangement is in two rows of four, emphasizing symmetry and variety in chart types. A i Generated. Bar chart decrease vectors Collection of eight different chart and graph icons displayed in circular black frames with colorful borders. Eight circular icons with black backgrounds each feature a different chart or graph symbol. The frames are bordered by a sequence of colorful lines: red, green, blue, and yellow. The icons include bar graphs, line graphs, a pie chart, and scatter plots, all depicted in white. Each symbol includes axes and grid patterns, indicating statistical or financial data representation. The arrangement is in two rows of four, emphasizing symmetry and variety in chart types. A i Generated
Free with trial Market trend icon in comic style. Decline arrow with magnifier cartoon vector illustration on isolated background. Decrease splash effect business concept. Bar chart decrease vectors Market trend icon in comic style. Decline arrow with magnifier cartoon vector illustration on isolated background. Decrease splash
Free with trial Generative ai, The image shows a red tiled wall with a white arrow pointing down and a red bar graph that is decreasing in height. The background is a red tiled wall with white lines, and the floor is a red shiny surface with the reflection of the g. Bar chart decrease illustrations The image shows a red bar graph with a white arrow pointing downwards, representing a declining trend. The graph is set against a. generative ai, The image shows a red tiled wall with a white arrow pointing down and a red bar graph that is decreasing in height. The background is a red tiled wall with white lines, and the floor is a red shiny surface with the reflection of the g
Free with trial Green Financial growth decrease icon isolated on blue background. Increasing revenue. Minimalism concept. 3D render illustration. Bar chart decrease illustrations Green Financial growth decrease icon isolated on blue background. Increasing revenue. Minimalism concept. 3D render
Free with trial Crumbling bar graph made of earth-colored material, symbolizing decline or instability, stands among broken debris on a plain background. Bar chart decrease illustrations A collapsed bar graph made of earth-colored material, symbolizing decline or instability, is set amid broken debris. crumbling bar graph made of earth-colored material, symbolizing decline or instability, stands among broken debris on a plain background.
Free with trial Visual representation of a declining real estate market using a bar chart with houses perched atop each descending bar suggesting a downward trend in property values or sales. Bar chart decrease illustrations Real estate market decline represented by descending bars with miniature houses conceptualizing financial downturn. Visual representation of a declining real estate market using a bar chart with houses perched atop each descending bar suggesting a downward trend in property values or sales
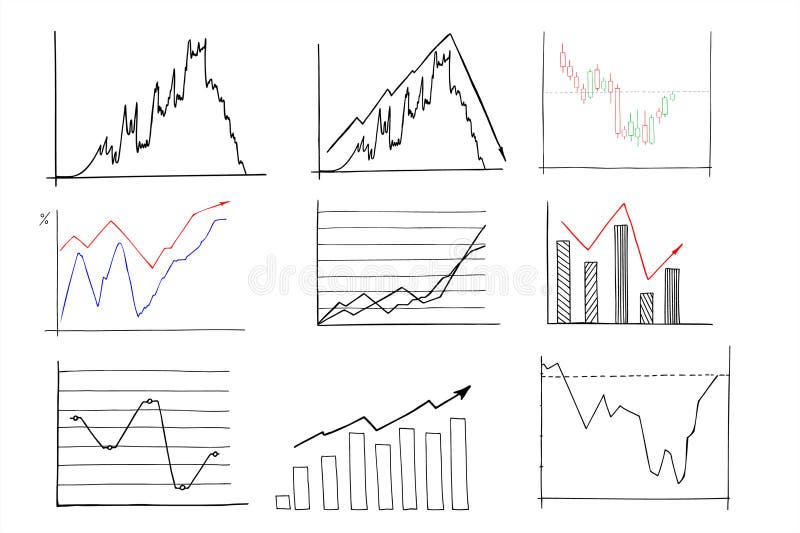
Free with trial A set of hand-drawn financial graph and chart icons. These icons are suitable for business analysis, investment strategies, and economic growth presentations. Bar chart decrease vectors Vector art of hand drawn financial graph and chart icons for business analysis, investment, and economic growth in vector format. A set of hand-drawn financial graph and chart icons. These icons are suitable for business analysis, investment strategies, and economic growth presentations
Free with trial Uptrend or downtrend set on a dark grey to black minimalist studio background, represented by an upward scrolling white columnar bar chart. 3D render visualizing market trend or challenging business. Bar chart decrease illustrations Uptrend or downtrend set on a dark grey to black minimalist studio background, represented by an upward scrolling white columnar
Free with trial Set line Website with stocks market Financial growth decrease Browser window and Cloud technology data transfer icon. Vector. Bar chart decrease illustrations Set line Website with stocks market, Financial growth decrease, Browser window and Cloud technology data transfer icon
Free with trial Hand Drawn Bar Chart Depicting Downward Trend with Arrow Symbolizing Declining Sales or Profits on a White Background. Bar chart decrease vectors Hand Drawn Bar Chart Depicting Downward Trend with Arrow Symbolizing Declining Sales or Profits on a White Background
Free with trial Loss icon logo sign vector outline in black and white color. Bar chart decrease vectors A bar chart icon with a downward trend, representing financial loss or decrease, often used in business or stock market contexts. loss icon logo sign vector outline in black and white color
Free with trial Chart line set. Graph, finance report, income growth, economy statistic, diagram, infographic, mind map, data visualization vector illustration. Outline signs of analytic. Editable Stroke. Bar chart decrease vectors Analytical graphic chart with trend lines, columns set hand drawn ink sketch. Change in time of election results or income, plans. Chart line set. Graph, finance report, income growth, economy statistic, diagram, infographic, mind map, data visualization vector illustration. Outline signs of analytic. Editable Stroke
Free with trial Declining bar graph illustration showing negative trend of business or economic recession or market crash with downward arrow. Bar chart decrease vectors Declining bar graph illustration showing negative trend of business or economic recession or market crash with downward arrow
Free with trial This bar graph visually represents a declining trend, effectively conveying data reduction and downward progression for analytical purposes and interpretation. Bar chart decrease vectors Vector art of declining bar graph showing a downward trend in data representation and visualization for statistical analysis. This bar graph visually represents a declining trend, effectively conveying data reduction and downward progression for analytical purposes and interpretation