Free with trial Isolated showing simple line graph showing downward trend on white background keywords: graph, chart, line graph, downward trend, decline, decrease. Data analysis decrease illustrations Simple Line Graph Showing Downward Trend on White Background Keywords: graph, chart, line graph, downward trend
Free with trial A visual representation of market fluctuations and business performance, with a red downward arrow indicating a decrease and a green upward arrow signifying growth and positive trends. Data analysis decrease illustrations Red down arrow and green up arrow symbols representing financial market trends and business growth. A visual representation of market fluctuations and business performance, with a red downward arrow indicating a decrease and a green upward arrow signifying growth and positive trends
Free with trial A 3D rendered red arrow sign pointing downwards, mounted on a black circular base. The image is set against a plain white background, highlighting the contrast between the red arrow and the dark base. This image can be used to represent decline, decrease, or downward trend in various contexts such as finance, statistics, or presentations. Data analysis decrease illustrations Red Arrow Sign on Black Base. A 3D rendered red arrow sign pointing downwards, mounted on a black circular base. The image is set against a plain white background, highlighting the contrast between the red arrow and the dark base. This image can be used to represent decline, decrease, or downward trend in various contexts such as finance, statistics, or presentations.
Free with trial Displaying jagged red line chart declining on trading screen, with numeric labels and lens-flare. Financial, technology, analytics, investment, data visualization, digital, modern. Data analysis decrease illustrations Displaying jagged red line chart declining on trading screen, with numeric labels and lens-flare
Free with trial Displaying financial chart at digital interface, with blue bars, two line graphs, red decline arrow. Finance, data, analytics, dashboard, technology, investment, digital. Data analysis decrease illustrations Displaying financial chart at digital interface, with blue bars, two line graphs, red decline arrow
Free with trial Displaying dashboard on screen showing red arrow trending down over bar chart and colorful lines. Analytics, visualization, data, performance, digital, insight, metrics. Data analysis decrease illustrations Displaying dashboard on screen showing red arrow trending down over bar chart and colorful lines
Free with trial Loss Graph Neon Sign. Vector Illustration of Analytics Data Symbol. Data analysis decrease vectors Loss Graph Neon Sign
Free with trial Computer screen displaying a webinar with a presenter explaining graphs and charts, recording indicators, audio, and HD video tags. Ideal for e-learning, remote work, business, analytics. Data analysis decrease vectors Online Webinar on Business Metrics with Recording and Data Analytics Representation. Computer screen displaying a webinar with a presenter explaining graphs and charts, recording indicators, audio, and HD video tags. Ideal for e-learning, remote work, business, analytics
Free with trial The Price-to-Earnings (P E) ratio, and how is it used in stock valuation. Data analysis decrease illustrations Financial Market Data Display: Red Stock Market Trend. the Price-to-Earnings (P E) ratio, and how is it used in stock valuation
Free with trial A simple red line graph showing a sharp downward trend with an arrow indicating a significant decrease, symbolizing loss or decline in performance. Data analysis decrease illustrations Red downward trending graph isolated on white background. A simple red line graph showing a sharp downward trend with an arrow indicating a significant decrease, symbolizing loss or decline in performance
Free with trial A simple red line graph showing a sharp downward trend, indicating a significant decrease or loss in value, isolated against a clean white background for clarity. Data analysis decrease illustrations Red downward trending graph isolated on white background. A simple red line graph showing a sharp downward trend, indicating a significant decrease or loss in value, isolated against a clean white background for clarity
Free with trial This infographic-style image visually represents business growth and financial performance through various charts and graphs. A line graph illustrates revenue trends with percentage markers, a donut chart displays market share distribution, and a bar chart shows quarterly profit figures. Icons representing data, growth, and reports are subtly integrated into the background, creating a professional and informative visual for business and finance-related content. Data analysis decrease illustrations Business Growth and Financial Performance Analytics. This infographic-style image visually represents business growth and financial performance through various charts and graphs. A line graph illustrates revenue trends with percentage markers, a donut chart displays market share distribution, and a bar chart shows quarterly profit figures. Icons representing data, growth, and reports are subtly integrated into the background, creating a professional and informative visual for business and finance-related content.
Free with trial Downward blue arrow, hand gesture, and declining bar graph. Ideal for business loss, negative trends, economy, failure, recession setback performance. Simple flat metaphor. Data analysis decrease illustrations Downward Arrow with Hand and Declining Bar Graph Representing Business Loss or Decrease. Downward blue arrow, hand gesture, and declining bar graph. Ideal for business loss, negative trends, economy, failure, recession setback performance. Simple flat metaphor
Free with trial This infographic displays a bar graph illustrating a sharp negative trend. The red line clearly depicts a significant decrease, showcasing concepts like downturn, recession, and loss within a business or financial context. Ideal for presentations, reports, and analyses highlighting negative market trends or economic decline, generated by AI. Data analysis decrease illustrations Decreasing bar graph showing negative trend decline. This infographic displays a bar graph illustrating a sharp negative trend. The red line clearly depicts a significant decrease, showcasing concepts like downturn, recession, and loss within a business or financial context. Ideal for presentations, reports, and analyses highlighting negative market trends or economic decline, generated by AI.
Free with trial Isometric illustration of a woman analyzing a graph with a magnifying glass, laptop, and coins, representing finance and business analysis. Data analysis decrease vectors Woman analyzes graph with magnifying glass and laptop coin. isometric illustration of a woman analyzing a graph with a magnifying glass, laptop, and coins, representing finance and business analysis.
Free with trial This image showcases vibrant 3D bar and line charts, generated by AI, offering a dynamic visual representation of business data. The colorful design effectively communicates trends and comparisons across multiple data sets, providing a clear and engaging overview of key performance indicators. Data analysis decrease illustrations AI-Generated 3D Business Charts. This image showcases vibrant 3D bar and line charts, generated by AI, offering a dynamic visual representation of business data. The colorful design effectively communicates trends and comparisons across multiple data sets, providing a clear and engaging overview of key performance indicators.
Free with trial A hand holds arrows pointing up and down, symbolizing business growth, financial success, investment opportunities, and the analysis of market trends. Data analysis decrease illustrations A hand holding arrows pointing up and down, representing business growth and loss. A hand holds arrows pointing up and down, symbolizing business growth, financial success, investment opportunities, and the analysis of market trends
Free with trial 3d bar chart with orange and green bars on a blue grid background isolated on white. Data analysis decrease illustrations 3d bar chart with orange and green bars on blue grid background graph data. 3d bar chart with orange and green bars on a blue grid background isolated on white
Free with trial A pair of hands holds a sheet of paper displaying a red line graph on a grid pattern the graph illustrates a downward trend, indicating a decline in business, finance or economy the image represents loss, failure, or a recession, generated by AI. Data analysis decrease illustrations Hands holding paper showing a declining red business graph data. a pair of hands holds a sheet of paper displaying a red line graph on a grid pattern the graph illustrates a downward trend, indicating a decline in business, finance or economy the image represents loss, failure, or a recession, generated by AI.
Free with trial Women in technology concept. Analyzing cryptocurrency trends and market data. Collaboration in digital finance research. Vector illustration. Data analysis decrease vectors Women In Technology. Flat Vector. Women in technology concept. Analyzing cryptocurrency trends and market data. Collaboration in digital finance research. Vector illustration.
Free with trial The image depicts a bar graph displayed on an easel, illustrating a downward trend over time. The bars start high on the left and progressively decrease in height towards the right, with a red arrow emphasizing the decline. The graph's y-axis appears to measure an unspecified metric, while the x-axis represents a timeline. Data analysis decrease illustrations Graph showing decline over time. The image depicts a bar graph displayed on an easel, illustrating a downward trend over time. The bars start high on the left and progressively decrease in height towards the right, with a red arrow emphasizing the decline. The graph's y-axis appears to measure an unspecified metric, while the x-axis represents a timeline
Free with trial An illuminated downward arrow with a jagged line signifies a decline, representing negative performance and can be used to illustrate a decrease in business or any downward trend. Data analysis decrease illustrations Declining Arrow Shows Downtrend and Negative Performance. An illuminated downward arrow with a jagged line signifies a decline, representing negative performance and can be used to illustrate a decrease in business or any downward trend
Free with trial A businesswoman presents data graphs and charts on a whiteboard during a meeting in a modern office setting. The scene is minimalist and uses a dark blue color palette, emphasizing the data visualization. The image depicts a professional work environment. Data analysis decrease illustrations Businesswoman Giving Presentation. A businesswoman presents data graphs and charts on a whiteboard during a meeting in a modern office setting. The scene is minimalist and uses a dark blue color palette, emphasizing the data visualization. The image depicts a professional work environment.
Free with trial A visual representation of financial losses or declining market trends, ideal for economic reports and business analysis presentations. Data analysis decrease illustrations Bar chart showing a significant decline, emphasized by a red arrow pointing downwards and a magnifying glass. A visual representation of financial losses or declining market trends, ideal for economic reports and business analysis presentations
Free with trial The image shows a visual representation of a downward trend using a bar chart and a bold red arrow pointing downward. The chart is displayed on a light-colored easel with a small figure standing behind it, suggesting a presentation or analysis of decreasing values over time, possibly in a business or financial context. Data analysis decrease illustrations Declining trend illustrated with bar chart and arrow on easel. The image shows a visual representation of a downward trend using a bar chart and a bold red arrow pointing downward. The chart is displayed on a light-colored easel with a small figure standing behind it, suggesting a presentation or analysis of decreasing values over time, possibly in a business or financial context
Free with trial Red falling arrow and declining chart with stock market data overlay on office interior background, symbolizing global financial collapse impact. Data analysis decrease illustrations Financial market crash with red downward arrow and stock graph lines descending sharply over modern office background during. Red falling arrow and declining chart with stock market data overlay on office interior background, symbolizing global financial collapse impact
Free with trial A high-tech illustration of a glowing blue -2% percentage symbol displayed in a sleek, modern office environment. Surrounded by digital data icons and futuristic charts, this image is perfect for representing concepts like small financial losses, minor discounts, data drops, business trends, or analytical reports. Ideal for presentations, websites, digital marketing, or economic graphics. Data analysis decrease illustrations Glowing -2% Discount Graphic in Modern Office Environment. A high-tech illustration of a glowing blue -2% percentage symbol displayed in a sleek, modern office environment. Surrounded by digital data icons and futuristic charts, this image is perfect for representing concepts like small financial losses, minor discounts, data drops, business trends, or analytical reports. Ideal for presentations, websites, digital marketing, or economic graphics.
Free with trial Collection of various red infographic elements including charts, graphs, diagrams, and symbols, perfect for presentations and data visualization. Ideal for showcasing data trends, progress, and comparisons. Easily customizable and adaptable to diverse projects. Data analysis decrease illustrations Red Infographic Elements
Free with trial A graph shows a downward trend. Green bars diminish in height along a timeline. A red arrow underscores the downward movement of the data on the timeline. Data analysis decrease illustrations Decreasing graph showing green bars plunging downward with a red arrow indication. A graph shows a downward trend. Green bars diminish in height along a timeline. A red arrow underscores the downward movement of the data on the timeline
Free with trial This vibrant 3D bar chart illustrates strong business growth and upward progress. The colorful, glossy bars represent data points, clearly showing an increase. Ideal for presentations and reports. Data analysis decrease illustrations Colorful 3D Bar Chart Showing Business Growth and Progress. This vibrant 3D bar chart illustrates strong business growth and upward progress. The colorful, glossy bars represent data points, clearly showing an increase. Ideal for presentations and reports.
Free with trial Interface displaying downward-trending bar chart and dotted line on dashboard, with ticker symbols. Finance, analytics, data visualization, investment, technological, corporate, digital. Data analysis decrease illustrations Interface displaying downward-trending bar chart and dotted line on dashboard, with ticker symbols
Free with trial This futuristic visualization, generated by AI, depicts a global Bitcoin network, highlighting its worldwide reach and digital infrastructure. Data streams and interactive elements showcase the complex interplay of transactions and information flow within the cryptocurrency ecosystem. Data analysis decrease illustrations Global Bitcoin Network
Free with trial Blue upward bar graph with arrow and falling coin near a sad face. Ideal for finance, economy, investment risks, financial loss, market analysis, emotional impact, business strategies. Simple flat. Data analysis decrease vectors Financial growth with unhappy outcome reflected by increasing bar chart, falling coin, and sad face. Blue upward bar graph with arrow and falling coin near a sad face. Ideal for finance, economy, investment risks, financial loss, market analysis, emotional impact, business strategies. Simple flat
Free with trial A striking 3D rendering features an abstract bar graph composed of numerous translucent blue rectangular blocks against a dark, almost black, background. The varying heights of the blocks create a dynamic visual representation of data, statistics, or growth trends. This modern and futuristic design is ideal for illustrating concepts related to business, finance, technology, analytics, market research, or digital information in presentations, reports, websites, and corporate media. Data analysis decrease illustrations Abstract 3D Blue Bar Graph Visualization. A striking 3D rendering features an abstract bar graph composed of numerous translucent blue rectangular blocks against a dark, almost black, background. The varying heights of the blocks create a dynamic visual representation of data, statistics, or growth trends. This modern and futuristic design is ideal for illustrating concepts related to business, finance, technology, analytics, market research, or digital information in presentations, reports, websites, and corporate media.
Free with trial Dollar icon crossed out with arrow moving away from a digital dashboard featuring charts, graphs, and media content. Ideal for finance, budget management, loss analysis, expense tracking, resource. Data analysis decrease vectors Money flowing away from online analytics dashboard indicating financial loss or expense tracking. Dollar icon crossed out with arrow moving away from a digital dashboard featuring charts, graphs, and media content. Ideal for finance, budget management, loss analysis, expense tracking, resource
Free with trial A vibrant circular chart displaying a twenty percent decrease with bright colors and clean design, ideal for business, finance, and analytics presentations. Data analysis decrease illustrations Colorful Circular Chart with Percentage Reduction in Modern Data Visualization Style. A vibrant circular chart displaying a twenty percent decrease with bright colors and clean design, ideal for business, finance, and analytics presentations
Free with trial Visual representation of financial trends with euro symbols, depicting both upward and downward movements in bar graph format, suitable for economic analysis. Data analysis decrease vectors Bar charts showing euro currency growth and decline isolated on transparent background. Visual representation of financial trends with euro symbols, depicting both upward and downward movements in bar graph format, suitable for economic analysis
Free with trial Graphs set with line charts, bar charts, and scatter plots illustrating upward and downward trends with arrows and data points. Data analysis decrease vectors Graphs set with line charts, bar charts, and scatter plots illustrating upward and
Free with trial 3D illustration of a red bar chart with a downward arrow, isolated on a transparent background. Symbolizes financial loss, economic crisis, revenue drop, or business decline. Ideal for presentations, finance reports, investment warnings, stock market analysis, and economic downturn visuals. Data analysis decrease illustrations 3D Red Downward Arrow Graph Icon Showing Financial Decline on Transparent Background. 3D illustration of a red bar chart with a downward arrow, isolated on a transparent background. Symbolizes financial loss, economic crisis, revenue drop, or business decline. Ideal for presentations, finance reports, investment warnings, stock market analysis, and economic downturn visuals.
Free with trial A 3D illustration of a statistic down icon isolated on a white background symbolizing decline in data or business performance. Data analysis decrease illustrations Statistic down 3D illustration. A 3D illustration of a statistic down icon isolated on a white background symbolizing decline in data or business performance
Free with trial A 3D illustration of a statistic down icon isolated on a white background symbolizing decline in data or business performance. Data analysis decrease illustrations Statistic down 3D illustration. A 3D illustration of a statistic down icon isolated on a white background symbolizing decline in data or business performance
Free with trial A conceptual vector illustration depicting the duality of business performance. On a modern teal background, two reports are shown side-by-side. One features a rising red graph symbolizing growth, profit, and success, while the other displays a descending graph representing decline, loss, and failure. This flat design graphic is ideal for financial analysis, market trend comparisons, business presentations, and infographics illustrating opposite outcomes or strategic choices. The long shadow effect adds a contemporary feel to the design. Data analysis decrease vectors Growth and Decline Business Charts Comparison. A conceptual vector illustration depicting the duality of business performance. On a modern teal background, two reports are shown side-by-side. One features a rising red graph symbolizing growth, profit, and success, while the other displays a descending graph representing decline, loss, and failure. This flat design graphic is ideal for financial analysis, market trend comparisons, business presentations, and infographics illustrating opposite outcomes or strategic choices. The long shadow effect adds a contemporary feel to the design.
Free with trial Brightly colored wooden blocks arranged as a bar graph with one block falling represents decline Use for financial or business illustrations. Data analysis decrease illustrations Colorful Wooden Blocks Forming a Graph, One Falling, on Data Chart. Brightly colored wooden blocks arranged as a bar graph with one block falling represents decline Use for financial or business illustrations
Free with trial A magnifying glass focuses on a vibrant bar graph, symbolizing financial growth and investment opportunities. Stacks of gold coins rest on a financial report, enhancing the visual representation of wealth and prosperity. This 3D rendering, generated by AI, is ideal for illustrating financial concep. Data analysis decrease illustrations Financial Growth Analysis. A magnifying glass focuses on a vibrant bar graph, symbolizing financial growth and investment opportunities. Stacks of gold coins rest on a financial report, enhancing the visual representation of wealth and prosperity. This 3D rendering, generated by AI, is ideal for illustrating financial concep
Free with trial An eye-catching 3D bar graph illustration with yellow, blue, and red elements. It is designed to represent data or growth concepts. Data analysis decrease vectors Colorful 3D bar graph illustration showing descending values on transparent background. An eye-catching 3D bar graph illustration with yellow, blue, and red elements. It is designed to represent data or growth concepts.
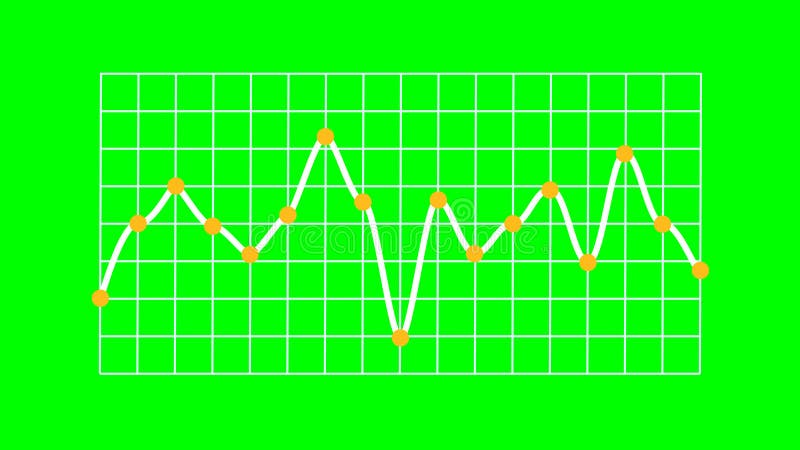
Free with trial Rendered line graph showing a single white line indicating data trends with distinct fluctuations. Yellow marker points animate vertically from the X-axis, and each plotted value features an orange circular dot. The white line runs over a structured white grid on a bright green screen background, enabling chroma keying. No axis values or units are present, emphasizing visual representation of abstract data and business trends. Data analysis decrease illustrations Business Trend Line Graph Showing Trading on Green Screen. Rendered line graph showing a single white line indicating data trends with distinct fluctuations. Yellow marker points animate vertically from the X-axis, and each plotted value features an orange circular dot. The white line runs over a structured white grid on a bright green screen background, enabling chroma keying. No axis values or units are present, emphasizing visual representation of abstract data and business trends.
Free with trial This image depicts a computer screen displaying a sharply declining stock market graph, generated by AI. The red line dramatically illustrates a significant market downturn, accompanied by numerous data points and financial indicators. The dark aesthetic enhances the sense of urgency and potential. Data analysis decrease illustrations AI-Generated Stock Market Decline. This image depicts a computer screen displaying a sharply declining stock market graph, generated by AI. The red line dramatically illustrates a significant market downturn, accompanied by numerous data points and financial indicators. The dark aesthetic enhances the sense of urgency and potential
Free with trial Hand presents a declining bar graph illustrating cost reduction, creating a compelling business visual Perfect for presentations and financial analysis. Data analysis decrease illustrations Presenting Cost Reduction with Graph and Hand. Hand presents a declining bar graph illustrating cost reduction, creating a compelling business visual Perfect for presentations and financial analysis
Free with trial Flat design business icons depict various charts, percentage signs, targets, hierarchical diagrams, and coin stacks representing financial growth and data analysis in monochrome. Generative AI. Data analysis decrease vectors Black and white flat design business icons including charts percentage target and money stacks illustrating financial growth and. Flat design business icons depict various charts, percentage signs, targets, hierarchical diagrams, and coin stacks representing financial growth and data analysis in monochrome. Generative AI
Free with trial A minimalist, black and white vector icon representing a bar chart or graph. The icon features a series of vertical bars of varying heights, set against a base of horizontal lines. This clean and modern design is ideal for representing data, statistics, progress, growth, or financial information in digital and print media. Its simple aesthetic makes it versatile for use in presentations, websites, apps, and infographics. Data analysis decrease vectors Abstract Bar Chart Icon. A minimalist, black and white vector icon representing a bar chart or graph. The icon features a series of vertical bars of varying heights, set against a base of horizontal lines. This clean and modern design is ideal for representing data, statistics, progress, growth, or financial information in digital and print media. Its simple aesthetic makes it versatile for use in presentations, websites, apps, and infographics.
Free with trial This image showcases a person using a tablet to interact with business analytics data, generated by AI. The visualization includes graphs and charts, providing real-time insights into key performance indicators. This technology streamlines business decision-making. Data analysis decrease illustrations AI-Powered Business Analytics. This image showcases a person using a tablet to interact with business analytics data, generated by AI. The visualization includes graphs and charts, providing real-time insights into key performance indicators. This technology streamlines business decision-making.
Free with trial This image shows a downward-trending red arrow graph, generated by AI, illustrating a significant decline. The visual representation is clear and effective in communicating a negative trend, potentially in stock prices, sales figures, or other quantifiable data. Data analysis decrease illustrations Downward Trending Graph. This image shows a downward-trending red arrow graph, generated by AI, illustrating a significant decline. The visual representation is clear and effective in communicating a negative trend, potentially in stock prices, sales figures, or other quantifiable data.
Free with trial This image displays a bar graph visualizing a clear downward trend. Nine vertical blue bars gradually decrease in height from left to right, signifying a consistent decline in values. A white arrowed line diagonally descends across the graph, reinforcing the negative trend. Blue horizontal and vertical grid lines aid in alignment. The background is green screen, allowing for chroma key use. This chart effectively communicates decline in areas like business, finance, or performance. Data analysis decrease illustrations Downward Bar Graph Showing Financial Decline on Green Screen. This image displays a bar graph visualizing a clear downward trend. Nine vertical blue bars gradually decrease in height from left to right, signifying a consistent decline in values. A white arrowed line diagonally descends across the graph, reinforcing the negative trend. Blue horizontal and vertical grid lines aid in alignment. The background is green screen, allowing for chroma key use. This chart effectively communicates decline in areas like business, finance, or performance.
Free with trial A world map with a grid overlay, featuring two trend lines in blue and orange. The blue line starts high on the left sid. Data analysis decrease illustrations Global Trend Analysis Map. A world map with a grid overlay, featuring two trend lines in blue and orange. The blue line starts high on the left sid.
Free with trial A vibrant red, three-dimensional zigzag arrow sharply points downwards and to the right, set against a transparent background. This striking graphic effectively symbolizes decline, loss, and negative trends across various sectors. It is ideal for illustrating financial downturns, market crashes, economic recessions, falling stock prices, or any situation depicting a decrease in performance. Perfect for business presentations, financial reports, infographics, and news articles requiring a clear visual representation of a downward trajectory or crisis. Data analysis decrease illustrations Red Downward Zigzag Arrow on Transparent Background. A vibrant red, three-dimensional zigzag arrow sharply points downwards and to the right, set against a transparent background. This striking graphic effectively symbolizes decline, loss, and negative trends across various sectors. It is ideal for illustrating financial downturns, market crashes, economic recessions, falling stock prices, or any situation depicting a decrease in performance. Perfect for business presentations, financial reports, infographics, and news articles requiring a clear visual representation of a downward trajectory or crisis.
Free with trial A set of black icons representing percentage changes, including arrows and circular symbols. The icons depict various concepts such as decrease, increase, and rotation, all incorporating percentage signs. The simple design makes them versatile for use in financial, statistical, or educational materials. Data analysis decrease illustrations Black percentage icons set. A set of black icons representing percentage changes, including arrows and circular symbols. The icons depict various concepts such as decrease, increase, and rotation, all incorporating percentage signs. The simple design makes them versatile for use in financial, statistical, or educational materials.
Free with trial This image displays a financial growth chart, featuring both a candlestick chart and a bar graph, laid out on a wooden surface. The candlestick chart illustrates stock market fluctuations with red and green candles, while the bar graph shows increasing values over time. The overall composition suggests positive financial trends, investment performance, and economic progress. It's ideal for representing concepts like business growth, market analysis, financial planning, and investment strategies. Data analysis decrease illustrations Financial Growth Chart with Candlestick and Bar Graph. This image displays a financial growth chart, featuring both a candlestick chart and a bar graph, laid out on a wooden surface. The candlestick chart illustrates stock market fluctuations with red and green candles, while the bar graph shows increasing values over time. The overall composition suggests positive financial trends, investment performance, and economic progress. It's ideal for representing concepts like business growth, market analysis, financial planning, and investment strategies.
Free with trial Abstract 3D render of a descending bar chart made of blue glass rectangles. The bars are reflected on a glossy surface, creating a clean and modern aesthetic. The image can be used to represent data visualization, financial trends, business performance, or concepts like decline, recession, or negative growth. The cool blue color palette adds a sense of calm and professionalism. Data analysis decrease illustrations Abstract Blue Glass Bar Chart. Abstract 3D render of a descending bar chart made of blue glass rectangles. The bars are reflected on a glossy surface, creating a clean and modern aesthetic. The image can be used to represent data visualization, financial trends, business performance, or concepts like decline, recession, or negative growth. The cool blue color palette adds a sense of calm and professionalism.
Free with trial The image depicts a bar graph with three vertical bars of decreasing height, accompanied by a red downward arrow. The tallest bar is dark blue, the middle bar is light blue, and the shortest bar is light cyan. The red arrow signifies a downward trend or decline in performance or data. Data analysis decrease illustrations Decline in performance graph. The image depicts a bar graph with three vertical bars of decreasing height, accompanied by a red downward arrow. The tallest bar is dark blue, the middle bar is light blue, and the shortest bar is light cyan. The red arrow signifies a downward trend or decline in performance or data
Free with trial Black filled database icon with downward arrow representing decrease, reduction, or lower status. Data analysis decrease vectors Database Downward Arrow Icon. Black filled database icon with downward arrow representing decrease, reduction, or lower status.
Free with trial Abstract illustration of a downward trending arrow chart. The arrows are depicted in varying shades of blue and green, suggesting a gradual decline. This image can be used to represent concepts such as loss, decrease, negative growth, or a downward trend in various fields like finance, sales, or performance metrics. The clean background and simple design make it versatile for presentations, reports, and infographics. Data analysis decrease illustrations Decreasing Trend Arrow Chart. Abstract illustration of a downward trending arrow chart. The arrows are depicted in varying shades of blue and green, suggesting a gradual decline. This image can be used to represent concepts such as loss, decrease, negative growth, or a downward trend in various fields like finance, sales, or performance metrics. The clean background and simple design make it versatile for presentations, reports, and infographics.
Free with trial Growth, decline, increase, decrease concepts. Two arrows, one blue pointing up and one red pointing down, symbolize opposite trends or choices on a minimalist white background. 3D render. Data analysis decrease illustrations Blue arrow pointing up and red arrow pointing down representing opposite directions. Growth, decline, increase, decrease concepts. Two arrows, one blue pointing up and one red pointing down, symbolize opposite trends or choices on a minimalist white background. 3D render
Free with trial The image depicts a flip chart with a combination of a bar graph and a line graph, both showing a downward trend. The bar graph starts with taller bars that gradually decrease in height, indicating a decline over time. The line graph above it also trends downward, reinforcing the concept of a negative trajectory or economic downturn. The visual is likely used to represent financial loss, market. Data analysis decrease illustrations Economic decline illustrated by a combination of bar and line graphs on a flip chart. The image depicts a flip chart with a combination of a bar graph and a line graph, both showing a downward trend. The bar graph starts with taller bars that gradually decrease in height, indicating a decline over time. The line graph above it also trends downward, reinforcing the concept of a negative trajectory or economic downturn. The visual is likely used to represent financial loss, market
Free with trial A financial chart showing declining index lines in blue shades on a grid-style white background. Concept of market analysis and trends. 3D Rendering. Data analysis decrease illustrations Financial chart with declining index lines on grid background. 3D Rendering. A financial chart showing declining index lines in blue shades on a grid-style white background. Concept of market analysis and trends. 3D Rendering
Free with trial An abstract image featuring four cylindrical shapes of varying heights, arranged in a descending order. The cylinders are dark, with the tops illuminated by a warm, golden light. The background gradients from a warm orange to a darker brown, creating a sense of depth and mystery. This image conveys concepts of decline, progress, or stages, and can be used to represent business trends, data visualization, or abstract concepts. Data analysis decrease illustrations Abstract Cylinders in Dim Light. An abstract image featuring four cylindrical shapes of varying heights, arranged in a descending order. The cylinders are dark, with the tops illuminated by a warm, golden light. The background gradients from a warm orange to a darker brown, creating a sense of depth and mystery. This image conveys concepts of decline, progress, or stages, and can be used to represent business trends, data visualization, or abstract concepts.
Free with trial A striking 3D rendering showcases a red bar chart dramatically illustrating an economic downturn and financial decline. The downward trending bar chart, emphasized by a prominent red color and a downward-pointing arrow, conveys a sense of decrease and loss within business, finance, and the global economy. This graphic effectively represents concepts such as recession, a bearish market, and. Data analysis decrease illustrations Red bar chart depicting economic downturn or financial decline business and investment concerns. A striking 3D rendering showcases a red bar chart dramatically illustrating an economic downturn and financial decline. The downward trending bar chart, emphasized by a prominent red color and a downward-pointing arrow, conveys a sense of decrease and loss within business, finance, and the global economy. This graphic effectively represents concepts such as recession, a bearish market, and
Free with trial Mobile phone screen displaying a cryptocurrency trading application for Bitcoin. The interface shows a financial candlestick chart with growth analysis, a Bitcoin coin icon, and a fingerprint scanner for secure transactions. Vector illustration isolated on white background. Data analysis decrease illustrations Smartphone with Bitcoin cryptocurrency trading app interface on screen showing financial chart and fingerprint security. Mobile phone screen displaying a cryptocurrency trading application for Bitcoin. The interface shows a financial candlestick chart with growth analysis, a Bitcoin coin icon, and a fingerprint scanner for secure transactions. Vector illustration isolated on white background
Free with trial An illustration of a green arrow pointing upwards and a red arrow pointing downwards on a graph background. The green arrow represents growth or increase, while the red arrow represents decline or decrease. The image can be used to symbolize contrasting trends or outcomes in various contexts such as business, finance, or economics. Data analysis decrease illustrations Green and Red Arrows on a Graph. An illustration of a green arrow pointing upwards and a red arrow pointing downwards on a graph background. The green arrow represents growth or increase, while the red arrow represents decline or decrease. The image can be used to symbolize contrasting trends or outcomes in various contexts such as business, finance, or economics.
Free with trial This minimalist graphic illustration features a bold red line chart indicating a significant decline. The visual composition uses a clean white background to emphasize the downward trajectory of the data points. The aesthetic is professional and modern, suitable for business presentations or financial reports. Data analysis decrease vectors A red line graph showing a downward trend on a white background. This minimalist graphic illustration features a bold red line chart indicating a significant. This minimalist graphic illustration features a bold red line chart indicating a significant decline. The visual composition uses a clean white background to emphasize the downward trajectory of the data points. The aesthetic is professional and modern, suitable for business presentations or financial reports
Free with trial A 3D line graph showing a downward trend with a red arrow pointing downwards, indicating a decline in data or financial performance. The graph is set against a grid background with a professional and ultra-detailed quality. Data analysis decrease illustrations Downward Trend Graph with Red Arrow. A 3D line graph showing a downward trend with a red arrow pointing downwards, indicating a decline in data or financial performance. The graph is set against a grid background with a professional and ultra-detailed quality.
Free with trial A 3D graph chart on a plain white background, representing data visualization and statistics. Data analysis decrease illustrations 3D Graph Chart on White Background. A 3D graph chart on a plain white background, representing data visualization and statistics
Free with trial A minimalistic 3D bar chart with descending glossy columns in blue and green is displayed on a white background. This image represents decline, analysis, and market trends. Data analysis decrease illustrations Minimalistic 3D bar chart with descending glossy columns in blue and green on a white background. A minimalistic 3D bar chart with descending glossy columns in blue and green is displayed on a white background. This image represents decline, analysis, and market trends
Free with trial A visual representation of financial data showing a decline in performance, with red bars and arrows indicating a downward trend in the market. Data analysis decrease illustrations Bar chart with downward trend isolated on white background. A visual representation of financial data showing a decline in performance, with red bars and arrows indicating a downward trend in the market
Free with trial The image depicts a bar chart with yellow bars of decreasing height from left to right, indicating a downward trend. A red line with an arrowhead follows the tops of the bars, reinforcing the declining pattern. The arrowhead at the end of the line points downward to the right, symbolizing a reduction or decrease over time. Data analysis decrease illustrations Graph showing a downward trend with a red arrow and yellow bars. The image depicts a bar chart with yellow bars of decreasing height from left to right, indicating a downward trend. A red line with an arrowhead follows the tops of the bars, reinforcing the declining pattern. The arrowhead at the end of the line points downward to the right, symbolizing a reduction or decrease over time
Free with trial This 3D rendering shows a bar graph of increasing value, represented by white bars, alongside stacks of gold coins, visually depicting financial growth. The image was generated by AI, showcasing the potential of AI in visualizing financial data. Data analysis decrease illustrations AI-Generated Financial Growth Chart. This 3D rendering shows a bar graph of increasing value, represented by white bars, alongside stacks of gold coins, visually depicting financial growth. The image was generated by AI, showcasing the potential of AI in visualizing financial data.
Free with trial A futuristic digital illustration depicts a world map with a dark background composed of small blue and green dots arranged in a dotted pattern to create depth and dimension, featuring a prominent downward-trending line graph at its center surrounded by a darker green line that represents declining financial data or stock market performance, creating a technological visualization of the global. Data analysis decrease illustrations Digital world map with dotted pattern showing global economic downturn on dark background. A futuristic digital illustration depicts a world map with a dark background composed of small blue and green dots arranged in a dotted pattern to create depth and dimension, featuring a prominent downward-trending line graph at its center surrounded by a darker green line that represents declining financial data or stock market performance, creating a technological visualization of the global
Free with trial Green chart visualizing a downward trend, indicating a decline in values ,Generative ai. Data analysis decrease illustrations Declining values, green chart depicts a downward trend and financial analysis green. Green chart visualizing a downward trend, indicating a decline in values ,Generative ai
Free with trial A set of declining bar and line graphs displayed on a grid background. 3D Rendering. Concept of financial decline and analysis. Data analysis decrease illustrations Declining Bar and Line Graphs on Grid Background. 3D Rendering. A set of declining bar and line graphs displayed on a grid background. 3D Rendering. Concept of financial decline and analysis
Free with trial Four distinct blue bar charts, each adorned with euro symbols, visually representing financial data with trends of both growth and decline, isolated on a white background. Data analysis decrease vectors Four blue bar charts with euro symbols showing growth and decline, isolated on transparent background. Four distinct blue bar charts, each adorned with euro symbols, visually representing financial data with trends of both growth and decline, isolated on a white background