Free with trial Graph with arrow down outline icon, symbolizing a downward trend or decrease in data. Perfect for financial reports, stock market analysis, and performance tracking. Data analysis decrease vectors Professional Graph with Downward Arrow Vector Illustration for Business Presentations. Graph with arrow down outline icon, symbolizing a downward trend or decrease in data. Perfect for financial reports, stock market analysis, and performance tracking.
Free with trial The flag of Mexico with declining stock market graph and financial data overlay, symbolizing economic downturn, recession, or bearish market trends. Data analysis decrease illustrations The flag of Mexico with declining stock market graph and financial data overlay
Free with trial The flag of Jordan with declining stock market graph and financial data overlay, symbolizing economic downturn, recession, or bearish market trends. Data analysis decrease illustrations The flag of Jordan with declining stock market graph and financial data overlay
Free with trial Graph with arrow down outline icon, symbolizing a downward trend or decrease in data. Perfect for financial reports, stock market analysis, and performance tracking. Data analysis decrease vectors Professional Graph with Downward Arrow Vector Illustration for Business Presentations. Graph with arrow down outline icon, symbolizing a downward trend or decrease in data. Perfect for financial reports, stock market analysis, and performance tracking.
Free with trial Graph with arrow down outline icon, symbolizing a downward trend or decrease in data. Perfect for financial reports, stock market analysis, and performance tracking. Data analysis decrease vectors Professional Graph with Downward Arrow Vector Illustration for Business Presentations. Graph with arrow down outline icon, symbolizing a downward trend or decrease in data. Perfect for financial reports, stock market analysis, and performance tracking.
Free with trial Graph with arrow down outline icon, symbolizing a downward trend or decrease in data. Perfect for financial reports, stock market analysis, and performance tracking. Data analysis decrease vectors Professional Graph with Downward Arrow Vector Illustration for Business Presentations. Graph with arrow down outline icon, symbolizing a downward trend or decrease in data. Perfect for financial reports, stock market analysis, and performance tracking.
Free with trial Magnifying glass focuses on stock market chart details. Analyzing trends changes. Financial data in focus. Investment strategy. Visual representation of market trends. Studying market. Data analysis decrease illustrations Magnifying glass focuses on stock market chart details. Analyzing trends, changes. Financial data in focus. Investment strategy. Magnifying glass focuses on stock market chart details. Analyzing trends changes. Financial data in focus. Investment strategy. Visual representation of market trends. Studying market.
Free with trial Set Isometric Server security with padlock, Financial growth decrease, and icon. Vector. Data analysis decrease illustrations Set Isometric Server security with padlock, Financial growth decrease, and icon. Vector
Free with trial Red bar graph shows decline with downward arrow, representing financial loss. Business failure reduced performance or decrease of value. Negative trend report. Data analysis decrease illustrations Red bar graph shows decline with downward arrow, representing financial loss. Business failure, reduced performance or decrease. Red bar graph shows decline with downward arrow, representing financial loss. Business failure reduced performance or decrease of value. Negative trend report.
Free with trial A wall display of framed blue data charts and graphs showing various financial trends and statistical information. A captivating fusion of imagination and modern design aesthetics. Generative AI. Data analysis decrease illustrations A wall display of framed blue data charts and graphs showing various financial trends and statistical information. Generative AI. A wall display of framed blue data charts and graphs showing various financial trends and statistical information. A captivating fusion of imagination and modern design aesthetics. Generative AI
Free with trial Abstract digital graph with orange and blue lines. Concept represents finance marketing business chart growth financial trading, data analysis tech currency statistic index trend. Data analysis decrease illustrations Abstract digital graph with orange and blue lines. Concept represents finance marketing business chart growth financial trading
Free with trial Flat Design Illustration of NPL Risk Analysis with Declining Bar Chart, Highlighting Financial Trends and Risks. Ideal. Data analysis decrease illustrations Flat Design Illustration of NPL Risk Analysis with Declining Bar Chart, Highlighting Financial Trends and Risks. Ideal
Free with trial Tree illustration with bar graph displaying decrease in carbon emissions from wood pellets, Generated by AI. Data analysis decrease illustrations Tree illustration with bar graph displaying decrease in carbon emissions from wood pellets
Free with trial Realistic financial graphs index number analysis business investment market economy and trading concept. Generative AI glowing lines and diagram on digital screen charts crypto data blur light line. Data analysis decrease illustrations Trading market financial graphs and glowing lines diagram on digital neural network AI generated art. Realistic financial graphs index number analysis business investment market economy and trading concept. Generative AI glowing lines and diagram on digital screen charts crypto data blur light line
Free with trial Realistic financial graphs index number analysis business investment market economy and trading concept. Generative AI glowing lines and diagram on digital screen charts crypto data blur light line. Data analysis decrease illustrations Trading market financial graphs and glowing lines diagram on digital neural network AI generated art. Realistic financial graphs index number analysis business investment market economy and trading concept. Generative AI glowing lines and diagram on digital screen charts crypto data blur light line
Free with trial Realistic financial graphs index number analysis business investment market economy and trading concept. Generative AI glowing lines and diagram on digital screen charts crypto data blur light line. Data analysis decrease illustrations Trading market financial graphs and glowing lines diagram on digital neural network AI generated art. Realistic financial graphs index number analysis business investment market economy and trading concept. Generative AI glowing lines and diagram on digital screen charts crypto data blur light line
Free with trial Realistic financial graphs index number analysis business investment market economy and trading concept. Generative AI glowing lines and diagram on digital screen charts crypto data blur light line. Data analysis decrease illustrations Trading market financial graphs and glowing lines diagram on digital neural network AI generated art. Realistic financial graphs index number analysis business investment market economy and trading concept. Generative AI glowing lines and diagram on digital screen charts crypto data blur light line
Free with trial Realistic financial graphs index number analysis business investment market economy and trading concept. Generative AI glowing lines and diagram on digital screen charts crypto data blur light line. Data analysis decrease illustrations Trading market financial graphs and glowing lines diagram on digital neural network AI generated art. Realistic financial graphs index number analysis business investment market economy and trading concept. Generative AI glowing lines and diagram on digital screen charts crypto data blur light line
Free with trial Realistic financial graphs index number analysis business investment market economy and trading concept. Generative AI glowing lines and diagram on digital screen charts crypto data blur light line. Data analysis decrease illustrations Trading market financial graphs and glowing lines diagram on digital neural network AI generated art. Realistic financial graphs index number analysis business investment market economy and trading concept. Generative AI glowing lines and diagram on digital screen charts crypto data blur light line
Free with trial Realistic financial graphs index number analysis business investment market economy and trading concept. Generative AI glowing lines and diagram on digital screen charts crypto data blur light line. Data analysis decrease illustrations Trading market financial graphs and glowing lines diagram on digital neural network AI generated art. Realistic financial graphs index number analysis business investment market economy and trading concept. Generative AI glowing lines and diagram on digital screen charts crypto data blur light line
Free with trial Realistic financial graphs index number analysis business investment market economy and trading concept. Generative AI glowing lines and diagram on digital screen charts crypto data blur light line. Data analysis decrease illustrations Trading market financial graphs and glowing lines diagram on digital neural network AI generated art. Realistic financial graphs index number analysis business investment market economy and trading concept. Generative AI glowing lines and diagram on digital screen charts crypto data blur light line
Free with trial Colorful line graph showing growth and decline of different data from 2018, 2019 and 2020, providing a visual representation of performance trends over time. Data analysis decrease vectors Colorful line graph showing growth and decline of different data from 2018, 2019 and 2020, providing a visual
Free with trial A businessman in a suit presents a graph showing a declining trend from 2023 to 2026. The image depicts a negative financial forecast, ideal for illustrating economic downturn, market analysis, or investment strategy presentations. The visualization uses clear data representation for impactful communication. Data analysis decrease illustrations Businessman presenting declining 2023-2026 graph. A businessman in a suit presents a graph showing a declining trend from 2023 to 2026. The image depicts a negative financial forecast, ideal for illustrating economic downturn, market analysis, or investment strategy presentations. The visualization uses clear data representation for impactful communication
Free with trial This image displays a candlestick chart on a white background, illustrating financial data over a period of time. The chart features green and red candlesticks representing price movements, with green indicating an increase and red indicating a decrease. The chart is accompanied by a vertical axis showing price levels and a horizontal axis indicating time periods from 2008 to 2018. Data analysis decrease illustrations Candlestick chart data isolated on white background. This image displays a candlestick chart on a white background, illustrating financial data over a period of. This image displays a candlestick chart on a white background, illustrating financial data over a period of time. The chart features green and red candlesticks representing price movements, with green indicating an increase and red indicating a decrease. The chart is accompanied by a vertical axis showing price levels and a horizontal axis indicating time periods from 2008 to 2018
Free with trial A business executive, dressed in a professional suit, meticulously analyzes a carbon reduction strategy on a digital tablet, visualizing a clear downward trend in emissions. This image captures the essence of sustainability and commitment to an eco-friendly future. Displaying projected data for 2022, 2025, 2030, 2040, and 2050, the presentation highlights a net zero ambition. The businessman's. Data analysis decrease illustrations Business executive demonstrating carbon reduction strategy with visual data on a digital tablet for a sustainable future. A business executive, dressed in a professional suit, meticulously analyzes a carbon reduction strategy on a digital tablet, visualizing a clear downward trend in emissions. This image captures the essence of sustainability and commitment to an eco-friendly future. Displaying projected data for 2022, 2025, 2030, 2040, and 2050, the presentation highlights a net zero ambition. The businessman's
Free with trial A businessperson meticulously analyzes a futuristic graph displayed on a digital tablet, visualizing carbon reduction strategies and ambitious sustainability goals. This compelling digital art piece represents the urgent need for environmental action and a greener future, focusing on climate change solutions. The graph showcases data analysis related to environmental efforts, highlighting the. Data analysis decrease illustrations Businessperson analyzing a futuristic graph representing carbon reduction strategies and sustainable goals for a greener future. A businessperson meticulously analyzes a futuristic graph displayed on a digital tablet, visualizing carbon reduction strategies and ambitious sustainability goals. This compelling digital art piece represents the urgent need for environmental action and a greener future, focusing on climate change solutions. The graph showcases data analysis related to environmental efforts, highlighting the
Free with trial Visualizing stock market decline and economic recession with a red chart and downward arrows, showing financial loss and investment risk in a dark background. A sign of economic downturn. Data analysis decrease illustrations Stock market crash recession financial crisis investment loss economic downturn chart analysis data fall 2024. visualizing stock market decline and economic recession with a red chart and downward arrows, showing financial loss and investment risk in a dark background. A sign of economic downturn.
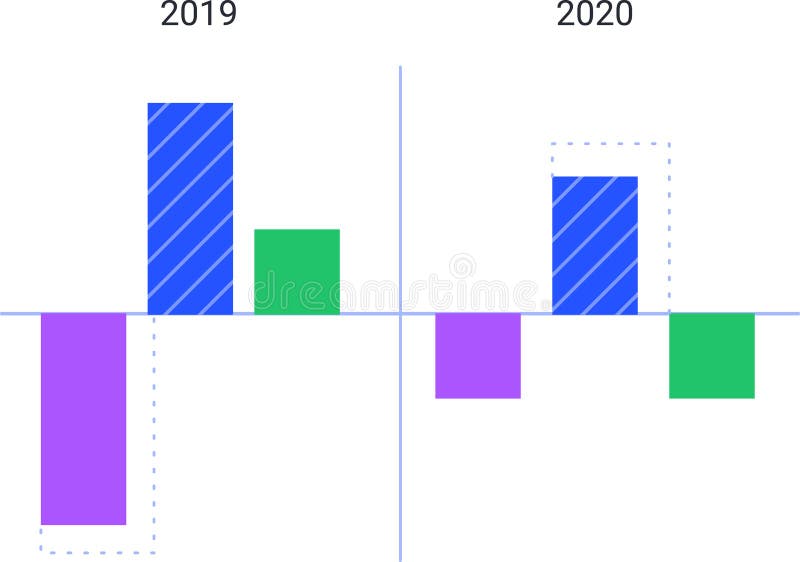
Free with trial Colorful bar charts are comparing data from 2019 and 2020, visualizing trends and statistics with positive and negative values represented by upward and downward bars. Data analysis decrease vectors Colorful bar charts are comparing data from 2019 and 2020, visualizing trends and statistics with positive and negative
Free with trial Colorful bar charts are comparing data from 2019 and 2020, visualizing trends and statistics with positive and negative values represented by upward and downward bars. Data analysis decrease illustrations Colorful bar charts are comparing data from 2019 and 2020, visualizing trends and statistics with positive and negative
Free with trial A digital graphic with a percent symbols in red next to an American flag, depicting data or economic trends or tariffs. Data analysis decrease illustrations A digital graphic with a percent symbols in red next to an American flag, depicting data or economic trends or tariffs
Free with trial A digital graphic with a percent symbols in red next to an American flag, depicting data or economic trends or tariffs. Data analysis decrease illustrations A digital graphic with a percent symbols in red next to an American flag, depicting data or economic trends or tariffs
Free with trial A digital graphic with a percent symbols in red next to an American flag, depicting data or economic trends or tariffs. Data analysis decrease illustrations A digital graphic with a percent symbols in red next to an American flag, depicting data or economic trends or tariffs
Free with trial A digital graphic with a percent symbols in red next to an American flag, depicting data or economic trends or tariffs. Data analysis decrease illustrations A digital graphic with a percent symbols in red next to an American flag, depicting data or economic trends or tariffs
Free with trial The flag of USA with declining stock market graph and financial data overlay, symbolizing economic downturn, recession, or bearish market trends. Data analysis decrease illustrations The flag of USA with declining stock market graph and financial data overlay
Free with trial The flag of Oman with declining stock market graph and financial data overlay, symbolizing economic downturn, recession, or bearish market trends. Data analysis decrease illustrations The flag of Oman with declining stock market graph and financial data overlay
Free with trial The flag of Laos with declining stock market graph and financial data overlay, symbolizing economic downturn, recession, or bearish market trends. Data analysis decrease illustrations The flag of Laos with declining stock market graph and financial data overlay
Free with trial The flag of Mali with declining stock market graph and financial data overlay, symbolizing economic downturn, recession, or bearish market trends. Data analysis decrease illustrations The flag of Mali with declining stock market graph and financial data overlay
Free with trial The flag of Chad with declining stock market graph and financial data overlay, symbolizing economic downturn, recession, or bearish market trends. Data analysis decrease illustrations The flag of Chad with declining stock market graph and financial data overlay
Free with trial The flag of Cuba with declining stock market graph and financial data overlay, symbolizing economic downturn, recession, or bearish market trends. Data analysis decrease illustrations The flag of Cuba with declining stock market graph and financial data overlay
Free with trial The flag of Benin with declining stock market graph and financial data overlay, symbolizing economic downturn, recession, or bearish market trends. Data analysis decrease illustrations The flag of Benin with declining stock market graph and financial data overlay
Free with trial The flag of Libya with declining stock market graph and financial data overlay, symbolizing economic downturn, recession, or bearish market trends. Data analysis decrease illustrations The flag of Libya with declining stock market graph and financial data overlay
Free with trial The flag of Malta with declining stock market graph and financial data overlay, symbolizing economic downturn, recession, or bearish market trends. Data analysis decrease illustrations The flag of Malta with declining stock market graph and financial data overlay
Free with trial The flag of Iraq with declining stock market graph and financial data overlay, symbolizing economic downturn, recession, or bearish market trends. Data analysis decrease illustrations The flag of Iraq with declining stock market graph and financial data overlay
Free with trial The flag of Iran with declining stock market graph and financial data overlay, symbolizing economic downturn, recession, or bearish market trends. Data analysis decrease illustrations The flag of Iran with declining stock market graph and financial data overlay
Free with trial The flag of Gabon with declining stock market graph and financial data overlay, symbolizing economic downturn, recession, or bearish market trends. Data analysis decrease illustrations The flag of Gabon with declining stock market graph and financial data overlay
Free with trial The flag of Kenya with declining stock market graph and financial data overlay, symbolizing economic downturn, recession, or bearish market trends. Data analysis decrease illustrations The flag of Kenya with declining stock market graph and financial data overlay
Free with trial The flag of Italy with declining stock market graph and financial data overlay, symbolizing economic downturn, recession, or bearish market trends. Data analysis decrease illustrations The flag of Italy with declining stock market graph and financial data overlay
Free with trial The flag of Japan with declining stock market graph and financial data overlay, symbolizing economic downturn, recession, or bearish market trends. Data analysis decrease illustrations The flag of Japan with declining stock market graph and financial data overlay
Free with trial The flag of Chile with declining stock market graph and financial data overlay, symbolizing economic downturn, recession, or bearish market trends. Data analysis decrease illustrations The flag of Chile with declining stock market graph and financial data overlay
Free with trial The flag of Ghana with declining stock market graph and financial data overlay, symbolizing economic downturn, recession, or bearish market trends. Data analysis decrease illustrations The flag of Ghana with declining stock market graph and financial data overlay
Free with trial The flag of Egypt with declining stock market graph and financial data overlay, symbolizing economic downturn, recession, or bearish market trends. Data analysis decrease illustrations The flag of Egypt with declining stock market graph and financial data overlay
Free with trial The flag of Norway with declining stock market graph and financial data overlay, symbolizing economic downturn, recession, or bearish market trends. Data analysis decrease illustrations The flag of Norway with declining stock market graph and financial data overlay
Free with trial The flag of Malawi with declining stock market graph and financial data overlay, symbolizing economic downturn, recession, or bearish market trends. Data analysis decrease illustrations The flag of Malawi with declining stock market graph and financial data overlay
Free with trial The flag of Panama with declining stock market graph and financial data overlay, symbolizing economic downturn, recession, or bearish market trends. Data analysis decrease illustrations The flag of Panama with declining stock market graph and financial data overlay
Free with trial The flag of Latvia with declining stock market graph and financial data overlay, symbolizing economic downturn, recession, or bearish market trends. Data analysis decrease illustrations The flag of Latvia with declining stock market graph and financial data overlay
Free with trial The flag of Gambia with declining stock market graph and financial data overlay, symbolizing economic downturn, recession, or bearish market trends. Data analysis decrease illustrations The flag of Gambia with declining stock market graph and financial data overlay
Free with trial The flag of Kuwait with declining stock market graph and financial data overlay, symbolizing economic downturn, recession, or bearish market trends. Data analysis decrease illustrations The flag of Kuwait with declining stock market graph and financial data overlay
Free with trial The flag of India with declining stock market graph and financial data overlay, symbolizing economic downturn, recession, or bearish market trends. Data analysis decrease illustrations The flag of India with declining stock market graph and financial data overlay
Free with trial The flag of Angola with declining stock market graph and financial data overlay, symbolizing economic downturn, recession, or bearish market trends. Data analysis decrease illustrations The flag of Angola with declining stock market graph and financial data overlay
Free with trial The flag of Greece with declining stock market graph and financial data overlay, symbolizing economic downturn, recession, or bearish market trends. Data analysis decrease illustrations The flag of Greece with declining stock market graph and financial data overlay
Free with trial The flag of Brazil with declining stock market graph and financial data overlay, symbolizing economic downturn, recession, or bearish market trends. Data analysis decrease illustrations The flag of Brazil with declining stock market graph and financial data overlay
Free with trial The flag of Cyprus with declining stock market graph and financial data overlay, symbolizing economic downturn, recession, or bearish market trends. Data analysis decrease illustrations The flag of Cyprus with declining stock market graph and financial data overlay
Free with trial The flag of France with declining stock market graph and financial data overlay, symbolizing economic downturn, recession, or bearish market trends. Data analysis decrease illustrations The flag of France with declining stock market graph and financial data overlay
Free with trial The flag of Canada with declining stock market graph and financial data overlay, symbolizing economic downturn, recession, or bearish market trends. Data analysis decrease illustrations The flag of Canada with declining stock market graph and financial data overlay
Free with trial The flag of Namibia with declining stock market graph and financial data overlay, symbolizing economic downturn, recession, or bearish market trends. Data analysis decrease illustrations The flag of Namibia with declining stock market graph and financial data overlay
Free with trial The flag of Nigeria with declining stock market graph and financial data overlay, symbolizing economic downturn, recession, or bearish market trends. Data analysis decrease illustrations The flag of Nigeria with declining stock market graph and financial data overlay
Free with trial The flag of Moldova with declining stock market graph and financial data overlay, symbolizing economic downturn, recession, or bearish market trends. Data analysis decrease illustrations The flag of Moldova with declining stock market graph and financial data overlay
Free with trial The flag of Belarus with declining stock market graph and financial data overlay, symbolizing economic downturn, recession, or bearish market trends. Data analysis decrease illustrations The flag of Belarus with declining stock market graph and financial data overlay
Free with trial The flag of Liberia with declining stock market graph and financial data overlay, symbolizing economic downturn, recession, or bearish market trends. Data analysis decrease illustrations The flag of Liberia with declining stock market graph and financial data overlay
Free with trial The flag of Jamaica with declining stock market graph and financial data overlay, symbolizing economic downturn, recession, or bearish market trends. Data analysis decrease illustrations The flag of Jamaica with declining stock market graph and financial data overlay
Free with trial The flag of Algeria with declining stock market graph and financial data overlay, symbolizing economic downturn, recession, or bearish market trends. Data analysis decrease illustrations The flag of Algeria with declining stock market graph and financial data overlay
Free with trial The flag of Myanmar with declining stock market graph and financial data overlay, symbolizing economic downturn, recession, or bearish market trends. Data analysis decrease illustrations The flag of Myanmar with declining stock market graph and financial data overlay
Free with trial The flag of Lebanon with declining stock market graph and financial data overlay, symbolizing economic downturn, recession, or bearish market trends. Data analysis decrease illustrations The flag of Lebanon with declining stock market graph and financial data overlay
Free with trial The flag of Morocco with declining stock market graph and financial data overlay, symbolizing economic downturn, recession, or bearish market trends. Data analysis decrease illustrations The flag of Morocco with declining stock market graph and financial data overlay
Free with trial The flag of Guyana with declining stock market graph and financial data overlay, symbolizing economic downturn, recession, or bearish market trends. Data analysis decrease illustrations The flag of Guyana with declining stock market graph and financial data overlay
Free with trial The flag of Georgia with declining stock market graph and financial data overlay, symbolizing economic downturn, recession, or bearish market trends. Data analysis decrease illustrations The flag of Georgia with declining stock market graph and financial data overlay
Free with trial The flag of Bahamas with declining stock market graph and financial data overlay, symbolizing economic downturn, recession, or bearish market trends. Data analysis decrease illustrations The flag of Bahamas with declining stock market graph and financial data overlay
Free with trial The flag of Croatia with declining stock market graph and financial data overlay, symbolizing economic downturn, recession, or bearish market trends. Data analysis decrease illustrations The flag of Croatia with declining stock market graph and financial data overlay
Free with trial The flag of Burundi with declining stock market graph and financial data overlay, symbolizing economic downturn, recession, or bearish market trends. Data analysis decrease illustrations The flag of Burundi with declining stock market graph and financial data overlay
Free with trial The flag of Bahrain with declining stock market graph and financial data overlay, symbolizing economic downturn, recession, or bearish market trends. Data analysis decrease illustrations The flag of Bahrain with declining stock market graph and financial data overlay