Free with trial Graph chart showing growth and analysis with bright background ,Generative ai. Progress decrease illustrations Bright background graph chart, growth analysis and data visualization. Graph chart showing growth and analysis with bright background ,Generative ai
Free with trial Concept showing red up arrow and blue down arrow side by side on a white background. Progress decrease illustrations Red Up Arrow and Blue Down Arrow Side by Side on a White Background Keywords: arrow, up arrow, down arrow, red, blue, direction. Concept showing red up arrow and blue down arrow side by side on a white background
Free with trial This 3D render shows a calculator with a colorful bar chart made of cubes illustrating growth and success in business and finance. Perfect for presentations and infographics. Progress decrease illustrations Colorful 3D Calculator with Growing Bar Chart Cubes for Business and Finance. This 3D render shows a calculator with a colorful bar chart made of cubes illustrating growth and success in business and finance. Perfect for presentations and infographics.
Free with trial Growth and decline graph report icon. Financial chart arrow up and down sign symbol illustration. Progress decrease vectors Growth and decline graph report icon. Financial chart arrow up and down sign symbol
Free with trial This 3D rendering showcases stacks of coins alongside a positive growth chart, generated by AI. It visually represents financial success and investment growth, ideal for illustrating financial concepts. Progress decrease illustrations AI-Generated Financial Growth. This 3D rendering showcases stacks of coins alongside a positive growth chart, generated by AI. It visually represents financial success and investment growth, ideal for illustrating financial concepts.
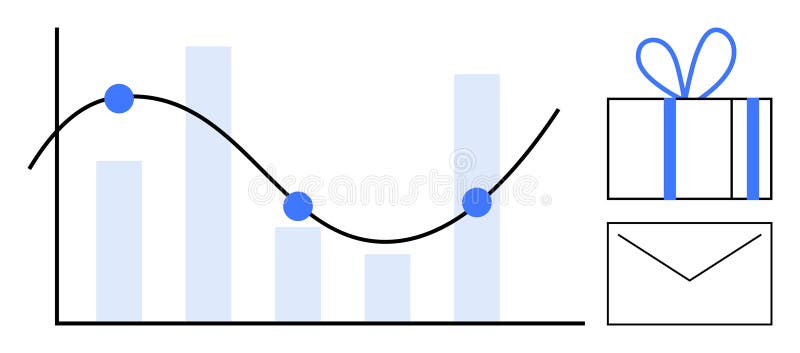
Free with trial Graph with decreasing bar chart and line graph noting key points beside a gift box and envelope. Ideal for business analysis, performance tracking, rewards programs, marketing, sales targets, client. Progress decrease vectors Bar Graph with Line Chart, Gift Box, and Envelope Representing Business Metrics and Rewards. Graph with decreasing bar chart and line graph noting key points beside a gift box and envelope. Ideal for business analysis, performance tracking, rewards programs, marketing, sales targets, client
Free with trial Two distinct lines converge in an engaging graph, illustrating contrasting trends. The sharp gradient colors enhance the visual impact, emphasizing change and growth. Progress decrease illustrations Dynamic Trends Revealed Through Shifting Data in Vibrant Gradient Hues. Two distinct lines converge in an engaging graph, illustrating contrasting trends. The sharp gradient colors enhance the visual impact, emphasizing change and growth
Free with trial A collection of simple finance graphic element icons, depicting trends, charts, and money. These icons can be used to visualize various financial concepts, such as growth, decline, and investment. Progress decrease vectors Simple Style Finance Graphic Element Icons with Trend, Chart and Money. A collection of simple finance graphic element icons, depicting trends, charts, and money. These icons can be used to visualize various financial concepts, such as growth, decline, and investment.
Free with trial Two solid blue 3D arrows are presented side-by-side against a white background. One arrow points directly upwards, and the other points directly downwards, symbolizing opposing directions, movement, or change. Progress decrease illustrations Blue Up and Down Arrows Isolated on White Background up arrow direction. Two solid blue 3D arrows are presented side-by-side against a white background. One arrow points directly upwards, and the other points directly downwards, symbolizing opposing directions, movement, or change
Free with trial This image showcases a vibrant infographic with 3D bar, pie, and line charts. The colorful elements are displayed on a teal platform, ideal for presentations or reports. Progress decrease illustrations Colorful 3D Bar Chart, Pie Chart, and Line Graph Infographic on Teal Platform. This image showcases a vibrant infographic with 3D bar, pie, and line charts. The colorful elements are displayed on a teal platform, ideal for presentations or reports.
Free with trial This image depicts a vibrant blue calculator positioned next to a colorful bar graph and stack of gold coins, symbolizing financial success and growth. The scene is clean and bright, perfect for illustrating financial concepts. Progress decrease illustrations Colorful Calculator, Bar Graph, and Coins Representing Financial Growth. This image depicts a vibrant blue calculator positioned next to a colorful bar graph and stack of gold coins, symbolizing financial success and growth. The scene is clean and bright, perfect for illustrating financial concepts.
Free with trial Chart with growth red arrow and crash in the end, 3D rendering isolated on white background. Progress decrease illustrations Chart with growth red arrow and crash in the end, 3D rendering
Free with trial This 3D rendering depicts financial growth, showcasing stacks of gold coins and black bars representing a rising graph. A golden pen rests on a sleek base, symbolizing the precision and detail involved in financial planning. This image was generated by AI and is perfect for illustrating financial s. Progress decrease illustrations Financial Growth Visualization. This 3D rendering depicts financial growth, showcasing stacks of gold coins and black bars representing a rising graph. A golden pen rests on a sleek base, symbolizing the precision and detail involved in financial planning. This image was generated by AI and is perfect for illustrating financial s
Free with trial This image showcases a futuristic holographic display, generated by AI, depicting a declining graph. The sleek, modern design highlights technological advancements in data presentation and analysis. The displayed data is likely financial or scientific, emphasizing the potential of AI in various fi. Progress decrease illustrations AI-Generated Data Visualization. This image showcases a futuristic holographic display, generated by AI, depicting a declining graph. The sleek, modern design highlights technological advancements in data presentation and analysis. The displayed data is likely financial or scientific, emphasizing the potential of AI in various fi
Free with trial This image shows a calculator next to colorful 3D bar charts and pie charts illustrating business growth and financial success. The vibrant colors and upward-trending graph create a visually appealing representation of positive financial results. Progress decrease illustrations Colorful Calculator and 3D Charts Showing Business Growth. This image shows a calculator next to colorful 3D bar charts and pie charts illustrating business growth and financial success. The vibrant colors and upward-trending graph create a visually appealing representation of positive financial results.
Free with trial A financial market graph on a blue background illustrating investment trends, this is a visual representation of market fluctuations and volume, reflecting economic movements, investment strategies and business performance analysis. Generative AI. Progress decrease illustrations Financial markets graph on a blue background showing investment trends. A financial market graph on a blue background illustrating investment trends, this is a visual representation of market fluctuations and volume, reflecting economic movements, investment strategies and business performance analysis. Generative AI
Free with trial Financial arrow up and down icon on circle line. Growth and decline graph sign symbol illustration. Progress decrease vectors Financial arrow up and down icon on circle line. Growth and decline graph sign symbol
Free with trial Growth and decline chart. Market trend analysis. Vector illustration. EPS 10. Stock image. Progress decrease vectors Growth and decline chart. Market trend analysis. Vector illustration. EPS 10.
Free with trial Promoting alternative energy and sustainable living for a greener planet. Progress decrease vectors Promoting alternative energy and sustainable living for a greener planet
Free with trial Sustainable energy solutions: eco-friendly practices and carbon reduction strategies. Progress decrease vectors Sustainable energy solutions: eco-friendly practices and carbon reduction
Free with trial Downward-sloping line graph on grid, sad face expressing disappointment, person running away. Ideal for business failure, loss, decline, negative growth, setback, challenge simple flat metaphor. Progress decrease illustrations Declining Performance Chart with Sad Face and Running Figure Symbolizing Loss or Failure. Downward-sloping line graph on grid, sad face expressing disappointment, person running away. Ideal for business failure, loss, decline, negative growth, setback, challenge simple flat metaphor
Free with trial Detailed 3D rendering of colorful bar charts, pie charts, line graphs, and calculator showcasing financial data analysis and business growth. Progress decrease illustrations Colorful 3D Business Charts, Graphs, and Calculator for Financial Success. Detailed 3D rendering of colorful bar charts, pie charts, line graphs, and calculator showcasing financial data analysis and business growth.
Free with trial Financial arrows up and down icon in flat design. Growth and decline graph sign symbol illustration. Progress decrease vectors Financial arrows up and down icon in flat design. Growth and decline graph sign symbol
Free with trial Discover a diverse collection of flat illustration concept vectors, perfect for enhancing your design projects. Explore creativity with our unique visuals. Progress decrease vectors Cost reduction concept costs cut costs optimization business Flat vector concept illustration. Discover a diverse collection of flat illustration concept vectors, perfect for enhancing your design projects. Explore creativity with our unique visuals
Free with trial A single, bold, glossy yellow arrow is depicted pointing directly downwards. The arrow has a smooth, reflective surface, suggesting a 3D rendered object. It is presented in isolation against a stark white background, making its shape and color the sole focus. Progress decrease illustrations Glossy Yellow Downward Pointing Arrow on a White Background image photo. A single, bold, glossy yellow arrow is depicted pointing directly downwards. The arrow has a smooth, reflective surface, suggesting a 3D rendered object. It is presented in isolation against a stark white background, making its shape and color the sole focus
Free with trial A collection of modern, minimalist icons related to business, finance, and data analysis. The icons feature upward and downward trends, graphs, arrows, checkmarks, targets, and warning signs. The color scheme is primarily black and green, creating a clean and professional look. Ideal for presentations, websites, infographics, and marketing materials. Progress decrease vectors Set of Business and Finance Icons. A collection of modern, minimalist icons related to business, finance, and data analysis. The icons feature upward and downward trends, graphs, arrows, checkmarks, targets, and warning signs. The color scheme is primarily black and green, creating a clean and professional look. Ideal for presentations, websites, infographics, and marketing materials.
Free with trial A close-up view of a financial bar and line graph with a pen resting on it, indicating analysis and financial data. Progress decrease illustrations Close-up of a financial graph with bars and line chart and a pen business data. A close-up view of a financial bar and line graph with a pen resting on it, indicating analysis and financial data
Free with trial Hand Drawn Graphic Showing Decline Bar Chart with Arrow Pointing Downward. Progress decrease vectors Hand Drawn Graphic Showing Decline Bar Chart with Arrow Pointing Downward
Free with trial Recession concept with golden coins stacks and falling red arrow, 3D rendering isolated on white background. Progress decrease illustrations Recession concept with golden coins stacks and falling red arrow, 3D rendering
Free with trial Downward arrow with SALE, bar chart displaying data trends, and dynamic stick figure. Ideal for business, marketing, analysis, economics, sales, growth statistics simple flat metaphor. Progress decrease illustrations Arrow pointing downward labeled SALE with bar chart and dynamic figure symbolizing action. Downward arrow with SALE, bar chart displaying data trends, and dynamic stick figure. Ideal for business, marketing, analysis, economics, sales, growth statistics simple flat metaphor
Free with trial Abstract vector illustration of colorful bar graphs for business analysis and trends. Progress decrease vectors Multiple colorful bar charts abstractly representing data and statistics. Abstract vector illustration of colorful bar graphs for business analysis and trends.
Free with trial A 3D rendered figure interacts with a large red percent symbol against a neutral background. Generative AI. Progress decrease illustrations A 3D rendered figure interacts with a large red percent symbol against a neutral background. Generative AI
Free with trial A 3D render displays a white rectangular surface with a grid pattern, representing a chart. A wavy blue line traverses the grid, with two red circular markers indicating specific points on the line. The graph is presented against a soft purple background. Progress decrease illustrations 3D Render of a Line Graph with Red Markers on a Grid Background chart data. A 3D render displays a white rectangular surface with a grid pattern, representing a chart. A wavy blue line traverses the grid, with two red circular markers indicating specific points on the line. The graph is presented against a soft purple background
Free with trial Simple bar chart graphic with rising and falling columns of varying heights. Progress decrease vectors Simple bar chart graphic with rising and falling columns of varying heights
Free with trial This 3D rendering shows vibrant bar and pie charts illustrating business growth, data analysis, and statistical visualization. Perfect for presentations, reports, or marketing materials. Progress decrease illustrations Colorful 3D Bar and Pie Charts Representing Business Growth and Data Analysis. This 3D rendering shows vibrant bar and pie charts illustrating business growth, data analysis, and statistical visualization. Perfect for presentations, reports, or marketing materials.
Free with trial This image showcases colorful 3D rendered charts and graphs displayed on a digital tablet, perfect for business presentations or reports illustrating growth and data analysis. The vibrant colors and clean design make it visually appealing and easy to understand. Progress decrease illustrations Colorful 3D Charts and Graphs on Digital Tablet for Business Presentation. This image showcases colorful 3D rendered charts and graphs displayed on a digital tablet, perfect for business presentations or reports illustrating growth and data analysis. The vibrant colors and clean design make it visually appealing and easy to understand.
Free with trial Woman holding glasses and a tablet while examining large upward and downward arrows. Ideal for business analysis, decision-making, growth, statistics, market trends, planning, and presentations in. Progress decrease illustrations Professional woman analyzing upward and downward trends alongside graphical arrows and metrics. Woman holding glasses and a tablet while examining large upward and downward arrows. Ideal for business analysis, decision-making, growth, statistics, market trends, planning, and presentations in
Free with trial Abstract 3D bar graph with red and teal bars on a white background. Illustrates data visualization and financial concepts. Progress decrease illustrations Abstract 3D Bar Graph Red and Teal Data Visualization on White. Abstract 3D bar graph with red and teal bars on a white background. Illustrates data visualization and financial concepts
Free with trial Line chart illustrating an upward trend, featuring candlestick patterns and glowing dots against a dark background. The arrangement indicates a positive movement in data, reflecting investment and financial growth. Blue and orange tones highlight data points and lines, providing a visual contrast that enhances readability. The abstract style conveys a modern financial theme, emphasizing success and progress in stock markets. Progress decrease illustrations Dynamic stock market chart showing upward trend for investment and financial growth success concept. Line chart illustrating an upward trend, featuring candlestick patterns and glowing dots against a dark background. The arrangement indicates a positive movement in data, reflecting investment and financial growth. Blue and orange tones highlight data points and lines, providing a visual contrast that enhances readability. The abstract style conveys a modern financial theme, emphasizing success and progress in stock markets.
Free with trial Falling bar chart with downward arrow signifying decline and negative trend. Progress decrease vectors Falling bar chart with downward arrow signifying decline and negative trend
Free with trial Teal bar chart illustration for data visualization and statistical analysis. Progress decrease vectors Teal bar chart illustration for data visualization and statistical analysis
Free with trial A hand-drawn graph showing a decreasing trend. The chart depicts a decline in business performance, market downturn, or financial losses, created as a minimalist doodle. Progress decrease illustrations Hand-Drawn Graph Illustration Showing Market Decline and Decreasing Trends. A hand-drawn graph showing a decreasing trend. The chart depicts a decline in business performance, market downturn, or financial losses, created as a minimalist doodle
Free with trial Financial downturn concept. A business professional climbs tall blue bars, carrying a briefcase and analyze declining bar graph and chart using magnifying glass. Progress decrease vectors Financial downturn concept, businessman analyze declining bar graph and chart. Financial downturn concept. A business professional climbs tall blue bars, carrying a briefcase and analyze declining bar graph and chart using magnifying glass
Free with trial A vibrant red arrow curves downwards, suggesting a shift in direction, a decline, or a process moving towards a lower point. Its brushstroke style adds a dynamic feel. Progress decrease illustrations Red downward curved arrow symbolizing direction change or decline movement. A vibrant red arrow curves downwards, suggesting a shift in direction, a decline, or a process moving towards a lower point. Its brushstroke style adds a dynamic feel
Free with trial Vector icons showing business growth and decline trends with arrows and magnifying glass for detailed analysis, representing financial and market data in a clear style. Professional and informative. Generative AI. Progress decrease vectors Business growth and decline infographic icons with arrows and magnifying glass for analysis. Vector icons showing business growth and decline trends with arrows. Vector icons showing business growth and decline trends with arrows and magnifying glass for detailed analysis, representing financial and market data in a clear style. Professional and informative. Generative AI
Free with trial Computer Monitor with a Graph Showing Decreasing Bar Chart for Data Analysis. Progress decrease vectors Computer Monitor with a Graph Showing Decreasing Bar Chart for Data Analysis
Free with trial A stylized line graph icon with a purple gradient is displayed against a solid black background. The graph features four circular data points connected by angled lines, forming an upward trend. Progress decrease illustrations Stylized line graph icon with purple gradient on black background chart data. A stylized line graph icon with a purple gradient is displayed against a solid black background. The graph features four circular data points connected by angled lines, forming an upward trend
Free with trial Business financial graph showing decreasing trend of profits down with arrow. Progress decrease vectors Business financial graph showing decreasing trend of profits down with arrow
Free with trial Colorful isometric bar chart showing business data and growth with bars of different height, colored blue, yellow and green. Isolated on a transparent background, perfect for business presentations or infographics. Progress decrease vectors Colorful business chart illustration on transparent background AI Generated. Colorful isometric bar chart showing business data and growth with bars of different height, colored blue, yellow and green. Isolated on a transparent background, perfect for business presentations or infographics.
Free with trial A bright green 3D arrow with a minimalist design, clearly indicating a downward direction. It's a clean and straightforward visual cue for descent or decrease. Progress decrease illustrations Bright Green 3D Arrow Pointing Down Direction Minimalist Design. a bright green 3D arrow with a minimalist design, clearly indicating a downward direction. It's a clean and straightforward visual cue for descent or decrease
Free with trial A bright green 3D arrow with a minimalist design, clearly indicating a downward direction. It's a clean and straightforward visual cue for descent or decrease. Progress decrease illustrations Bright Green 3D Arrow Pointing Down Direction Minimalist Design. a bright green 3D arrow with a minimalist design, clearly indicating a downward direction. It's a clean and straightforward visual cue for descent or decrease
Free with trial Area chart illustrating trends in Sareorplojicam and S�snpavai across years. Shows variations over time. Progress decrease illustrations . Area chart illustrating trends in Sareorplojicam and S�snpavai across years. Shows variations over time
Free with trial Tablet displays a declining graph, reflecting downturns. A dark world map serves as the backdrop, emphasizing global impact. This visualization symbolizes economic changes. The image is. Progress decrease illustrations Global Decline Displayed on Tablet with World Map Background in Dim Lighting. Tablet displays a declining graph, reflecting downturns. A dark world map serves as the backdrop, emphasizing global impact. This visualization symbolizes economic changes. The image is
Free with trial Curving hand drawn arrow pointing downward, bringing dynamic visual energy to graphic compositions. Progress decrease illustrations Vibrant, hand drawn arrow curves downwards, adding a dynamic element to any design. Curving hand drawn arrow pointing downward, bringing dynamic visual energy to graphic compositions
Free with trial A professional businessman showcases the concept of increasing quality while decreasing costs, using a hologram display with upward and downward arrows, while working on a laptop in an office setting. Progress decrease illustrations Businessman presents rising quality and decreasing cost concept. A professional businessman showcases the concept of increasing quality while decreasing costs, using a hologram display with upward and downward arrows, while working on a laptop in an office setting
Free with trial Blue arrows pointing up and down, direction indicators. Glossy finish. Isolated. Symbolizes growth, decline, choice, and navigation. Useful for web design. 161. Progress decrease vectors Blue arrows pointing up and down, direction indicators, glossy finish, isolated. Blue arrows pointing up and down, direction indicators. Glossy finish. Isolated. Symbolizes growth, decline, choice, and navigation. Useful for web design. 161
Free with trial Hand drawn bar chart illustration showing data statistics and business growth. Progress decrease vectors Hand drawn bar chart illustration showing data statistics and business growth
Free with trial Concept of high interest rates and heavy loan payments, economic recession, risk of debt burden. Vector illustration. Progress decrease vectors Concept of high interest rates and heavy loan payments, economic recession, risk of debt burden.
Free with trial A hand-drawn sketch of a business chart illustrating a significant decline, with a small, subtle sign of potential recovery at the far right. The chart is simply illustrated in black ink on a white background. Progress decrease illustrations Hand-drawn business chart showing decline followed by a very slight recovery. A hand-drawn sketch of a business chart illustrating a significant decline, with a small, subtle sign of potential recovery at the far right. The chart is simply illustrated in black ink on a white background
Free with trial A 3D rendering features a bar graph with three vertical bars in blue and yellow. Above the graph, a molecular structure is depicted with a central yellow sphere connected to three blue spheres by white rods. The entire graphic is isolated on a clean white background. Progress decrease illustrations 3D bar graph with molecular structure above on a white background chart data. A 3D rendering features a bar graph with three vertical bars in blue and yellow. Above the graph, a molecular structure is depicted with a central yellow sphere connected to three blue spheres by white rods. The entire graphic is isolated on a clean white background
Free with trial A minimalist graphic features three black chevron arrows stacked vertically, all pointing downwards. The chevrons are outlined with a thin white border, creating a subtle contrast against the pure white background. This design conveys a sense of direction, decline, or a downward sequence. Progress decrease illustrations Three Black Chevron Arrows Pointing Downward on a White Background direction. A minimalist graphic features three black chevron arrows stacked vertically, all pointing downwards. The chevrons are outlined with a thin white border, creating a subtle contrast against the pure white background. This design conveys a sense of direction, decline, or a downward sequence
Free with trial Hand drawn bar chart sketch with ascending and descending data patterns. Progress decrease vectors Hand drawn bar chart sketch with ascending and descending data patterns, AI Generative. Hand drawn bar chart sketch with ascending and descending data patterns.
Free with trial Drawn down arrow trend graph depicting financial decline and economic downturn. Progress decrease vectors Drawn down arrow trend graph depicting financial decline and economic downturn
Free with trial Hand drawn bar graph showing a downward trend with an arrow indicating decline. Progress decrease vectors Hand drawn bar graph showing a downward trend with an arrow indicating decline
Free with trial An illustration of a stylized, downward-pointing arrow zig-zagging across a pale yellow surface. The arrow conveys a sense of decline, loss, or reduction. Simplistic design is suitable for presentations, infographics, or website design needing a visual representation of negative trends. Progress decrease illustrations Downward arrow illustration showing market trend zigzag decline and recession. An illustration of a stylized, downward-pointing arrow zig-zagging across a pale yellow surface. The arrow conveys a sense of decline, loss, or reduction. Simplistic design is suitable for presentations, infographics, or website design needing a visual representation of negative trends
Free with trial Money movement icon. Dollar coin arrows. Financial flow Vector. Market trend symbol. EPS 10. Progress decrease vectors Money movement icon. Dollar coin arrows. Financial flow Vector. Market trend symbol.
Free with trial Modern abstract blue bars illustrating business statistics, trends, and analytics. Progress decrease vectors Digital data analysis bars in blue hues, conceptualizing statistics and trends. Modern abstract blue bars illustrating business statistics, trends, and analytics.
Free with trial Graph going Up and Down sign with green and red arrows vector set. Flat design vector set of a concept of sales bar chart symbol icon with arrow moving down and sales bar chart with arrow moving up. Progress decrease vectors Graph going Up and Down sign with green and red arrows vector set. Vector set of a concept of sales bar chart symbol icon. Graph going Up and Down sign with green and red arrows vector set. Flat design vector set of a concept of sales bar chart symbol icon with arrow moving down and sales bar chart with arrow moving up.
Free with trial Yellow glossy arrow pointing right. Isolated on white background. Direction guide. Close-up. Progress decrease illustrations Yellow glossy arrow pointing right. Isolated on white background. Direction guide
Free with trial A textured golden fifty-seven percent symbol rests on a peach background ideal for illustrating sales, discounts, or financial data. Progress decrease illustrations Golden Fifty-seven Percent Symbol on Peach Background for Sales and Promotions. A textured golden fifty-seven percent symbol rests on a peach background ideal for illustrating sales, discounts, or financial data
Free with trial Business graph data analysis on wooden desk with pencils, bananas and notebooks. Progress decrease illustrations Business graph data analysis on wooden desk with pencils, bananas and notebooks
Free with trial Up and Down sign with green and red arrows set vector illustration. Set of a Concept of sales bar chart symbol icon with arrow moving down and sales bar chart with arrow moving up. Progress decrease vectors Up and Down sign with green and red arrows set vector illustration. Set of a Concept of sales bar chart symbol icon with arrows. Up and Down sign with green and red arrows set vector illustration. Set of a Concept of sales bar chart symbol icon with arrow moving down and sales bar chart with arrow moving up.
Free with trial Graph going Up and Down with red arrows vector. Blue chart bar vector illustration concept of sales bar chart symbol icon with arrow moving down and sales bar chart with arrow moving up. Progress decrease vectors Graph going Up and Down with red arrows vector. Blue chart bar vector illustration concept of sales bar chart symbol icon
Free with trial A 3D rendering of a vibrant red arrow pointing upwards and a bright green arrow pointing downwards, representing market fluctuations, economic changes, and data trends. Progress decrease illustrations Red up arrow and green down arrow symbolizing financial market trends growth decline. A 3D rendering of a vibrant red arrow pointing upwards and a bright green arrow pointing downwards, representing market fluctuations, economic changes, and data trends
Free with trial Trend chart icon set. Growth and decline symbol. Up and down arrow with bar graph illustration. Progress decrease vectors Trend chart icon set. Growth and decline symbol. Up and down arrow with bar graph
Free with trial Battery Charge Cycle Vector Graphic Decreasing Energy Level with Arrow Indicator. Progress decrease vectors Battery Charge Cycle Vector Graphic Decreasing Energy Level with Arrow Indicator
Free with trial Dark grey descending bar chart with arrow indicating decline on white background. Progress decrease illustrations Dark grey descending bar chart with arrow indicating decline on white background
Free with trial Top Position and Promotion Icon Line Style Design Simple Finance and Business Vector Symbol Perfect Illustration. Progress decrease vectors Top Position and Promotion Icon Line Style Design Simple Vector Perfect Illustration. Top Position and Promotion Icon Line Style Design Simple Finance and Business Vector Symbol Perfect Illustration
Free with trial Visualize financial decline with this striking depiction of a report showing falling tax revenue and a clear downward trend, perfect for economic analysis and business strategy content. Progress decrease vectors Business financial report shows declining tax revenue with downward trend arrow. Visualize financial decline with this striking depiction of a report showing falling tax revenue and a clear downward trend, perfect for economic analysis and business strategy content