Free with trial Business strategy conference or meeting office workers graphic or chart vector boss and employee with pointer financial statistics and analytical data coworkers teamwork or cooperation businessman. Time decrease vectors Office workers business graphics meetings and conferences boss and employee. Business strategy conference or meeting office workers graphic or chart vector boss and employee with pointer financial statistics and analytical data coworkers teamwork or cooperation businessman
Free with trial Background concept wordcloud illustration of menopause. Time decrease illustrations Menopause background concept. Background concept wordcloud illustration of menopause
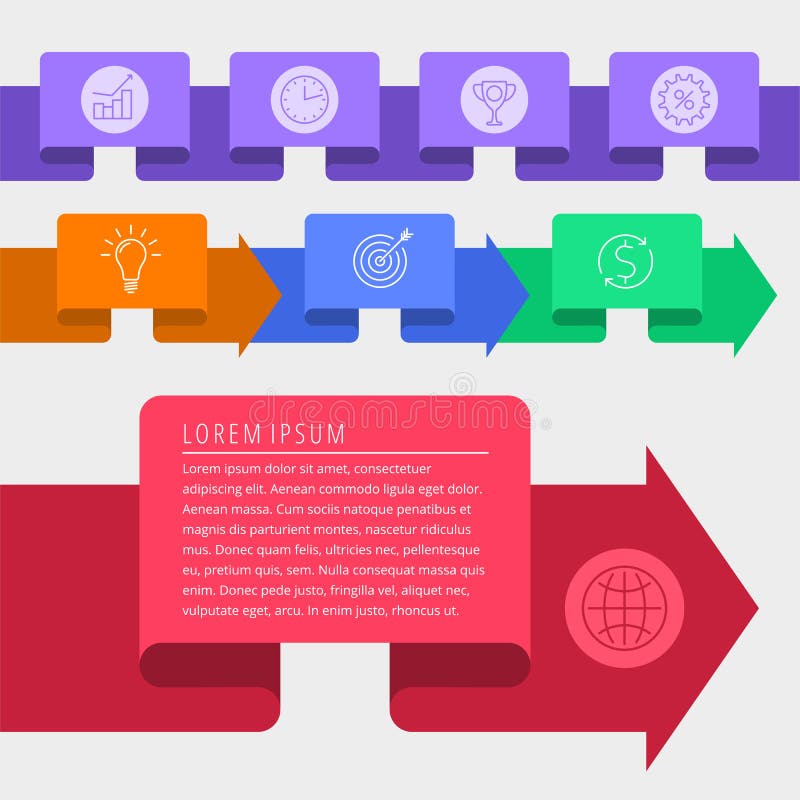
Free with trial Timeline template in sticker style for startups with set of icons. Light background. Time decrease illustrations Timeline template in sticker style with set of ico. Timeline template in sticker style for startups with set of icons. Light background.
Free with trial Bounce Rate 3d words to illustrate viewer, visitor or audience retention on a website or Internet home page, resource or site. Time decrease illustrations Bounce Rate 3d Words Visitor Audience Retention Internet Web Sit. Bounce Rate 3d words to illustrate viewer, visitor or audience retention on a website or Internet home page, resource or site
Free with trial Web icons collection - Money, finance, payments set. Time decrease vectors Money, finance, payments Icon set. Vector Illustration. Web icons collection - Money, finance, payments set
Free with trial Limited offer text - 3d red and white letters and block, business shopping concept. Time decrease illustrations Limited offer in 3d letters and block. Limited offer text - 3d red and white letters and block, business shopping concept
Free with trial Last minute and limited offer with clock signs banners - text in yellow and red drawn labels with symbols, business commerce shopping concept. Time decrease illustrations Last minute and limited offer with clock signs, yellow. Last minute and limited offer with clock signs banners - text in yellow and red drawn labels with symbols, business commerce shopping concept
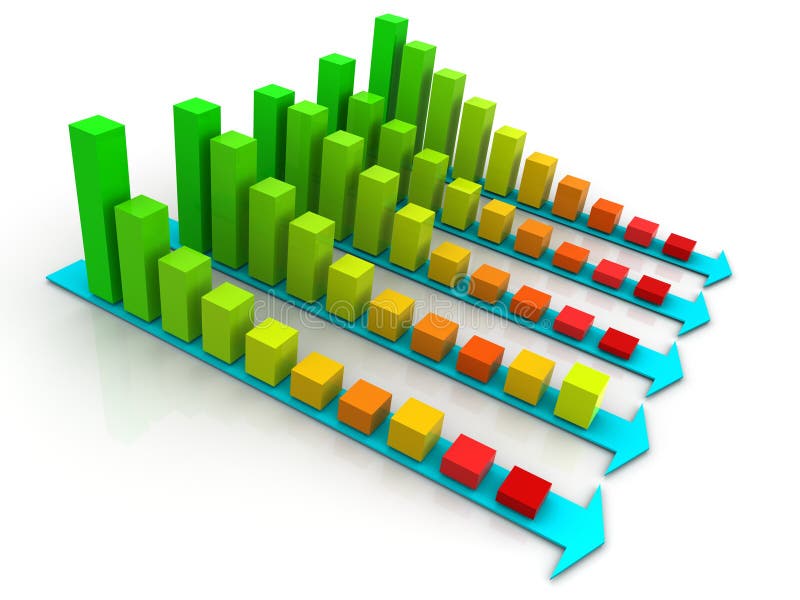
Free with trial Graph showing decrease in profits or earnings in 3D. Time decrease illustrations Column graph 3d. Graph showing decrease in profits or earnings in 3D
Free with trial Limited offer text - 3d red and white letters and blocks, business shopping concept. Time decrease illustrations Limited offer in 3d letters and blocks. Limited offer text - 3d red and white letters and blocks, business shopping concept
Free with trial Hello Summer Enjoy Every Moments Message with Watermelon for Summer Season in Patterned Teal Background with Realistic Pink Flamingo and Black Toucan Vector Illustration. Time decrease vectors Hello Summer Enjoy Every Moments Message with Watermelon for Summer Season
Free with trial Icon of woman and clocks as metaphor of ageing / aging and consequences - menopause and limited fertility and ability to reproduce. Time decrease vectors Biological clocks of woman. Icon of woman and clocks as metaphor of ageing / aging and consequences - menopause and limited fertility and ability to reproduce
Free with trial Money loan flat icon set. Credit score, low interest, discount card, mortgage percent, tax black minimal silhouette vector illustration. Simple glyph signs for bank application. Time decrease illustrations Money loan flat icon set. Credit score, low interest, discount card, mortgage percent, tax black minimal silhouette
Free with trial Company layoffs due to recession, vector illustration. Time decrease vectors Company layoffs due to recession
Free with trial Hourglass with gold coins tighten with the rope on blue background. Time decrease illustrations Tight budget and money economy, investment disabling, finance and business concept. Hourglass with gold coins tighten with the rope on blue background
Free with trial Patterned Summer Sale Text with Leaves, Flowers and Realistic Flamingo Together with Toucan Vector Illustration in Blue Background. For Promotional Purposes. Time decrease vectors Patterned Summer Sale Text with Leaves, Flowers and Realistic Flamingo Together with Toucan Vector
Free with trial Vector of a business man trying to reduce stress level at work. Time decrease vectors Vector of a business man trying to reduce stress level at work
Free with trial Life concept with hourglass and decreasing sand on the textured green background. Time decrease vectors Life concept with hourglass and decreasing sand on the textured green background
Free with trial Hello Summer Enjoy Every Moments Message with Watermelon for Summer Season in Patterned Teal Background with Realistic Pink Flamingo and Black Toucan Vector Illustration. Time decrease vectors Hello Summer Enjoy Every Moments Message with Watermelon for Summer Season in Patterned Teal Background
Free with trial Money loan line icon set. Credit score, low interest, discount card, mortgage percent, tax minimal vector illustration. Simple outline signs for bank application. Pixel Perfect, Editable Strokes. Time decrease vectors Money loan line icon set. Credit score, low interest, discount card, mortgage percent, tax minimal vector illustration
Free with trial Man setting thermostat temperature to 17 degrees at night. Composite image between a 3d illustration and a photography. Time decrease illustrations Reduce temperature of bedroom for sleep to 17 degrees. Man setting thermostat temperature to 17 degrees at night. Composite image between a 3d illustration and a photography
Free with trial Schedule statistics concept. A team of analysts plans a working week a month, analyzes sales. A man with a tablet, a woman with a pencil stand against backdrop of cityscape. Flat vector illustration. Time decrease vectors Schedule statistics concept. A team of analysts plans a working week a month, analyzes sales. A man with a tablet, a woman with a
Free with trial Menopause lettering on creative background made from hand drawn icons in doodle style. Vector illustration, colourful design. Medical, healthcare and feminine concept. Female health awareness signs. Time decrease vectors Menopause doodles image. Menopause lettering on creative background made from hand drawn icons in doodle style. Vector illustration, colourful design. Medical, healthcare and feminine concept. Female health awareness signs
Free with trial Flat style image showing business deadline, stress and angry boss. Time decrease vectors Hurry up objects. Flat style image showing business deadline, stress and angry boss
Free with trial Money loan line icon set. Credit score, low interest, discount card, mortgage percent, tax minimal vector illustration. Simple outline signs for bank application. Orange color. Editable Stroke. Time decrease vectors Money loan line icon set. Credit score, low interest, discount card, mortgage percent, tax minimal vector illustration
Free with trial Timeline chart infographic template elements. Flat vector illustration of business development steps. Isolated infographics arrow symbols for web, internet, print, presentations, social networks. Time decrease vectors Timeline infographic vector template elements. Business development steps arrows chart. Timeline chart infographic template elements. Flat vector illustration of business development steps. Isolated infographics arrow symbols for web, internet, print, presentations, social networks.
Free with trial Modern thin line icons set of finance, investment, banking and money. Premium quality outline symbol collection. Simple mono linear pictogram pack for web graphics. Wallet, moneybox, coins and others. Time decrease vectors Modern thin line icons set of finance
Free with trial Simple Set Loan Flat Icons for Website and Mobile Apps. Contains such Icons as Investment, Finance, Document, Credit, Shopping. 48x48 Pixel Perfect. Vector illustration. Time decrease vectors Simple Set Loan Flat Icons for Website
Free with trial Energy icon set. It included electric, power, charge, ev, and more icons. Time decrease vectors Energy icon set. It included electric, power, charge, and more icons.
Free with trial Tablet PC on a white background and diagrams are shown in the picture. Time decrease vectors Tablet PC. Tablet PC on a white background and diagrams are shown in the picture.
Free with trial Assessment icons in line design. Assessment, data, analysis, compare, plan, analysis, testing, report, management isolated on white background vector Assessment editable stroke icons. Time decrease vectors Assessment icons in line design. Assessment, data, analysis, compare, plan, analysis, testing, report, management
Free with trial Assessment icons in line design, blue. Assessment, data, analysis, compare, plan, analysis, testing, report, management isolated on white background vector Assessment editable stroke icons. Time decrease vectors Assessment icons in line design, blue. Assessment, data, analysis, compare, plan, analysis, testing, report, management
Free with trial Modern thin line icons set of finance, investment, banking and money. Premium quality outline symbol collection. Simple mono linear pictogram pack for web graphics. Wallet, moneybox, coins and others. Time decrease vectors Modern thin line icons set of finance
Free with trial Increase price vector icon design, 48x48 pixel perfect and editable stroke. Time decrease vectors Increase price icon. Increase price vector icon design, 48x48 pixel perfect and editable stroke
Free with trial Office outline icon. Office sign. Graph symbol for your web site design, logo, app, UI. Vector illustration. Time decrease vectors Outline web icon set - Office. Office outline icon. Office sign. Graph symbol for your web site design, logo, app, UI. Vector illustration
Free with trial Financial interest related line icon set. Debt and loan vector linear icon collection. Credit and lending money lined icons. Time decrease vectors Financial interest, Loan and Lending related line icon set. Financial interest related line icon set. Debt and loan vector linear icon collection. Credit and lending money lined icons.
Free with trial Hands of businesswoman typing on laptop with infographics in blurry office with double exposure of falling financial graph. Concept of market crash. Toned image. Time decrease illustrations Woman typing in office, falling graph. Hands of businesswoman typing on laptop with infographics in blurry office with double exposure of falling financial graph. Concept of market crash. Toned image
Free with trial Businessman character design. Businessman fight with economy and financial crisis. Time decrease vectors Businessman character design. Businessman with economy and finance. (Set of business people about economy and finance). Businessman character design. Businessman fight with economy and financial crisis.
Free with trial Modern ovens and electronic instrument panel. Time decrease illustrations Oven control panel. Modern ovens and electronic instrument panel
Free with trial Modern thin line icons set of finance, investment, banking and money. Premium quality outline symbol collection. Simple mono linear pictogram pack for web graphics. Wallet, moneybox, coins and others. Time decrease vectors Modern thin line icons set of finance
Free with trial Line icons set. Investment pack. Vector illustration. Web and Ui-UX Collection. Time decrease vectors Line icons set. Investment pack. Vector batch. Line icons set. Investment pack. Vector illustration. Web and Ui-UX Collection
Free with trial Modern thin line icons set of finance, investment, banking and money. Premium quality outline symbol collection. Simple mono linear pictogram pack for web graphics. Wallet, moneybox, coins and others. Time decrease vectors Modern thin line icons set of finance
Free with trial Finance and business clear line, illustrations, icons, backgrounds and graphics. The icons pack is black and white, flat, , pixel perfect, minimal, suitable for web and print. Linear pictograms. Time decrease illustrations Finance and business clear line icons. Finance and business clear line, illustrations, icons, backgrounds and graphics. The icons pack is black and white, flat, , pixel perfect, minimal, suitable for web and print. Linear pictograms.
Free with trial This colorful and innovative pack is based on the theme of banking and finance. The elements in the set portray financial planning, money making ideas, banking and other related matters. It is an exquisite pack to grab for associated projects. Time decrease illustrations 100 Finance And Banking Icons. This colorful and innovative pack is based on the theme of banking and finance. The elements in the set portray financial planning, money making ideas, banking and other related matters. It is an exquisite pack to grab for associated projects
Free with trial Set of Business icons, such as Timer, 5g notebook, 3d chart symbols. Mobile screen banners. Consolidation line icons. Stopwatch gadget, Wireless laptop, Presentation column. Strategy. Vector. Time decrease vectors Set of Business icons, such as Timer, 5g notebook, 3d chart symbols. Consolidation line icons. Vector. Set of Business icons, such as Timer, 5g notebook, 3d chart symbols. Mobile screen banners. Consolidation line icons. Stopwatch gadget, Wireless laptop, Presentation column. Strategy. Vector
Free with trial Procrastinator RGB color icon. Apathy, inactivity, unwillingness. Motivation drop. Low self-esteem and depression. Decreasing productivity, efficiency. Disorganisation. Isolated vector illustration. Time decrease vectors Procrastinator RGB color icon
Free with trial Alarm clock with Books and Cap - 3D Rendering Image. Time decrease illustrations Alarm clock with Books and Cap
Free with trial Hot price mega sale posters with text set. Super discount buy now limited time only. Autumn offer reduced prices special shopping proposals vector. Time decrease vectors Hot Price Mega Sale Set Vector Illustration. Hot price mega sale posters with text set. Super discount buy now limited time only. Autumn offer reduced prices special shopping proposals vector
Free with trial Loan icons. Set of Investment, Interest rate and Percentage diagram icons. Car leasing, analytics plan, Credit card percent and loan rate. Bank mortgage, leasing, interest graph. Gradient buttons set. Time decrease vectors Loan icons. Set of Investment, Interest rate and Percentage diagram icons. Vector. Loan icons. Set of Investment, Interest rate and Percentage diagram icons. Car leasing, analytics plan, Credit card percent and loan rate. Bank mortgage, leasing, interest graph. Gradient buttons set
Free with trial Fixed costs symbol with a dollar symbol in a padlock on a balance scale. Easy to use for your website or presentation. Time decrease vectors Fixed costs symbol with a dollar symbol in a padlock on a balance scale
Free with trial Loan icons. Set of Investment, Interest rate and Percentage diagram icons. Car leasing, analytics plan, Credit card percent and loan rate. Bank mortgage, leasing, interest graph. Vector. Time decrease vectors Loan icons. Set of Investment, Interest rate and Percentage diagram icons. Vector. Loan icons. Set of Investment, Interest rate and Percentage diagram icons. Car leasing, analytics plan, Credit card percent and loan rate. Bank mortgage, leasing, interest graph. Vector
Free with trial Business and office work. Documents, paperwork. Businessman. Thin line blue web icon set. Outline icons collection. Vector illustration. Time decrease vectors Business and office work. Documents, paperwork. Businessman. Thin line blue web icon set. Outline icons collection
Free with trial Appearance of wrinkles black line icon. Skin layer. Vector illustration. Time decrease vectors Appearance of wrinkles black line icon. Skin layer.
Free with trial Liquid badges. Set of 48 hours, Graph chart and Approved agreement icons. Light bulb sign. Delivery service, Growth report, Signature document. Lamp energy. Gradient 48 hours icon. Flyer fluid design. Time decrease vectors 48 hours, Graph chart and Approved agreement icons. Light bulb sign. Vector. Liquid badges. Set of 48 hours, Graph chart and Approved agreement icons. Light bulb sign. Delivery service, Growth report, Signature document. Lamp energy. Gradient 48 hours icon. Flyer fluid design
Free with trial Conference or meeting business strategy office workers graphic or chart vector men boss and employee with pointer financial statistics and analytical data coworkers teamwork or cooperation businessman. Time decrease vectors Business meeting or conference office workers graphic or chart. Conference or meeting business strategy office workers graphic or chart vector men boss and employee with pointer financial statistics and analytical data coworkers teamwork or cooperation businessman.
Free with trial Business and office work. Documents, paperwork. Businessman. Thin line blue web icon set. Outline icons collection. Vector illustration. Time decrease vectors Business and office work. Documents, paperwork. Businessman. Thin line blue web icon set. Outline icons collection.
Free with trial Business and office work. Documents, paperwork. Businessman. Thin line black web icon set. Outline icons collection. Vector illustration. Time decrease vectors Business and office work. Documents, paperwork. Businessman. Thin line black web icon set. Outline icons collection
Free with trial Business and office work. Documents, paperwork. Businessman. Thin line black web icon set. Outline icons collection. Vector illustration. Time decrease vectors Business and office work. Documents, paperwork. Businessman. Thin line black web icon set. Outline icons collection
Free with trial Business and office work. Documents, paperwork. Businessman. Thin line black web icon set. Outline icons collection. Vector illustration. Time decrease vectors Business and office work. Documents, paperwork. Businessman. Thin line black web icon set. Outline icons collection
Free with trial Business and office work. Documents, paperwork. Businessman. Thin line yellow web icon set. Outline icons collection. Vector illustration. Time decrease vectors Business and office work. Documents, paperwork. Businessman. Thin line yellow web icon set. Outline icons collection
Free with trial Debt icon in filled, thin line, outline and stroke style. Vector illustration of two colored and black debt vector icons designs can be used for mobile, ui, web. Time decrease vectors Debt icon in filled, thin line, outline and stroke style. Vector illustration of two colored and black debt vector icons designs
Free with trial Report document, Quick tips and Website statistics line icons set. Certificate, Lawyer and Magistrates court signs. Time management, Employee result and Approved message symbols. Vector. Time decrease vectors Report document, Quick tips and Website statistics icons set. Certificate, Lawyer and Magistrates court signs. Vector. Report document, Quick tips and Website statistics line icons set. Certificate, Lawyer and Magistrates court signs. Time management, Employee result and Approved message symbols. Vector
Free with trial Education icons set. Included icon as Architectural plan, Quick tips, Graph chart signs. Winner ribbon, Check investment, Sales diagram symbols. Business report, Breathing exercise, Verify. Vector. Time decrease illustrations Education icons set. Included icon as Architectural plan, Quick tips, Graph chart. Vector. Education icons set. Included icon as Architectural plan, Quick tips, Graph chart signs. Winner ribbon, Check investment, Sales diagram symbols. Business report, Breathing exercise, Verify. Vector
Free with trial Long term investment, budget plan icon, financial independence strategy, future profit, pension saving, retirement accumulation, vector illustration. Time decrease vectors Distant future financial target, budget plan icon, yield money profit. Long term investment, budget plan icon, financial independence strategy, future profit, pension saving, retirement accumulation, vector illustration
Free with trial Coronavirus crisis 2020. Coronacrisis. Conceptual visualization of a recession due to a virus. Covid-19 pandemic is affecting the global economy. Corona virus weakens economy. Vector illustration. Time decrease vectors Coronavirus crisis 2020. Coronacrisis. Conceptual visualization of a recession due to a virus. Covid-19 pandemic is affecting the
Free with trial A line graph illustrating the gradual decrease in energy consumption over several months, with lightning bolt icons transitioning to leaf icons, symbolizing a shift from high energy usage to sustainable, cost-effective practices. The x-axis represents time in months, and the y-axis shows energy consumption in kWh, clearly indicating a downward trend in energy use and associated costs. Time decrease illustrations Energy Consumption Decrease Over Time Leading to Cost Reduction. A line graph illustrating the gradual decrease in energy consumption over several months, with lightning bolt icons transitioning to leaf icons, symbolizing a shift from high energy usage to sustainable, cost-effective practices. The x-axis represents time in months, and the y-axis shows energy consumption in kWh, clearly indicating a downward trend in energy use and associated costs
Free with trial A line graph displaying the decrease in crop yields over time with each line representing a different type of crop and highlighting the overall downward trend.. Vector illustration. Time decrease vectors A line graph displaying the decrease in crop yields over time with each line representing a different type of crop and
Free with trial This vector illustration shows business icons representing time management, financial growth, investment, profit increase and decrease with simple human figures in black. Professional mood. Generative AI. Time decrease vectors Business icons time management financial growth investment profit increase decrease vector illustration. This vector illustration shows business icons representing time management, financial growth, investment, profit increase and decrease with simple human figures in black. Professional mood. Generative AI
Free with trial The image shows a bold red zigzag arrow pointing downward, symbolizing a trend of decline or reduction. This type of arrow is commonly used in graphs, charts, and presentations to represent a decrease in data, performance, or value over a period of time. Time decrease illustrations A downward zigzag arrow indicating a decline or decrease in values over time. isolated on white background. The image shows a bold red zigzag arrow pointing downward, symbolizing a trend of decline or reduction. This type of arrow is commonly used in graphs, charts, and presentations to represent a decrease in data, performance, or value over a period of time
Free with trial A timeline with a line graph showing the gradual decrease in debt over time with the avalanche od.. Vector illustration. Time decrease vectors A timeline with a line graph showing the gradual decrease in debt over time with the avalanche od.. Vector illustration.
Free with trial A set illustration of Smartphone displaying a Stopwatch with downward arrow as a symbol of a worse time or duration. Time decrease vectors Smartphone Stopwatch Arrow Down Time Decrease. A set illustration of Smartphone displaying a Stopwatch with downward arrow as a symbol of a worse time or duration.
Free with trial Clock representing time, dollar symbol with arrows for currency flow, and downward arrow signifying decrease. Ideal for finance, savings, productivity, time management, cost reduction, efficiency. Time decrease vectors Time and Money Concept with Clock, Dollar Sign, and Downward Arrow. Clock representing time, dollar symbol with arrows for currency flow, and downward arrow signifying decrease. Ideal for finance, savings, productivity, time management, cost reduction, efficiency
Free with trial A bar graph with a downward trend highlighted in neon colors, illustrating a decrease in values over time. Time decrease illustrations Graph showing a downward trend over time. A bar graph with a downward trend highlighted in neon colors, illustrating a decrease in values over time
Free with trial This bar and line graph illustrates a declining trend in data values over a period of months. The x-axis represents time in months from January to December, while the y-axis shows the values ranging from 0 to 800. The red bars indicate the monthly data values, and the red line represents the overall trend. The trend shows a consistent decrease in values from January to December. Time decrease illustrations Decline in monthly data over time. This bar and line graph illustrates a declining trend in data values over a period of months. The x-axis represents time in months from January to December, while the y-axis shows the values ranging from 0 to 800. The red bars indicate the monthly data values, and the red line represents the overall trend. The trend shows a consistent decrease in values from January to December
Free with trial A blue stopwatch displays a green arrow pointing downwards, symbolizing a decrease in time or a reduction in duration. Time decrease illustrations Stopwatch with a downward arrow indicating time reduction. A blue stopwatch displays a green arrow pointing downwards, symbolizing a decrease in time or a reduction in duration
Free with trial The image depicts a bar graph displayed on an easel, illustrating a downward trend over time. The bars start high on the left and progressively decrease in height towards the right, with a red arrow emphasizing the decline. The graph's y-axis appears to measure an unspecified metric, while the x-axis represents a timeline. Time decrease illustrations Graph showing decline over time. The image depicts a bar graph displayed on an easel, illustrating a downward trend over time. The bars start high on the left and progressively decrease in height towards the right, with a red arrow emphasizing the decline. The graph's y-axis appears to measure an unspecified metric, while the x-axis represents a timeline