Free with trial Magnet attracting. Web traffic, Cross sell and Accepted payment icons simple set. Finance, Statistics and Pie chart signs. Website window, Market retail. Finance set. Line web traffic icon. Vector. Data analysis decrease vectors Web traffic, Cross sell and Accepted payment icons set. Finance, Statistics and Pie chart signs. Vector. Magnet attracting. Web traffic, Cross sell and Accepted payment icons simple set. Finance, Statistics and Pie chart signs. Website window, Market retail. Finance set. Line web traffic icon. Vector
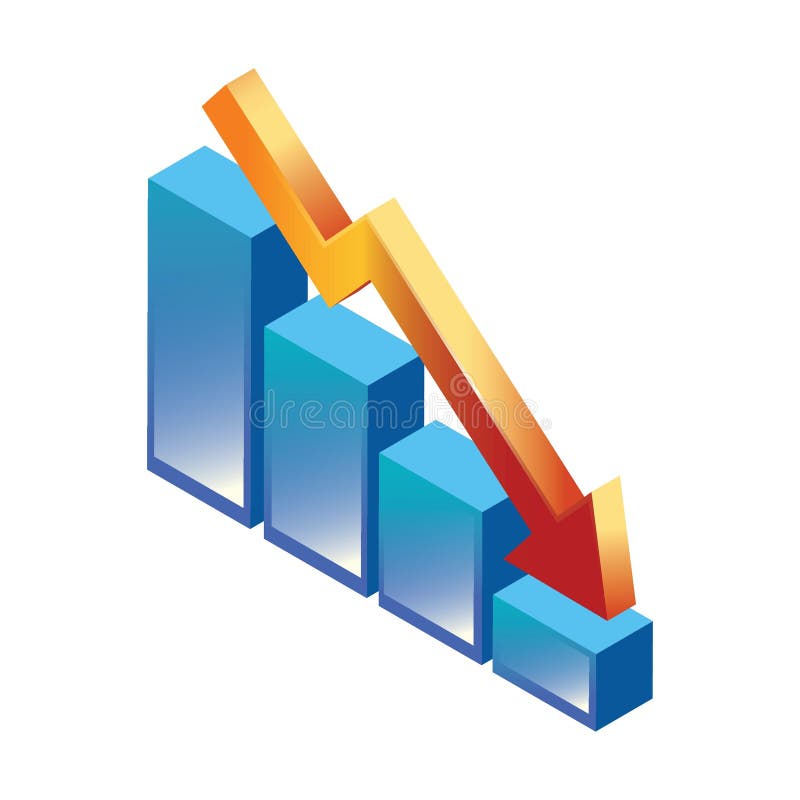
Free with trial Isometric smartphone showing stock market crash with graph going down. Data analysis decrease vectors Smartphone showing stock market crash with graph going down
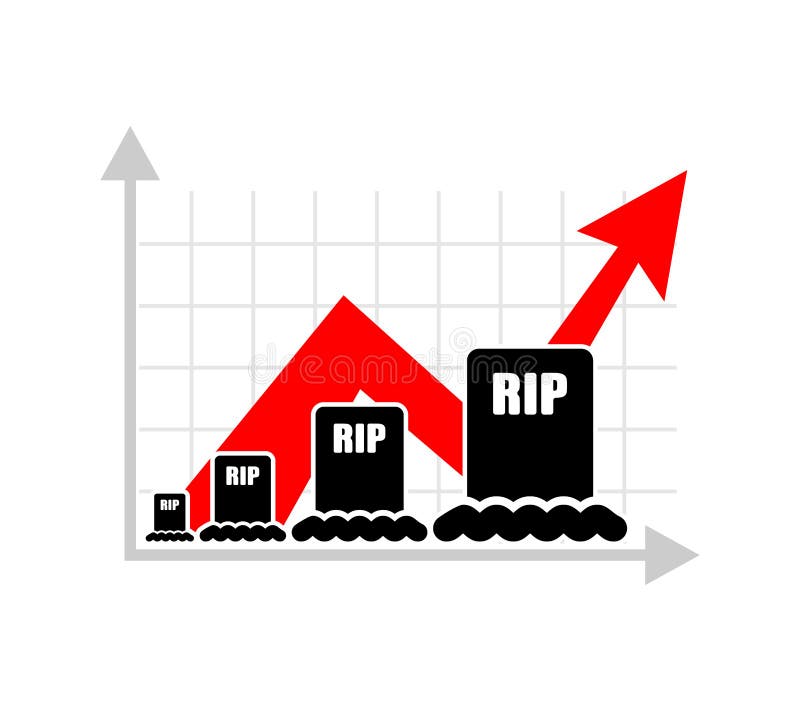
Free with trial Graph of growth of mortality of population. Growing graves. Analytical illustration for infographics. Data analysis decrease vectors Graph of growth of mortality of population. Growing graves. Analytical illustration for infographics
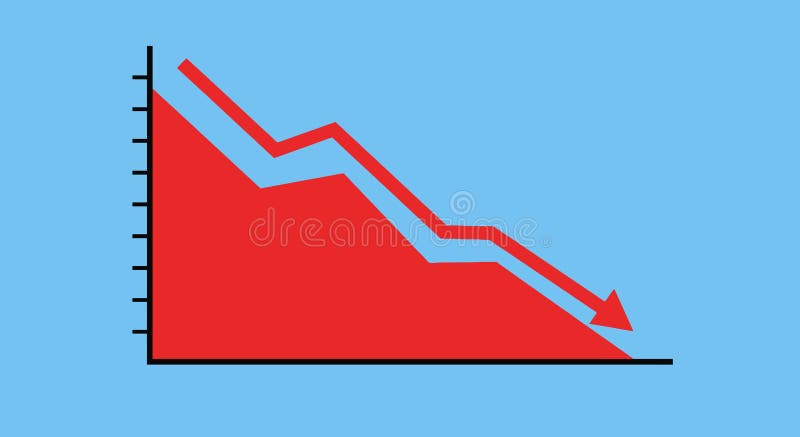
Free with trial Financial stock crisis chart, vector art illustration. Data analysis decrease vectors Financial stock crisis chart
Free with trial Statistics down icon isolated on shiny round buttons set illustration. Data analysis decrease vectors Statistics down icon shiny round buttons set illustration. Statistics down icon isolated on shiny round buttons set illustration
Free with trial A striking red line graph against a dark backdrop, illustrating a stock market crash and highlighting a financial crisis. The image conveys a sense of loss and economic downturn. Data analysis decrease illustrations Stock market crash illustration with red line graph on a dark background depicting financial crisis concept. A striking red line graph against a dark backdrop, illustrating a stock market crash and highlighting a financial crisis. The image conveys a sense of loss and economic downturn
Free with trial Pyramid chart line icon. Analytics graph sign. Market analytics symbol. Colorful outline concept. Blue and orange thin line color Pyramid chart icon. Vector. Data analysis decrease vectors Pyramid chart line icon. Analytics graph sign. Vector. Pyramid chart line icon. Analytics graph sign. Market analytics symbol. Colorful outline concept. Blue and orange thin line color Pyramid chart icon. Vector
Free with trial Bars descending graph vector line icon, sign, illustration on white background, editable strokes. Data analysis decrease vectors Bars descending graph vector line icon, sign, illustration on background, editable strokes
Free with trial Header banner. Settings blueprint, Recycle and Survey checklist icons simple set. Diagram graph, Elevator and Sales diagram signs. Report document, Recycling waste. Technology set. Vector. Data analysis decrease vectors Settings blueprint, Recycle and Survey checklist icons set. Diagram graph, Elevator and Sales diagram signs. Vector. Header banner. Settings blueprint, Recycle and Survey checklist icons simple set. Diagram graph, Elevator and Sales diagram signs. Report document, Recycling waste. Technology set. Vector
Free with trial Bar graph with declining concept. Vector illustration decorative design. Data analysis decrease vectors Bar graph with declining concept. Vector illustration decorative design
Free with trial Pie chart, Accounting and Algorithm icons simple set. Idea sign. 3d graph, Supply and demand, Project. Light bulb. Science set. Infographic timeline. Line pie chart icon. 4 options or steps. Vector. Data analysis decrease vectors Pie chart, Accounting and Algorithm icons set. Idea sign. 3d graph, Supply and demand, Project. Light bulb. Vector. Pie chart, Accounting and Algorithm icons simple set. Idea sign. 3d graph, Supply and demand, Project. Light bulb. Science set. Infographic timeline. Line pie chart icon. 4 options or steps. Vector
Free with trial Bear market and red arrow downward trend line. bearish market concept vector. Data analysis decrease vectors Bear market and red arrow downward trend line. bearish market concept
Free with trial Credit card, Diagram graph and Internet shopping icons simple set. Button with halftone dots. Growth chart sign. Atm payment, Presentation chart, Cart with purchases. Upper arrows. Finance set. Vector. Data analysis decrease vectors Credit card, Diagram graph and Internet shopping icons set. Growth chart sign. Vector. Credit card, Diagram graph and Internet shopping icons simple set. Button with halftone dots. Growth chart sign. Atm payment, Presentation chart, Cart with purchases. Upper arrows. Finance set. Vector
Free with trial Statistics down icon isolated on abstract halftone round button set. Data analysis decrease vectors Statistics down icon abstract halftone round button set. Statistics down icon isolated on abstract halftone round button set
Free with trial Euro money, Diagram graph and 3d chart signs. Bitcoin graph, Refresh bitcoin and Dot plot line icons set. Finance, Demand curve symbols. Cryptocurrency analytics, Update cryptocurrency. Vector. Data analysis decrease vectors Bitcoin graph, Refresh bitcoin and Dot plot icons set. Euro money, Diagram graph and 3d chart signs. Vector. Euro money, Diagram graph and 3d chart signs. Bitcoin graph, Refresh bitcoin and Dot plot line icons set. Finance, Demand curve symbols. Cryptocurrency analytics, Update cryptocurrency. Vector
Free with trial Analytics half glyph vector icon which can easily modify or edit. Data analysis decrease vectors Analytics half glyph vector icon which can easily modify or edit
Free with trial This abstract texture background graphic is high definition and a great quality pattern that can be used for various purposes. Data analysis decrease illustrations Stock Market Crash of Red Arrow Graph Going Down Into Recession - Abstract Background Texture. This abstract texture background graphic is high definition and a great quality pattern that can be used for various purposes.
Free with trial A businessman stands with arms outstretched holding 'Buy' and 'Sell' signs, visually representing market trends and investment decisions for use in financial illustrations. Data analysis decrease illustrations Buy Sell Indicator for Stock Trader. A businessman stands with arms outstretched holding 'Buy' and 'Sell' signs, visually representing market trends and investment decisions for use in financial illustrations
Free with trial Money loss. Cash with down arrow stocks graph, concept of financial crisis, market fall, bankruptcy. Vector stock illustration. Data analysis decrease vectors Money loss. Cash with down arrow stocks graph, concept of financial crisis, market fall, bankruptcy. Vector stock
Free with trial Report statistics, Salary and Partnership icons simple set. Certificate, Horizontal chart and Graph signs. Graph chart, Diplomat with money bag. Education set. Infographic template. 6 steps timeline. Data analysis decrease vectors Report statistics, Salary and Partnership icons set. Certificate, Horizontal chart and Graph signs. Vector. Report statistics, Salary and Partnership icons simple set. Certificate, Horizontal chart and Graph signs. Graph chart, Diplomat with money bag. Education set. Infographic template. 6 steps timeline
Free with trial Set of Technology icons, such as Graph chart, Winner medal, Talk bubble symbols. Mobile app mockup banners. Checked calculation line icons. Growth report, Ranking star, Chat message. Vector. Data analysis decrease vectors Set of Technology icons, such as Graph chart, Winner medal, Talk bubble symbols. Vector. Set of Technology icons, such as Graph chart, Winner medal, Talk bubble symbols. Mobile app mockup banners. Checked calculation line icons. Growth report, Ranking star, Chat message. Vector
Free with trial This image shows a red downward trend line on a graph, indicating a significant decline. Vector illustration design using ai tool. Data analysis decrease vectors Economic crash imminent. This image shows a red downward trend line on a graph, indicating a significant decline. Vector illustration design using ai tool.
Free with trial Statistics down icon isolated on flat exclusive button set. Data analysis decrease vectors Statistics down icon flat exclusive button set. Statistics down icon isolated on flat exclusive button set
Free with trial Statistics down icon isolated on eyeball blue round button. Data analysis decrease illustrations Statistics down icon eyeball blue round button. Statistics down icon isolated on eyeball blue round button
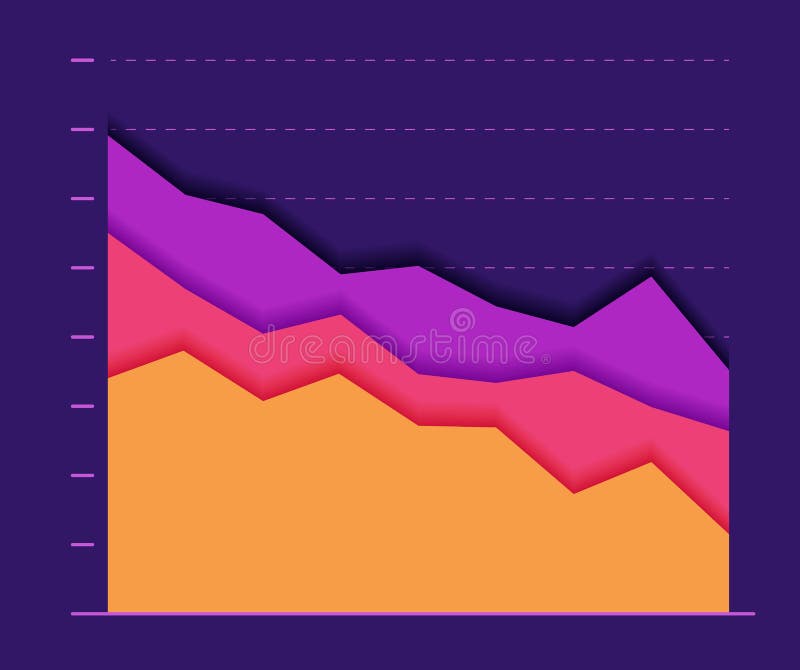
Free with trial Abstract Paper graph color line moving down. concept of collapse and fall. Modern design graphics on dark background. Vector illustration. Data analysis decrease vectors Abstract Paper graph color line moving down. concept of collapse and fall.
Free with trial Chart with down arrow icon collection in glyph style, solid color vector, version 1. Data analysis decrease vectors Chart with down arrow icon collection in glyph style
Free with trial Credit card, Graph and Report document icons simple set. 3d chart sign. Loan percent, Presentation diagram, Growth chart. Presentation column. Finance set. Speech bubble credit card icon. Vector. Data analysis decrease vectors Credit card, Graph and Report document icons set. 3d chart sign. Vector. Credit card, Graph and Report document icons simple set. 3d chart sign. Loan percent, Presentation diagram, Growth chart. Presentation column. Finance set. Speech bubble credit card icon. Vector
Free with trial Decreasing red arrows showing the deterioration of the economy or the fall of stocks on the stock exchange in Russia. Data analysis decrease illustrations Decreasing red arrows showing the deterioration of the economy in Russia. Decreasing red arrows showing the deterioration of the economy or the fall of stocks on the stock exchange in Russia.
Free with trial Down schedule, the decline fall chart multi color style icon. Simple glyph, flat vector of profit icons for ui and ux, website or mobile application on white background. Data analysis decrease illustrations Down schedule, the decline fall chart multi color style icon. Simple glyph, flat vector of profit icons for ui and ux, website or
Free with trial Margin Trading, Risks and Profits Concept. Brokers Analysing Global Fund and Finance, Traders Opening a Deal With Leverage, Trade Forex And Crypto Assets. Isometric Cartoon 3d Vector Illustration. Data analysis decrease vectors Margin Trading, Risks and Profits Concept. Brokers Analysing Global Fund and Finance, Traders Opening a Deal With
Free with trial Analytics chart, Update comments and Internet downloading line icons set. Chat bubbles with quotes. Globe, Loan percent and Swipe up signs. Reject certificate, 360 degrees symbols. Vector. Data analysis decrease vectors Analytics chart, Update comments and Internet downloading icons set. Globe, Loan percent and Swipe up signs. Vector. Analytics chart, Update comments and Internet downloading line icons set. Chat bubbles with quotes. Globe, Loan percent and Swipe up signs. Reject certificate, 360 degrees symbols. Vector
Free with trial Start business, Report checklist and Graph chart icons simple set. Report document sign. Launch idea, Sales growth file, Growth chart. Education set. Speech bubble start business icon. Vector. Data analysis decrease vectors Start business, Report checklist and Graph chart icons set. Report document sign. Vector. Start business, Report checklist and Graph chart icons simple set. Report document sign. Launch idea, Sales growth file, Growth chart. Education set. Speech bubble start business icon. Vector
Free with trial Infographic diagram declining trend bar chart,illustration can be used as template in presentation,web banner design,business, economy,statistic flyer and slide. Data analysis decrease illustrations Infographic diagram declining trend bar chart,illustration can be used as template in presentation,web banner design,business
Free with trial Loyalty award, Calendar graph and Cashback line icons set. Cell phone, megaphone and deal vector icons. Upper arrows sign. Bonus medal, Annual report, Financial transfer. Growth infochart. Vector. Data analysis decrease vectors Loyalty award, Calendar graph and Cashback icons set. Upper arrows sign. Vector. Loyalty award, Calendar graph and Cashback line icons set. Cell phone, megaphone and deal vector icons. Upper arrows sign. Bonus medal, Annual report, Financial transfer. Growth infochart. Vector
Free with trial 3d model of financial graph with red backlight on blue background, stock market financing chart, economic boom and bust, investment bankruptcy and inflation, global rising and falling economy. 3D rendering. Data analysis decrease illustrations 3d model of financial graph with red backlight on blue background, stock market financing chart, economic boom and bust
Free with trial A businessman holds banknotes, runs away from stack of money bar chart with red graph down. Withdraw capital in business recession, economic strategy, financial, market performance, loss management. Data analysis decrease vectors A businessman holds banknotes, runs away from stack of money bar chart with red graph down. Withdraw capital in business recession
Free with trial Map of USA Recession Economic Crisis Creative Concept with Economic Crash Arrow Vector Illustration Design. Data analysis decrease vectors Map of USA Recession Economic Crisis Creative Concept with Economic Crash Arrow
Free with trial Map of United Kingdom Recession Economic Crisis Creative Concept with Economic Crash Arrow Vector Illustration Design. Data analysis decrease vectors Map of United Kingdom Recession Economic Crisis Creative Concept with Economic Crash Arrow
Free with trial Set line Data analysis, Financial growth, Calculator, Folder and lock, decrease and icon. Vector. Data analysis decrease illustrations Set line Data analysis, Financial growth, Calculator, Folder and lock, decrease and icon. Vector
Free with trial Set Isometric Financial growth decrease Data analysis and Pie chart infographic icon. Vector. Data analysis decrease vectors Set Isometric Financial growth decrease, Data analysis and Pie chart infographic icon. Vector
Free with trial Set line Data analysis, Financial growth decrease, and Search data. Business infographic template. Vector. Data analysis decrease illustrations Set line Data analysis, Financial growth decrease, and Search data. Business infographic template. Vector
Free with trial Set line Financial growth decrease, Data analysis, Pie chart infographic, Server, Binary code, and icon. Vector. Data analysis decrease illustrations Set line Financial growth decrease, Data analysis, Pie chart infographic, Server, Binary code, and icon. Vector
Free with trial Set line Financial growth decrease Binary code Data analysis Search data with folder and Pie chart infographic icon. Vector. Data analysis decrease illustrations Set line Financial growth decrease, Binary code, Data analysis, Search data, with folder and Pie chart infographic icon
Free with trial Set Coal mine trolley Server Pie chart infographic Financial growth Data analysis decrease and Sales funnel with icon. Vector. Data analysis decrease vectors Set Coal mine trolley, Server, Pie chart infographic, Financial growth, Data analysis, decrease, and Sales funnel with. Set Coal mine trolley Server Pie chart. Set Coal mine trolley Server Pie chart infographic Financial growth Data analysis decrease and Sales funnel with icon. Vector.
Free with trial Set Financial growth decrease Cloud computing lock Pie chart infographic Server Sales funnel with and Data analysis icon. Vector. Data analysis decrease illustrations Set Financial growth decrease, Cloud computing lock, Pie chart infographic, Server, Sales funnel with, and Data analysis
Free with trial A red graph with arrows illustrating decrease and increase, representing data analysis and performance evaluation in business. Suitable for reports and presentations. Data analysis decrease vectors Vector art of red graph with arrow, illustrating decrease and increase, representing data analysis and performance evaluation in. A red graph with arrows illustrating decrease and increase, representing data analysis and performance evaluation in business. Suitable for reports and presentations
Free with trial Three dimensional blue arrows and plus sign representing growth, progress, increase, decrease, statistics, data analysis, business, finance, charts, and trends. Data analysis decrease vectors Three dimensional blue arrows and plus sign symbolizing growth progress increase decrease statistics data analysis. Three dimensional blue arrows and plus sign representing growth, progress, increase, decrease, statistics, data analysis, business, finance, charts, and trends
Free with trial Set line Financial growth decrease, Data analysis, Server and Search data icon. Vector. Data analysis decrease illustrations Set line Financial growth decrease, Data analysis, Server and Search data icon. Vector
Free with trial Set Binary code Pie chart infographic Data analysis Coal mine trolley Financial growth decrease and Browser with stocks market icon. Vector. Data analysis decrease illustrations Set Binary code, Pie chart infographic, Data analysis, Coal mine trolley, Financial growth decrease, and Browser with. Set Binary code Pie chart infographic Data analysis Coal mine trolley Financial growth decrease and Browser with stocks market icon. Vector.
Free with trial Set line Data analysis Search data Financial growth decrease Server security with padlock Pie chart infographic and icon. Vector. Data analysis decrease vectors Set line Data analysis, Search data, Financial growth decrease, Server security with padlock, Pie chart infographic, and
Free with trial Set line Data analysis Folder and lock Financial growth decrease and Pie chart infographic. Business infographic template. Vector. Data analysis decrease vectors Set line Data analysis, Folder and lock, Financial growth decrease and Pie chart infographic. Business infographic. Set line Data analysis Folder and lock Financial growth decrease and Pie chart infographic. Business infographic template. Vector.
Free with trial Set line Financial growth, Pie chart infographic, decrease, Server, Data analysis, and icon. Vector. Data analysis decrease vectors Set line Financial growth, Pie chart infographic, decrease, Server, Data analysis, and icon. Vector
Free with trial Set Financial growth decrease Server Search data analysis Pie chart infographic cloud computing Browser with exclamation mark Data and icon. Vector. Data analysis decrease illustrations Set Financial growth decrease, Server, Search data analysis, Pie chart infographic, cloud computing, Browser with. Set Financial growth decrease Server Search data analysis Pie chart infographic cloud computing Browser with exclamation mark Data and icon. Vector.
Free with trial Set Search data analysis, Pie chart infographic, Calculator, Financial growth decrease, with folder, and icon. Vector. Data analysis decrease vectors Set Search data analysis, Pie chart infographic, Calculator, Financial growth decrease, with folder, and icon. Vector
Free with trial Set Data analysis Financial growth decrease Mind map infographic Cloud download and upload Calculator Pie chart and icon. Vector. Data analysis decrease illustrations Set Data analysis, Financial growth decrease, Mind map infographic, Cloud download and upload, Calculator, Pie chart and
Free with trial Set line Financial growth decrease, Document with graph chart, Cloud download and upload and Data analysis icon. Vector. Data analysis decrease illustrations Set line Financial growth decrease, Document with graph chart, Cloud download and upload and Data analysis icon. Vector
Free with trial Set line Search data analysis Server Cloud download and upload Binary code Financial growth decrease Browser with exclamation mark Data and icon. Vector. Data analysis decrease vectors Set line Search data analysis, Server, Cloud download and upload, Binary code, Financial growth decrease, Browser with. Set line Search data analysis Server Cloud download and upload Binary code Financial growth decrease Browser with exclamation mark Data and icon. Vector.
Free with trial Set line Data analysis Financial growth decrease Cloud and shield and Browser with stocks market. Business infographic template. Vector. Data analysis decrease illustrations Set line Data analysis, Financial growth decrease, Cloud and shield and Browser with stocks market. Business infographic
Free with trial Set line Financial growth decrease Data analysis Browser with stocks market Pie chart infographic Coal mine trolley and Cloud computing lock icon. Vector. Data analysis decrease vectors Set line Financial growth decrease, Data analysis, Browser with stocks market, Pie chart infographic, Coal mine trolley. Set line Financial growth decrease Data analysis Browser with stocks market Pie chart infographic Coal mine trolley and Cloud computing lock icon. Vector.
Free with trial Set Search with folder Financial growth decrease and Data analysis. Business infographic template. Vector. Data analysis decrease illustrations Set Search with folder, Financial growth decrease and Data analysis. Business infographic template. Vector
Free with trial Set Data analysis, Financial growth decrease, Search data and Pie chart infographic icon. Vector. Data analysis decrease vectors Set Data analysis, Financial growth decrease, Search data and Pie chart infographic icon. Vector
Free with trial Set Pie chart infographic, Financial growth decrease, Data analysis and Search data on seamless pattern. Vector. Data analysis decrease illustrations Set Pie chart infographic, Financial growth decrease, Data analysis and Search data on seamless pattern. Vector
Free with trial Set Binary code, Pie chart infographic, Data analysis and Financial growth decrease icon. Vector. Data analysis decrease vectors Set Binary code, Pie chart infographic, Data analysis and Financial growth decrease icon. Vector
Free with trial Isometric banner template showing inflation concept. Vector illustration of financial crisis, rising prices, and money value decrease. Data analysis report with charts and upward arrow for web design. Data analysis decrease vectors Inflation And Economic Crisis Data Analysis Isometric Banner Template Vector Illustration. Isometric banner template showing inflation concept. Vector illustration of financial crisis, rising prices, and money value decrease. Data analysis report with charts and upward arrow for web design
Free with trial Set line Financial growth decrease, Data analysis, and Server on black and white. Vector. Data analysis decrease illustrations Set line Financial growth decrease, Data analysis, and Server on black and white. Vector
Free with trial Set line Pie chart infographic, Financial growth decrease and Data analysis icon. Vector. Data analysis decrease vectors Set line Pie chart infographic, Financial growth decrease and Data analysis icon. Vector
Free with trial Finance data analytics, decrease graph line icon. Business research report analysis, finance performance analytics or company statistic outline vector icon column infographics and pointing down arrow. Data analysis decrease illustrations Finance data analytics, decrease graph line icon
Free with trial Decline graph chart icon. Descending market stock scheme vector illustration. Decrease statistics symbol. Failing finance data sign. Arrow down economic analysis. Business loss trend. Report diagram. Data analysis decrease vectors Decline graph chart icon. Descending market stock scheme vector illustration. Decrease statistics symbol. Failing finance data
Free with trial This infographic showcases a variety of graphs and charts, including bar graphs, line graphs, and pie charts, in a range of colors such as blue, green, and red. The image represents business data analysis, with arrows indicating growth, increase, and decrease trends. The infographic is a visual representation of market research, economy indicators, and metrics, making it a useful tool for business strategy and planning. Data analysis decrease vectors A colorful infographic featuring various graphs and charts to represent business data analysis. This infographic showcases a variety of graphs and charts, including bar graphs, line graphs, and pie charts, in a range of colors such as blue, green, and red. The image represents business data analysis, with arrows indicating growth, increase, and decrease trends. The infographic is a visual representation of market research, economy indicators, and metrics, making it a useful tool for business strategy and planning.
Free with trial Set line Financial growth decrease, Cloud and shield and Search data analysis icon. Vector. Data analysis decrease illustrations Set line Financial growth decrease, Cloud and shield and Search data analysis icon. Vector
Free with trial Set Data analysis, Binary code, Folder and lock, Financial growth, Search data, and decrease icon. Vector. Data analysis decrease vectors Set Data analysis, Binary code, Folder and lock, Financial growth, Search data, and decrease icon. Vector
Free with trial Set Mind map infographic Pie chart Server Folder and lock Sales funnel with Financial growth decrease Data analysis and icon. Vector. Data analysis decrease vectors Set Mind map infographic, Pie chart, Server, Folder and lock, Sales funnel with, Financial growth decrease, Data. Set Mind map infographic Pie chart Server Folder and lock Sales funnel with Financial growth decrease Data analysis and icon. Vector.
Free with trial Set Isometric line Financial growth decrease, Coal mine trolley, and Data analysis icon. Vector. Data analysis decrease vectors Set Isometric line Financial growth decrease, Coal mine trolley, and Data analysis icon. Vector
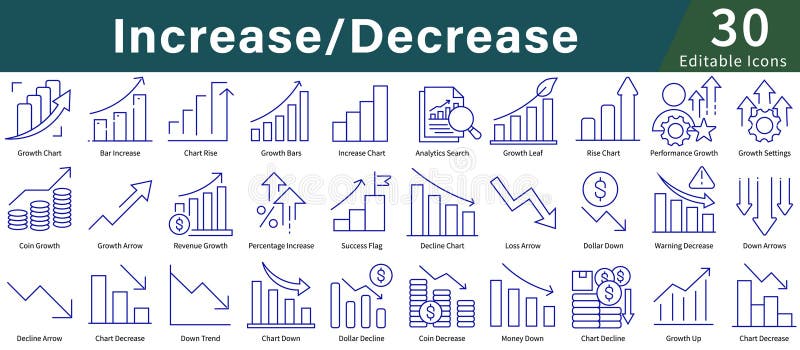
Free with trial Icons illustrating concepts of "Increase Decrease," using simple blue line art. Features include graphs and charts with upward and downward arrows, coins, dollar symbols, and percentage signs. Icons depict growth, decline, analytics, and performance tracking. Suitable for business, finance, or data analysis themes, these icons provide a visual representation of financial trends and statistics, making abstract concepts clear and easily understandable. The design is minimalistic and user-friendly, aimed at enhancing clarity in presentations and reports. Data analysis decrease vectors Increase Decrease Icon Set in Line Style with Editable Vector for Growth, Analytics, Charts, and Data Visualization. Icons illustrating concepts of "Increase Decrease," using simple blue line art. Features include graphs and charts with upward and downward arrows, coins, dollar symbols, and percentage signs. Icons depict growth, decline, analytics, and performance tracking. Suitable for business, finance, or data analysis themes, these icons provide a visual representation of financial trends and statistics, making abstract concepts clear and easily understandable. The design is minimalistic and user-friendly, aimed at enhancing clarity in presentations and reports.
Free with trial Set Isometric Financial growth decrease Coal mine trolley and Data analysis icon. Vector. Data analysis decrease vectors Set Isometric Financial growth decrease, Coal mine trolley and Data analysis icon. Vector
Free with trial A police department is using data analysis to track traffic violations and target areas with high rates of accidents resulting in a decrease in trafficrelated crimes.. Vector illustration. Data analysis decrease vectors A police department is using data analysis to track traffic violations and target areas with high rates of accidents
Free with trial Set Data analysis Financial growth and decrease on seamless pattern. Vector. Data analysis decrease vectors Set Data analysis, Financial growth and decrease on seamless pattern. Vector
Free with trial Set line Pie chart infographic Financial growth decrease and Search data analysis on seamless pattern. Vector. Data analysis decrease illustrations Set line Pie chart infographic, Financial growth decrease and Search data analysis on seamless pattern. Vector
Free with trial Set Search data analysis, Financial growth decrease, Server and Binary code icon. Vector. Data analysis decrease illustrations Set Search data analysis, Financial growth decrease, Server and Binary code icon. Vector