Free with trial Graph icon indicating growth and data analysis, perfect for business presentations and financial reports. visual representation of progress ,Generative ai. Data analysis decrease illustrations Graph icon, a comprehensive symbol of data analysis, growth, and business trends for effective presentations. Graph icon indicating growth and data analysis, perfect for business presentations and financial reports. visual representation of progress ,Generative ai
Free with trial Bar graph with an upward trend, blue downward arrow, and percentage sign. Ideal for business analysis, finance, growth, decline trends, statistics economics comparison. Flat simple metaphor. Data analysis decrease vectors Financial chart with growth trend, declining arrow, and percentage symbol representing data analysis. Bar graph with an upward trend, blue downward arrow, and percentage sign. Ideal for business analysis, finance, growth, decline trends, statistics economics comparison. Flat simple metaphor
Free with trial Declining graph trend with sad face, security lock symbol, and coding element. Ideal for failure analysis, cybersecurity, data breach awareness, risk management, technology flaws, business loss. Data analysis decrease vectors Declining Data Trend on Graph with Security and Sad Expression. Declining graph trend with sad face, security lock symbol, and coding element. Ideal for failure analysis, cybersecurity, data breach awareness, risk management, technology flaws, business loss
Free with trial A close-up view of a hand holding a magnifying glass over a business graph, emphasizing the analysis of data trends and performance insights. Data analysis decrease illustrations Analysis of Data Trends with Magnifying Glass on Business Graph for Detailed Observation. A close-up view of a hand holding a magnifying glass over a business graph, emphasizing the analysis of data trends and performance insights
Free with trial Vibrant Digital Financial Analysis With Colorful Graphs And Data Visualization On Screen. Generative AI. Data analysis decrease illustrations Vibrant Digital Financial Analysis With Colorful Graphs And Data Visualization On Screen
Free with trial A visual representation of declining data points connected by a red line. This graphic effectively illustrates a negative trend or decrease over time, suitable for financial or performance reports. Data analysis decrease illustrations Data trend analysis showing downward trajectory with red dots and connecting line vector. A visual representation of declining data points connected by a red line. This graphic effectively illustrates a negative trend or decrease over time, suitable for financial or performance reports
Free with trial Financial chart displaying a series of candlestick patterns on a digital screen, used for stock data analysis. The chart features vertical bars in orange against a blue background with grid lines. Each candlestick represents price movements within a specific time frame, showcasing market trends. The background includes a blurred assortment of lights and other graphical elements, indicating a financial data interface, likely used for investment portfolio analysis and trading activities. Data analysis decrease illustrations Financial Chart And Stock Data Analysis For Investment Portfolio. Candle Stick Graph For Trade. Financial chart displaying a series of candlestick patterns on a digital screen, used for stock data analysis. The chart features vertical bars in orange against a blue background with grid lines. Each candlestick represents price movements within a specific time frame, showcasing market trends. The background includes a blurred assortment of lights and other graphical elements, indicating a financial data interface, likely used for investment portfolio analysis and trading activities.
Free with trial A 3D rendered graphic depicts a bar chart with three vertical bars of varying heights: two blue bars flanking a taller yellow bar. At the top of the yellow bar, a central yellow sphere is connected by white rods to two smaller blue spheres, resembling a molecular structure or a network. The entire graphic is isolated on a white background, suggesting concepts of data analysis, growth, and. Data analysis decrease illustrations 3D Rendered Bar Chart with Connecting Spheres Representing Data Analysis graph statistics. A 3D rendered graphic depicts a bar chart with three vertical bars of varying heights: two blue bars flanking a taller yellow bar. At the top of the yellow bar, a central yellow sphere is connected by white rods to two smaller blue spheres, resembling a molecular structure or a network. The entire graphic is isolated on a white background, suggesting concepts of data analysis, growth, and
Free with trial 3d bar chart illustrating growth, analysis, and business progress with colorful visual representation of data ,Generative ai. Data analysis decrease illustrations 3d bar chart, visualizing growth, data analysis, and business progress for effective communication. 3d bar chart illustrating growth, analysis, and business progress with colorful visual representation of data ,Generative ai
Free with trial Blue folder with chart, business organization, data analysis, and report presentation concept. streamline your workflow ,Generative ai. Data analysis decrease illustrations Blue folder with chart, streamlining business data analysis and report presentation for enhanced workflow. Blue folder with chart, business organization, data analysis, and report presentation concept. streamline your workflow ,Generative ai
Free with trial A detailed financial chart showing business data analysis and market trend with upward arrow sign. Data analysis decrease illustrations Financial chart business data analysis and market trend view isolated on transparent background. a detailed financial chart showing business data analysis and market trend with upward arrow sign
Free with trial A set of black and white icons representing stock market data analysis and financial growth. 94. Data analysis decrease vectors Stock market data analysis charts and graphs business finance and investment vector icon set design 100. a set of black and white icons representing stock market data analysis and financial growth. 94
Free with trial Chart icons for data analysis vector art design, Minimalist business charts icons bar graphs, line graphs, and pie charts vector illustration on white background the image is generated using AI. Data analysis decrease vectors Chart icons for data analysis vector art design, Minimalist business charts icons bar graphs, line graphs, and pie charts vector
Free with trial Business Analytics And Data Visualization Line Icon Set. Financial Growth, Market Trends, And Performance Analysis Outline Symbol Collection. Editable Stroke. Isolated Vector Illustration. Data analysis decrease vectors Business Analytics And Data Visualization Line Icon Set. Financial Growth, Market Trends, And Performance Analysis
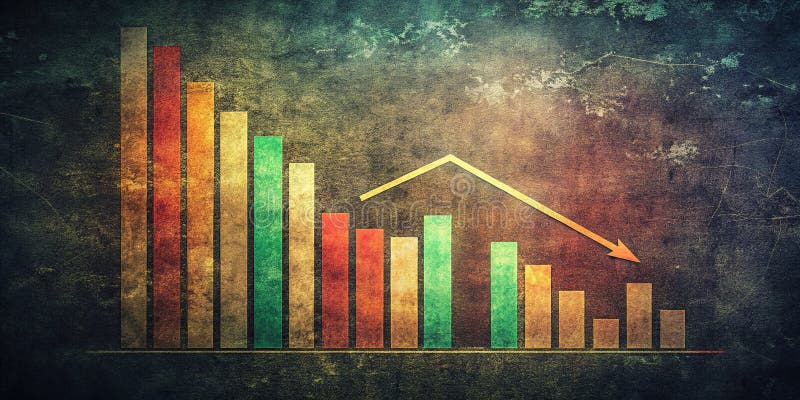
Free with trial This striking vintage-style bar graph, set against a dramatic dark background, visually represents a consistent downward trend in financial data. The muted colors and grainy texture add an authentic, analog feel to the digital visualization, emphasizing the impactful nature of the decline. Ideal for business presentations, financial reports, or investment analysis, this image powerfully. Data analysis decrease illustrations Vintage Bar Graph Depicts Consistent Market Decline A Financial Data Visualization for Trend Analysis. This striking vintage-style bar graph, set against a dramatic dark background, visually represents a consistent downward trend in financial data. The muted colors and grainy texture add an authentic, analog feel to the digital visualization, emphasizing the impactful nature of the decline. Ideal for business presentations, financial reports, or investment analysis, this image powerfully
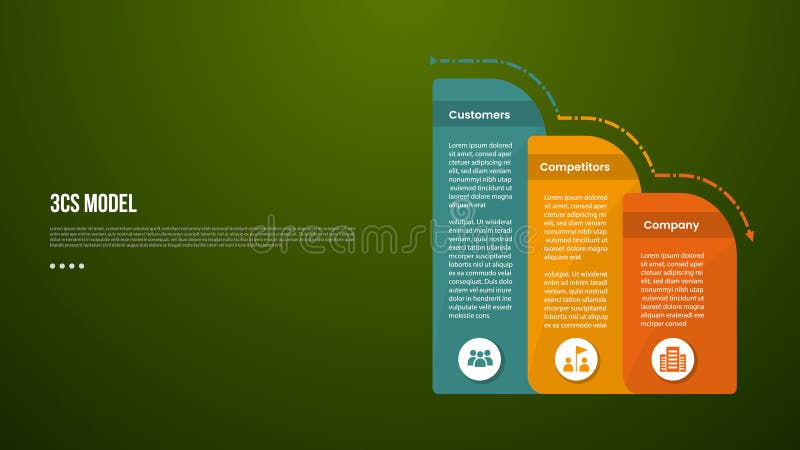
Free with trial 3C analysis business model infographic template with round box container decrease gradually with dark background style with 3 point for slide presentation vector. Data analysis decrease illustrations 3C analysis business model infographic template with round box container decrease gradually with dark background style with 3
Free with trial Bar Chart Decline Line And Solid Icon Set. Financial Loss, Economic Downturn, And Business Performance Decrease Symbol Collection. Data Analysis And Market Trends. Isolated Vector Illustration. Data analysis decrease vectors Bar Chart Decline Line And Solid Icon Set. Financial Loss, Economic Downturn, And Business Performance Decrease Symbol
Free with trial Set line Graph chart infographic Server Data Browser window Financial growth decrease Laptop with browser Cloud technology data transfer and Secure your site HTTPS SSL icon. Vector. Data analysis decrease illustrations Set line Graph chart infographic, Server, Data, Browser window, Financial growth decrease, Laptop with browser, Cloud. Set line Graph chart infographic Server Data Browser window Financial growth decrease Laptop with browser Cloud technology data transfer and Secure your site HTTPS SSL icon. Vector.
Free with trial FAB analysis model infographic template with round box container decrease gradually with dark background style with 3 point for slide presentation vector. Data analysis decrease illustrations FAB analysis model infographic template with round box container decrease gradually with dark background style with 3 point for
Free with trial Minimalist graph icon showing growth and fluctuation. Perfect for finance, business reports, market analysis, and data presentation projects. Data analysis decrease vectors Minimalist graph icon showing growth and fluctuation. Perfect for finance, business reports, market analysis, and data
Free with trial Line Graph Chart Solid Icon. Data Analysis, Trend Visualization, And Statistical Representation Silhouette Symbol. Business And Financial Insights. Isolated Vector Illustration. Data analysis decrease vectors Line Graph Chart Solid Icon. Data Analysis, Trend Visualization, And Statistical Representation Silhouette Symbol
Free with trial Bar Chart With Arrows Line And Solid Icon Set. Data Analysis, Trend Indication, Business Performance Tracking Symbols. Visual Representation Of Growth And Decline. Isolated Vector Illustration. Data analysis decrease vectors Bar Chart With Arrows Line And Solid Icon Set. Data Analysis, Trend Indication, Business Performance Tracking Symbols
Free with trial An upward trending stock market graph shows business finance investment growth and success. The red arrow indicates positive data analysis and economic trending up. A strong future ahead!. Data analysis decrease illustrations Stock market growth chart business finance investment graph arrow up trending data analysis success economy. An upward trending stock market graph shows business finance investment growth and success. The red arrow indicates positive data analysis and economic trending up. A strong future ahead!
Free with trial PEST analysis infographic template with dark gradient background style with round vertical box container gradually decrease on right column 4 point for slide presentation vector. Data analysis decrease illustrations PEST analysis infographic template with dark gradient background style with round vertical box container gradually decrease on
Free with trial A captivating stock market analysis chart that visualizes financial data and business growth. The blue background enhances the modern design, perfect for illustrating investment trends and economic reports. Data analysis decrease illustrations Stock market analysis chart financial data graph business investment growth blue background vector illustration. a captivating stock market analysis chart that visualizes financial data and business growth. The blue background enhances the modern design, perfect for illustrating investment trends and economic reports.
Free with trial A dynamic image showcasing digital financial data and fluctuating stock market graphs. the red lines suggest market volatility, providing a powerful visual for economic analysis, investment strategies, or financial presentations. Generative AI. Data analysis decrease illustrations Stock Market Volatility Concept with Digital Financial Data and Graph Displays for Economic Analysis Generative AI. A dynamic image showcasing digital financial data and fluctuating stock market graphs. the red lines suggest market volatility, providing a powerful visual for economic analysis, investment strategies, or financial presentations. Generative AI
Free with trial A financial report with bar graph and line chart is a visual tool for business data analysis, offering insights for presentation, review, and strategic decision-making. Data analysis decrease vectors Vector art of financial report with bar graph and line chart, showing business data and analysis for presentation and review. A financial report with bar graph and line chart is a visual tool for business data analysis, offering insights for presentation, review, and strategic decision-making
Free with trial Line Graph Chart Icon. Data Analysis, Business Growth, And Statistical Trends Outline Symbol. Financial Performance Tracking. Editable Stroke. Isolated Vector Illustration. Data analysis decrease vectors Line Graph Chart Icon. Data Analysis, Business Growth, And Statistical Trends Outline Symbol. Financial Performance
Free with trial 3D Illustration Business Graph Chart Growth Success Analysis Finance Investment Strategy Data Market Stock Economy Trading Financial Progress Report. Data analysis decrease illustrations 3D Illustration Business Graph Chart Growth Success Analysis Finance Investment Strategy Data Market Stock Economy Trading
Free with trial Watercolor illustration of business growth. Orange bar, pie charts on aged paper show data analysis, market trends, financial progress. Visuals represent success, planning strategic. Data analysis decrease illustrations Watercolor illustration of business growth. Orange bar, pie charts on aged paper show data analysis, market trends, financial
Free with trial Closeup view of a pen resting on graph, suggesting data analysis or business planning ,Generative AI. Data analysis decrease illustrations Detailed view of a pen placed on graph, depicting financial analysis, business planning, and data interpretation for strategic. Closeup view of a pen resting on graph, suggesting data analysis or business planning ,Generative AI
Free with trial A business professional is seen working with a laptop and analyzing data charts to optimize performance The image showcases the concepts of quality improvement cost reduction strategic planning and target achievement highlighting the importance of data analysis and technology in modern business. Data analysis decrease illustrations Business professional optimizes performance with technology achieving quality improvement and cost reduction with data analysis. A business professional is seen working with a laptop and analyzing data charts to optimize performance The image showcases the concepts of quality improvement cost reduction strategic planning and target achievement highlighting the importance of data analysis and technology in modern business
Free with trial Global inflation trends shown on digital screen world map. Macroeconomic research paper presents finance economy data analysis. Study report shows online statistic, monitoring graph of. Data analysis decrease illustrations Global inflation trends shown on digital screen world map. Macroeconomic research paper presents finance economy data analysis.
Free with trial A percentage graph visually represents statistical data, showcasing trends, growth, and performance metrics for analysis and decision-making processes. Data analysis decrease vectors Vector art of a percentage graph illustrates statistical data, representing growth, progress, and performance analysis in a visual. A percentage graph visually represents statistical data, showcasing trends, growth, and performance metrics for analysis and decision-making processes
Free with trial Abstract financial chart with red bars and lines representing market decline, emphasizing data analysis and economics. Generative AI. Data analysis decrease illustrations Abstract financial chart with red bars and lines representing market decline, emphasizing data analysis and economics
Free with trial A minimalist black and white icon representing documents with an upward and downward arrow. This graphic symbolizes concepts like report generation, data analysis, growth, decline, upload, download, information flow, and business metrics. It's ideal for presentations, websites, and applications related to finance, business, technology, and data management. Data analysis decrease vectors Document Growth and Data Flow Icon. A minimalist black and white icon representing documents with an upward and downward arrow. This graphic symbolizes concepts like report generation, data analysis, growth, decline, upload, download, information flow, and business metrics. It's ideal for presentations, websites, and applications related to finance, business, technology, and data management.
Free with trial A clean, minimalist icon representing an analytics graph. It features a series of vertical bars of varying heights, symbolizing data or trends. A line graph with circular data points connects the tops of some of the bars, illustrating growth, progress, or fluctuations over time. This graphic is ideal for representing business intelligence, financial data, research, or any concept related to data analysis and performance. Data analysis decrease vectors Analytics Graph Icon with Data Points. A clean, minimalist icon representing an analytics graph. It features a series of vertical bars of varying heights, symbolizing data or trends. A line graph with circular data points connects the tops of some of the bars, illustrating growth, progress, or fluctuations over time. This graphic is ideal for representing business intelligence, financial data, research, or any concept related to data analysis and performance.
Free with trial A cartoon woman with brown hair in a ponytail, wearing a blue shirt and red pants, stands confidently between two bar graphs. The green graph on the left shows an increase, while the purple graph on the right shows a decrease. The image is a simple, illustrative representation of data analysis or business concepts. Data analysis decrease vectors Woman Standing Between Two Bar Graphs. A cartoon woman with brown hair in a ponytail, wearing a blue shirt and red pants, stands confidently between two bar graphs. The green graph on the left shows an increase, while the purple graph on the right shows a decrease. The image is a simple, illustrative representation of data analysis or business concepts.
Free with trial Downward graph trend with red points, sad face, and a file folder suggests failure, loss, or poor performance. Ideal for business, data, analysis, decline management error simple flat metaphor. Data analysis decrease vectors Declining Graph with Sad Face Emphasizing Negative Analytics and Data Loss. Downward graph trend with red points, sad face, and a file folder suggests failure, loss, or poor performance. Ideal for business, data, analysis, decline management error simple flat metaphor
Free with trial Chart with rising and falling trends on a grid board alongside a smaller cloud-connected line graph. Ideal for analytics, data analysis, statistics, forecasting, technology, research. Data analysis decrease illustrations Data Analytics Visualization with Graphs and Cloud Integration Concept. Chart with rising and falling trends on a grid board alongside a smaller cloud-connected line graph. Ideal for analytics, data analysis, statistics, forecasting, technology, research
Free with trial Blue growing chart and magnifying glass with falling coins inside. Market analysis, financial audit, growth tracking, decline detection, data insight concept. Digital futuristic low poly style Vector. Data analysis decrease vectors Blue growing chart and magnifying glass with falling coins inside. Market analysis, financial audit, growth tracking. Decline detection, data insight concept. Blue growing chart and magnifying glass with falling coins inside. Market analysis, financial audit, growth tracking, decline detection, data insight concept. Digital futuristic low poly style Vector.
Free with trial Bar chart icon showing three declining bars within a circular interface, symbolizing decreasing data, analytical trends, and financial performance concepts. Data analysis decrease vectors Decreasing bar chart data analysis statistics icon. Bar chart icon showing three declining bars within a circular interface, symbolizing decreasing data, analytical trends, and financial performance concepts
Free with trial Graph with curve, labeled axes, data table, hand with coin, and dollar symbols. Ideal for finance, business, economy, investment data visualization analytics simple landing page. Data analysis decrease illustrations Financial graph with data table, hand receiving coins, and analysis concept design. Graph with curve, labeled axes, data table, hand with coin, and dollar symbols. Ideal for finance, business, economy, investment data visualization analytics simple landing page
Free with trial Abstract financial data display showing fluctuating market trends. Data analysis decrease illustrations Glowing Financial Stock Market Data Analysis Chart. Abstract financial data display showing fluctuating market trends
Free with trial Bar graph showing decreasing values alongside arrows moving toward a minimal cloud. Ideal for data analysis, statistics, regression, performance tracking, economy, analytics, simple flat metaphor. Data analysis decrease vectors Declining Bar Chart with Arrows and Cloud Representing Regression or Data Flow. Bar graph showing decreasing values alongside arrows moving toward a minimal cloud. Ideal for data analysis, statistics, regression, performance tracking, economy, analytics, simple flat metaphor
Free with trial Line graph illustrating data analysis and business statistics, charting financial growth, market changes, and performance metrics for visual information and infographic content. Data analysis decrease illustrations Analyzing data with line graph showing business trends. Line graph illustrating data analysis and business statistics, charting financial growth, market changes, and performance metrics for visual information and infographic content
Free with trial Business performance, negative trends, data analysis, economic decline, search results, user concerns. Sad emoticon, graph with downward trend magnifying glass. Business and negative trends. Data analysis decrease vectors Declining Graph with Sad Face and Search Bar Negative Trends and Analysis. Business performance, negative trends, data analysis, economic decline, search results, user concerns. Sad emoticon, graph with downward trend magnifying glass. Business and negative trends
Free with trial Business analysis, performance tracking, resource management, environmental monitoring, sustainability, decline. Declining arrow with graph and water droplet. Business analysis and environmental. Data analysis decrease vectors Data Analysis Concept with Decline Arrow, Chart, and Blue Water Droplet Icon. Business analysis, performance tracking, resource management, environmental monitoring, sustainability, decline. Declining arrow with graph and water droplet. Business analysis and environmental
Free with trial Cardboard box with label beside a fluctuating line graph, denoting analytics, efficiency, shipment tracking, or delivery trends. Ideal for logistics, e-commerce, data trends, analysis operations. Data analysis decrease vectors Box with Shipping Label and Data Graph Representing Logistics and Performance Trends. Cardboard box with label beside a fluctuating line graph, denoting analytics, efficiency, shipment tracking, or delivery trends. Ideal for logistics, e-commerce, data trends, analysis operations
Free with trial Icon style image shows magnifying glass over finance data. Clean aesthetic with a black background and light colors. Data analysis decrease vectors Financial analysis magnifying glass looking at data bar graph. Icon style image shows magnifying glass over finance data. Clean aesthetic with a black background and light colors.
Free with trial Colorful pie chart is showing positive statistics and business growth, target and financial analysis and marketing report, data with copy space. Data analysis decrease vectors Colorful pie chart is showing positive statistics and business growth, target and financial analysis and marketing
Free with trial Flat style illustration showcasing business financial data analysis via a magnifying glass and graph chart visualization, isolated on black. Data analysis decrease vectors Analyzing Financial Data with Magnifying Glass and Graph Chart. Flat style illustration showcasing business financial data analysis via a magnifying glass and graph chart visualization, isolated on black.
Free with trial Sales analysis. Sales with charts highlighting performance and revenue decline. Sales data optimization for retail strategies, e-commerce insights, and business reports. Data analysis decrease vectors Data Analytics and Sales Decline Concept with Graphs and Marketing Visuals on Screen. Sales analysis. Sales with charts highlighting performance and revenue decline. Sales data optimization for retail strategies, e-commerce insights, and business reports
Free with trial Up and down arrows, bar graph, and fingerprint emphasize data analysis, growth, security, identity, biometrics, trends and technology. Ideal for business analytics privacy security technology. Data analysis decrease illustrations Arrows Indicating Trends With Bar Graph and Digital Fingerprint for Data and Security Concepts. Up and down arrows, bar graph, and fingerprint emphasize data analysis, growth, security, identity, biometrics, trends and technology. Ideal for business analytics privacy security technology
Free with trial Statistic Bar Chart Outline Sign Data Stats Business Performance Market Analysis Economic Trend Line Icon Presentation Display Board Symbol. Data analysis decrease vectors Statistic Bar Chart Outline Sign Data Stats Business Performance Market Analysis Economic Trend Line Icon Presentation Display
Free with trial Six simple line graphs showcase various data trends, including upward, downward, and fluctuating patterns. Each graph features key data points marked with letters. Data analysis decrease illustrations Six Line Graph Charts Data Visualization, Trends, Growth, Analysis. Six simple line graphs showcase various data trends, including upward, downward, and fluctuating patterns. Each graph features key data points marked with letters
Free with trial The image showcases a smartphone displaying financial data visualizations, including line graphs and bar charts. Additional icons and graphics related to data analysis and finance surround the phone, emphasizing the digital and analytical nature of the content. This composition was generated by AI,. Data analysis decrease illustrations Mobile Financial Data. The image showcases a smartphone displaying financial data visualizations, including line graphs and bar charts. Additional icons and graphics related to data analysis and finance surround the phone, emphasizing the digital and analytical nature of the content. This composition was generated by AI,
Free with trial Data combining line graph style illustration analysis visualization, ch series, point plot data combining line graph style. Data analysis decrease illustrations Data combining line graph style
Free with trial A comprehensive collection of 12 modern, abstract vector icons designed for business, finance, and data analytics themes. This vibrant set features geometric shapes, upward-trending bar charts, risk indicators, decision-making prompts like "YES" and "NO," and numerical data representations. Perfect for enhancing presentations, reports, websites, mobile applications, and infographics, these versatile symbols convey concepts of growth, strategy, risk management, market analysis, and progress with a clean, contemporary aesthetic. Data analysis decrease vectors Business and Data Analytics Abstract Icon Set. A comprehensive collection of 12 modern, abstract vector icons designed for business, finance, and data analytics themes. This vibrant set features geometric shapes, upward-trending bar charts, risk indicators, decision-making prompts like "YES" and "NO," and numerical data representations. Perfect for enhancing presentations, reports, websites, mobile applications, and infographics, these versatile symbols convey concepts of growth, strategy, risk management, market analysis, and progress with a clean, contemporary aesthetic.
Free with trial A display of financial data with charts, graphs, and statistics showing market trends and analysis details. Data analysis decrease illustrations Financial data charts showcasing stock market trends. A display of financial data with charts, graphs, and statistics showing market trends and analysis details
Free with trial Analysis spiraling line graph illustration curve plot, statistics diagram, increase decrease analysis spiraling line graph. Data analysis decrease illustrations Analysis spiraling line graph
Free with trial A clean and modern isometric bar graph illustration. Three colored bars, blue, green, and yellow, represent data points with corresponding numerical values displayed above each bar. The graphic is set against a white background, making it suitable for various presentations, reports, or website designs related to data analysis, business, or education. The simple design offers a clear visual representation of data comparison. Data analysis decrease illustrations Isometric Bar Graph Illustrating Data and Statistics. A clean and modern isometric bar graph illustration. Three colored bars, blue, green, and yellow, represent data points with corresponding numerical values displayed above each bar. The graphic is set against a white background, making it suitable for various presentations, reports, or website designs related to data analysis, business, or education. The simple design offers a clear visual representation of data comparison.
Free with trial Temperature melting line graph illustration data trend, analysis visualization, ice decrease temperature melting line graph. Data analysis decrease illustrations Temperature melting line graph
Free with trial Analysis stretching line graph illustration chvisualization axis, points curve, increase decrease analysis stretching line graph. Data analysis decrease illustrations Analysis stretching line graph
Free with trial A collection of nine flat vector icons for data visualization including bar graphs, line charts, pie charts, and performance meters isolated on a white background. Data analysis decrease vectors Simple black data analysis and business chart icon set. A collection of nine flat vector icons for data visualization including bar graphs, line charts, pie charts, and performance meters isolated on a white background
Free with trial Data analytics dashboard illustrating a mix of line graphs, bar charts, and data summaries, representing business growth, financial trends, and statistical insights for market analysis. Data analysis decrease vectors Data analytics dashboard showing business growth and decline. Data analytics dashboard illustrating a mix of line graphs, bar charts, and data summaries, representing business growth, financial trends, and statistical insights for market analysis
Free with trial A simple yet impactful vector icon of a downward-pointing arrow, symbolizing a negative trend, decline, or decrease. This design is ideal for financial reports, economic indicators, market analysis, or any data visualization requiring a clear representation of reduction or downturns, vector design Generative AI. Data analysis decrease vectors Downward Trend Arrow, Market Decline, vector design Generative AI. A simple yet impactful vector icon of a downward-pointing arrow, symbolizing a negative trend, decline, or decrease. This design is ideal for financial reports, economic indicators, market analysis, or any data visualization requiring a clear representation of reduction or downturns, vector design Generative AI
Free with trial This image shows a simple line graph with increasing and decreasing trends, ideal for visualizing data analysis and presenting key findings. The graph uses a clean, minimalist design to highlight the data points and overall trend. Perfect for presentations and reports. Data analysis decrease illustrations Analyze Your Data. This image shows a simple line graph with increasing and decreasing trends, ideal for visualizing data analysis and presenting key findings. The graph uses a clean, minimalist design to highlight the data points and overall trend. Perfect for presentations and reports.
Free with trial A detailed view of gold bars and coins under a magnifying glass, set against a backdrop of financial charts and data streams. The image evokes a sense of careful scrutiny and investment analysis in the financial markets. The shiny gold textures contrast with the digital screens, creating a blend of. Data analysis decrease illustrations Golden Investment Analysis. A detailed view of gold bars and coins under a magnifying glass, set against a backdrop of financial charts and data streams. The image evokes a sense of careful scrutiny and investment analysis in the financial markets. The shiny gold textures contrast with the digital screens, creating a blend of
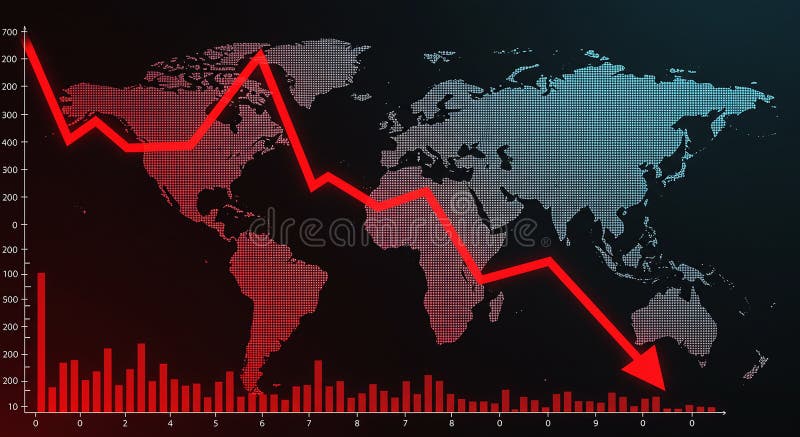
Free with trial World map with a red declining line graph overlay, illustrating a decrease or economic downturn. The graph features sharp declines across various data points, reflecting a downward trend. Red bar chart at the bottom represents additional numerical data against a black background. The map uses a dotted pattern for continents, highlighting regions globally. The image conveys financial analysis, market trends, or economic statistics. Data analysis decrease illustrations World map with a red declining line graph overlay
Free with trial Bar chart icon representing data visualization, financial growth, business analytics, and market trends, indicating increasing and decreasing values for decision making. Data analysis decrease vectors Bar chart icon showing data analysis and statistics. Bar chart icon representing data visualization, financial growth, business analytics, and market trends, indicating increasing and decreasing values for decision making
Free with trial A prominent 3D metallic US dollar sign stands against a dynamic digital background featuring various financial charts and graphs. The background displays a fluctuating line graph and a colorful bar chart, symbolizing market trends, economic data, and investment performance. This image powerfully conveys concepts of finance, global economy, currency strength, stock market analysis, and wealth management in a modern, digital context. Ideal for illustrating reports, presentations, or articles related to business, banking, and financial growth. Data analysis decrease illustrations US Dollar Symbol with Digital Financial Charts and Market Data. A prominent 3D metallic US dollar sign stands against a dynamic digital background featuring various financial charts and graphs. The background displays a fluctuating line graph and a colorful bar chart, symbolizing market trends, economic data, and investment performance. This image powerfully conveys concepts of finance, global economy, currency strength, stock market analysis, and wealth management in a modern, digital context. Ideal for illustrating reports, presentations, or articles related to business, banking, and financial growth.
Free with trial Set Browser window Graph chart infographic Cloud technology data transfer upload Mobile phone incognito and Financial growth decrease icon. Vector. Data analysis decrease illustrations Set Browser window, Graph chart infographic, Cloud technology data transfer, upload, Mobile phone, incognito and. Set Browser window Graph chart infographic Cloud technology data transfer upload Mobile phone incognito and Financial growth decrease icon. Vector.
Free with trial This vector illustration set features six distinct icons representing key financial and economic concepts. It includes bar charts depicting growth with a green arrow and decline with a red arrow, alongside currency exchange rate indicators for USD, INR, and EUR. Two donut charts visualize data distribution, while a world map colored green and red signifies global market trends or segmentation. Ideal for business presentations, financial reports, economic analysis, and investment-related content, these versatile graphics convey complex data clearly and concisely. Data analysis decrease vectors Financial Growth, Decline, and Global Market Data Visualization Icons Set. This vector illustration set features six distinct icons representing key financial and economic concepts. It includes bar charts depicting growth with a green arrow and decline with a red arrow, alongside currency exchange rate indicators for USD, INR, and EUR. Two donut charts visualize data distribution, while a world map colored green and red signifies global market trends or segmentation. Ideal for business presentations, financial reports, economic analysis, and investment-related content, these versatile graphics convey complex data clearly and concisely.
Free with trial Abstract 3d bar charts illustrating data visualization, financial statistics, and business analysis, presenting growth and decline trends in a report format. Data analysis decrease illustrations Business data visualization showing 3d bar graphs. Abstract 3d bar charts illustrating data visualization, financial statistics, and business analysis, presenting growth and decline trends in a report format
Free with trial Blue bar chart with decreasing values beside a soft cloud shape and horizontal lines. Ideal for data analytics, cloud computing, business growth, technology, forecasts, trends, and innovation. Simple. Data analysis decrease illustrations Minimalist Bar Chart with Cloud Element Representing Data Analysis and Cloud Computing Concepts. Blue bar chart with decreasing values beside a soft cloud shape and horizontal lines. Ideal for data analytics, cloud computing, business growth, technology, forecasts, trends, and innovation. Simple
Free with trial A white line graph with connected points and a bar chart are shown within a dark gray circle icon, representing data analysis. Data analysis decrease illustrations White line graph and bar chart in a dark gray circle icon data statistics. A white line graph with connected points and a bar chart are shown within a dark gray circle icon, representing data analysis
Free with trial A red downward-trending arrow overlays a background of financial documents featuring colorful charts and graphs. A person in a suit is writing on one of the pages, indicating analysis or note-taking. The setting suggests a focus on market trends, possibly within a corporate or financial context. The grid pattern across the image adds a conceptual element of data analysis. a i generated. Data analysis decrease illustrations Declining market trends analysis with a downward trending red arrow overlay. A red downward-trending arrow overlays a background of financial documents featuring colorful charts and graphs. A person in a suit is writing on one of the pages, indicating analysis or note-taking. The setting suggests a focus on market trends, possibly within a corporate or financial context. The grid pattern across the image adds a conceptual element of data analysis. a i generated
Free with trial Set Browser with stocks market Financial growth Pie chart infographic Binary code Cloud computing lock Search data analysis and Data icon. Vector. Data analysis decrease vectors Set Browser with stocks market, Financial growth, Pie chart infographic, Binary code, Cloud computing lock, Search data. Set Browser with stocks market Financial growth Pie chart infographic Binary code Cloud computing lock Search data analysis and Data icon. Vector.
Free with trial A set of twelve black icons representing business and data analysis concepts, presented on a white background. The icons include various types of charts and graphs such as bar charts, a pie chart, and line graphs showing trends and fluctuations. There are also icons for data visualization, progress indicators, and reports. The collection is organized in a 3x4 grid. Data analysis decrease vectors Business and data analytics icons bar chart pie chart AI-Generated. A set of twelve black icons representing business and data analysis concepts, presented on a white background. The icons include various types of charts and graphs such as bar charts, a pie chart, and line graphs showing trends and fluctuations. There are also icons for data visualization, progress indicators, and reports. The collection is organized in a 3x4 grid