Free with trial Business Data Analysis Charts Graphs People Teamwork, isolated on white background. Data analysis decrease illustrations Business Data Analysis Charts Graphs People Teamwork, isolated on white background
Free with trial A clear vector icon of a minus sign with a magnifying glass, symbolizing zoom out, decrease view, or subtract function. Ideal for image editing, map navigation, and data analysis, this design allows users to reduce magnification or remove elements, providing versatile control over content display, vector design Generative AI. Data analysis decrease vectors Zoom Out: Decrease View and Subtract Icon, vector design Generative AI. A clear vector icon of a minus sign with a magnifying glass, symbolizing zoom out, decrease view, or subtract function. Ideal for image editing, map navigation, and data analysis, this design allows users to reduce magnification or remove elements, providing versatile control over content display, vector design Generative AI
Free with trial A bold black line graph icon showing a downward trend with an arrow. Symbolizes financial downturn, sales decrease, or negative performance metrics. Clear visual for business reports and data analysis indicating a decline value. vector design Generative AI. Data analysis decrease vectors Bold Decreasing Line Graph Icon Financial Downturn Data vector design Generative AI. A bold black line graph icon showing a downward trend with an arrow. Symbolizes financial downturn, sales decrease, or negative performance metrics. Clear visual for business reports and data analysis indicating a decline value. vector design Generative AI
Free with trial Line art illustration of a bar chart depicting financial decrease for business analysis. Data analysis decrease vectors Line art illustration of a bar chart depicting financial decrease for business analysis
Free with trial Clipboard with bar graph showcasing data analysis and reporting ,Generative ai. Data analysis decrease illustrations Clipboard with bar graph, data analysis, reporting, and business performance visualization. Clipboard with bar graph showcasing data analysis and reporting ,Generative ai
Free with trial Glass display with a bar chart, analysis of trends, transparent screen with data visualization ,Generative ai. Data analysis decrease illustrations Glass display bar chart, data visualization, trend analysis, and transparent screen technology. Glass display with a bar chart, analysis of trends, transparent screen with data visualization ,Generative ai
Free with trial Colorful bar chart analysis: growth, trends, and data visualization on a wooden table ,Generative ai. Data analysis decrease illustrations Colorful bar chart data analysis, visualizing growth trends and performance on a wooden table. Colorful bar chart analysis: growth, trends, and data visualization on a wooden table ,Generative ai
Free with trial Business Strategy and Analysis: Lightbulb, Magnifying Glass, Briefcases, and Data Illustration. Data analysis decrease vectors Business Strategy and Analysis Lightbulb Magnifying Glass Briefcases and Data Illustration.
Free with trial The image depicts a 3D bar graph with red bars, showing a clear downward trend. The bars decrease in height from left to right, indicating a significant decline in the measured data. An arrow points downwards, emphasizing the negative trend. Data analysis decrease illustrations A downward trending graph illustrating a significant decrease in data points over time. The image depicts a 3D bar graph with red bars, showing a clear downward trend. The bars decrease in height from left to right, indicating a significant decline in the measured data. An arrow points downwards, emphasizing the negative trend
Free with trial Line art icon representing financial audit and data analysis of a declining business report. Data analysis decrease vectors Line art icon representing financial audit and data analysis of a declining business report
Free with trial Line Graph Chart Line And Solid Icon Set. Data Analysis, Trend Visualization, And Business Growth Symbol Collection. Statistical Representation And Performance Tracking. Isolated Vector Illustration. Data analysis decrease vectors Line Graph Chart Line And Solid Icon Set. Data Analysis, Trend Visualization, And Business Growth Symbol Collection
Free with trial Colorful business charts and graphs showing financial growth, data analysis, and stock market trends, ideal for corporate presentations and reports. Data analysis decrease illustrations Business data analysis charts graphs financial growth stock market trend generative ai. colorful business charts and graphs showing financial growth, data analysis, and stock market trends, ideal for corporate presentations and reports.
Free with trial This image features four different types of graphs and charts that illustrate various trends and data analysis. These visual representations include bar graphs, line graphs, and 3D block charts. Data analysis decrease illustrations Graphs and charts showing trends and data analysis isolated on transparent background. This image features four different types of graphs and charts that illustrate various trends and data analysis. These visual representations include bar graphs, line graphs, and 3D block charts
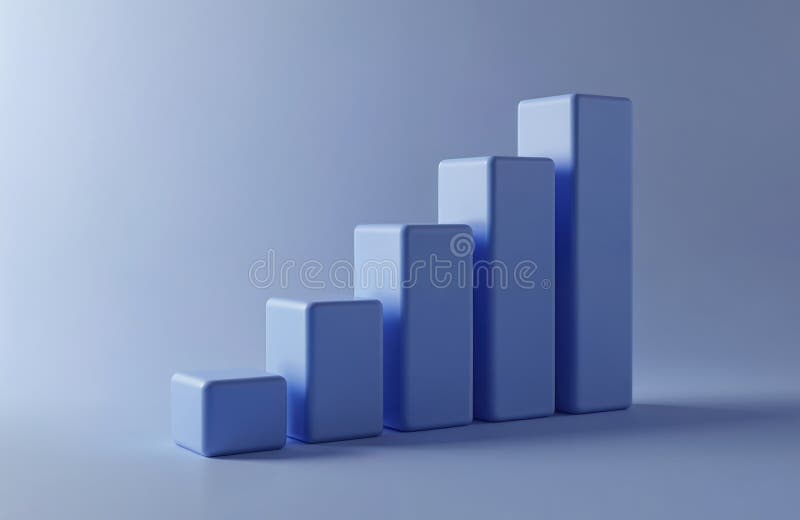
Free with trial Descending bar graph on blue background. 3D render data visualization. Financial market chart, business analysis concept. Economic loss, falling sales, statistics. Ideal for. Data analysis decrease illustrations Descending bar graph on blue background. 3D render data visualization. Financial market chart, business analysis concept.
Free with trial Pink bar chart report on wooden table displaying progress data analysis ,Generative ai. Data analysis decrease illustrations Pink bar chart report displaying progress data analysis on wooden table for business insights. Pink bar chart report on wooden table displaying progress data analysis ,Generative ai
Free with trial Collection of icons showing different types of charts graphs and data analysis tools isolated on transparent background. Data analysis decrease vectors Set of various icons representing business data analysis and statistics with charts and graphs. Collection of icons showing different types of charts graphs and data analysis tools isolated on transparent background
Free with trial Man points red arrow on bar chart for analysis professional highlights data trend with arrow on chart,Generative AI. Data analysis decrease illustrations Man points red arrow on bar chart for analysis professional highlights data trend with arrow on chart
Free with trial A dynamic visual representation showcases interest rate volatility, featuring fluctuating lines, percentage symbols, and financial data analysis. The display creates a sense of market flux and economic shifts. Ideal for illustrating financial news, investment strategies, economic forecasts, and mark. Data analysis decrease illustrations Interest Rate Volatility Display Showing Financial Data Trends and Fluctuations for Market Analysis. A dynamic visual representation showcases interest rate volatility, featuring fluctuating lines, percentage symbols, and financial data analysis. The display creates a sense of market flux and economic shifts. Ideal for illustrating financial news, investment strategies, economic forecasts, and mark
Free with trial This is an detailed set of clean line icons for infographic design, corporate data analysis, and finance. Data analysis decrease vectors Clean infographic symbols for corporate data analysis and financial tracking applications. This is an detailed set of clean line icons for infographic design, corporate data analysis, and finance
Free with trial Abstract financial trading graph with candlestick charts and data analysis on a dark background. Data analysis decrease illustrations Abstract financial trading graph with candlestick charts and data analysis on a dark background
Free with trial Set of icons featuring different types of charts and graphs used for data analysis and business growth isolated on transparent background. Data analysis decrease vectors Collection of various icons representing data analysis and business growth with charts and graphs. Set of icons featuring different types of charts and graphs used for data analysis and business growth isolated on transparent background
Free with trial Colorful bar chart on a blue background showing data analysis and statistical growth. Generative AI. Data analysis decrease illustrations Colorful bar chart on a blue background showing data analysis and statistical growth
Free with trial Financial Data Chart Analysis with Glowing Stock Market Uptrend Graph in Blue and Orange Colors, Generated by AI. Data analysis decrease illustrations Financial Data Chart Analysis with Glowing Stock Market Uptrend Graph in Blue and Orange Colors. Generated by AI
Free with trial Futuristic 3D bar graph displaying quarterly sales data with falling trend. Economic loss concept market crisis analysis illustration. Business finance investment report. Declining. Data analysis decrease illustrations Futuristic 3D bar graph displaying quarterly sales data with falling trend. Economic loss concept, market crisis analysis. Futuristic 3D bar graph displaying quarterly sales data with falling trend. Economic loss concept market crisis analysis illustration. Business finance investment report. Declining.
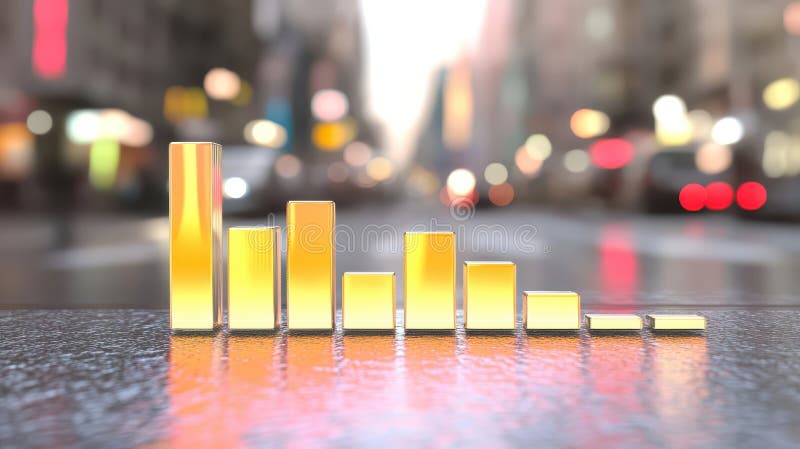
Free with trial Close-up view of city street with bar chart overlay, visualizing urban data analysis ,Generative AI. Data analysis decrease illustrations Urban data analysis, closeup view of city street with bar chart visualization closeup. Close-up view of city street with bar chart overlay, visualizing urban data analysis ,Generative AI
Free with trial Set of icons illustrating data analysis and business analytics with various charts graphs and tools isolated on transparent background. Data analysis decrease vectors Collection of icons representing data analysis and business analytics with various charts graphs and tools. Set of icons illustrating data analysis and business analytics with various charts graphs and tools isolated on transparent background
Free with trial A comprehensive data analysis icon set, ideal for illustrating data processing, teamwork dynamics, chart analysis, and various analytical tools, all on a white backdrop. Data analysis decrease vectors Vector art of data analysis icon set, featuring data processing, teamwork, charts, and various analytical tools and. A comprehensive data analysis icon set, ideal for illustrating data processing, teamwork dynamics, chart analysis, and various analytical tools, all on a white backdrop
Free with trial Collection of black vector icons featuring downward trending charts, magnifying glass over bar graph, document reports, and computer screen data analysis symbols representing financial decline and analytics. Generative AI. Data analysis decrease vectors Black icons set showing downward trending graphs analysis with document reports magnifying glass and data visualization. Collection of black vector icons featuring downward trending charts, magnifying glass over bar graph, document reports, and computer screen data analysis symbols representing financial decline and analytics. Generative AI
Free with trial Financial Capability Month Colorful graphs and charts representing financial data analysis on desk. Data analysis decrease illustrations Financial Capability Month Colorful graphs and charts representing financial data analysis on desk
Free with trial Comprehensive data visualization, graphs and charts on a computer monitor for trend analysis reporting ,Generative AI. Data analysis decrease illustrations Comprehensive data visualization, graphs and charts on a computer monitor for trend analysis reporting
Free with trial A visually stunning digital depiction of stock market analysis featuring colorful graphs and bars that represent current finance trends and data insights. Data analysis decrease illustrations Stock market analysis with colorful graphs and bars indicating data trends in a futuristic digital space. A visually stunning digital depiction of stock market analysis featuring colorful graphs and bars that represent current finance trends and data insights
Free with trial A set of business and data analysis icons, perfect for presentations, reports, and dashboards. These icons cover various aspects of data management and reporting. Data analysis decrease vectors Vector art of collection of business and data analysis icons, representing various aspects of data management and reporting. A set of business and data analysis icons, perfect for presentations, reports, and dashboards. These icons cover various aspects of data management and reporting
Free with trial Visualizing india's economic downturn with a stock market crash chart. the red graph highlights financial recession, data analysis, and downward trends on the map, indicating a crisis situation. Data analysis decrease illustrations India economic crisis stock market crash concept financial recession chart graph down trend analysis data map. visualizing india's economic downturn with a stock market crash chart. the red graph highlights financial recession, data analysis, and downward trends on the map, indicating a crisis situation.
Free with trial This image showcases data analysis and cloud computing icons, including graphs, security, funnel, magnifying glass, error, and data processing, all in one visual. Data analysis decrease vectors Vector art of data analysis and cloud computing icons, featuring graphs, security, funnel, magnifying glass, error, and data. This image showcases data analysis and cloud computing icons, including graphs, security, funnel, magnifying glass, error, and data processing, all in one visual
Free with trial Data analysis highlighted with a graph showing key findings. Line charts, reports, research, and scientific documents point to insights and results. Data analysis decrease illustrations Analyzing Data Finger points to a graph showing the data, line, chart, analysis, information, report, science, document, results. Data analysis highlighted with a graph showing key findings. Line charts, reports, research, and scientific documents point to insights and results
Free with trial FMEA analysis infographic template with round vertical box container gradually decrease on right column dark background style with 4 point for slide presentation vector. Data analysis decrease illustrations FMEA analysis infographic template with round vertical box container gradually decrease on right column dark background style with
Free with trial Colorful bar chart displayed on a polished wooden table, representing data analysis and visualization ,Generative ai. Data analysis decrease illustrations Colorful bar chart on wooden table, visualizing data analysis, trends, and performance metrics for business insights. Colorful bar chart displayed on a polished wooden table, representing data analysis and visualization ,Generative ai
Free with trial A colorful bar chart overlays blueprint showcasing data visualization for business analysis colorful on top of blueprinted paper ,Generative ai. Data analysis decrease illustrations A vibrant and informative colorful bar chart displayed on top of detailed blueprinted paper for comprehensive data analysis. A colorful bar chart overlays blueprint showcasing data visualization for business analysis colorful on top of blueprinted paper ,Generative ai
Free with trial This image displays financial performance indicators, highlighting data trends and market volatility. It represents economic analysis and strategic decision-making processes. Data analysis decrease vectors Vector art of financial performance indicators, showcasing data trends, market volatility, and economic analysis for strategic. This image displays financial performance indicators, highlighting data trends and market volatility. It represents economic analysis and strategic decision-making processes
Free with trial Modern abstract zigzag-shaped chart depicting fluctuations in data analysis representing concept. Data analysis decrease illustrations Modern abstract zigzag-shaped line chart representing fluctuations in data analysis concept. Modern abstract zigzag-shaped chart depicting fluctuations in data analysis representing concept
Free with trial Colorful bar chart with a line graph presenting trends and data growth over time, ideal for business analysis, marketing presentations, and financial reports. Data analysis decrease illustrations Colorful Bar Chart with Line Graph Illustrating Trends and Data Growth over Time For Business, Marketing, Finance and Analysis Use. Colorful bar chart with a line graph presenting trends and data growth over time, ideal for business analysis, marketing presentations, and financial reports
Free with trial Man in blue shirt analyzing colorful bar chart, business performance review and data analysis,Generative AI. Data analysis decrease illustrations Man in blue shirt analyzing colorful bar chart, business performance review and data analysis
Free with trial Laptop screen displays stock market analysis. Financial data shows investment trends. Person may trader analyst. Investment stock market analysis. Dynamic market graphs. Modern tech. Data analysis decrease illustrations Laptop screen displays stock market analysis. Financial data shows investment trends. Person may trader analyst. Investment
Free with trial Analysis of website traffic using magnifying glass on laptop. Detailed data, graphs reviewed for blog ranking. Online marketing, business performance monitoring key. Research. Data analysis decrease illustrations Analysis of website traffic using magnifying glass on laptop. Detailed data, graphs reviewed for blog ranking. Online marketing
Free with trial Close-up view of a graph with vibrant blue background. detailed analysis of data trends, insights, and patterns ,Generative AI. Data analysis decrease illustrations Detailed analysis, exploring data trends and patterns in vibrant blue graph. closeup view of business performance market insights. Close-up view of a graph with vibrant blue background. detailed analysis of data trends, insights, and patterns ,Generative AI
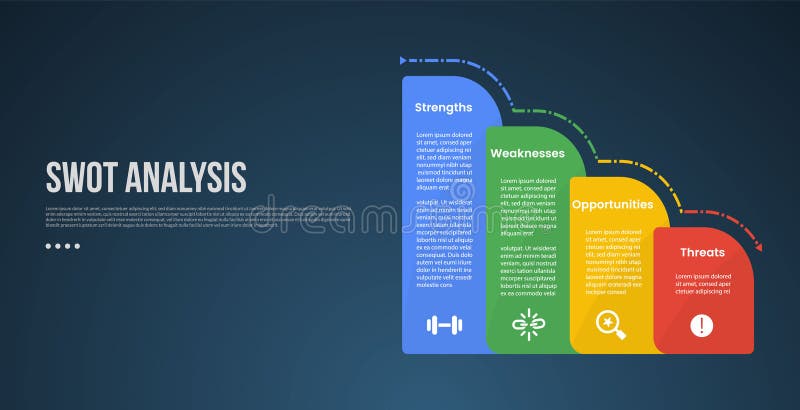
Free with trial SWOT business analysis infographic template with round vertical box container gradually decrease on right column with dark background style. Data analysis decrease illustrations SWOT business analysis infographic template with round vertical box container gradually decrease on right column with dark
Free with trial A vibrant 3D bar chart icon isolated on a clean white background. This minimalist data visualization features five colorful bars in a soft, pastel palette of yellow, pink, and purple, arranged in descending order. The clean, modern render is perfect for illustrating concepts like business statistics, financial reports, market analysis, and performance metrics. An ideal graphic element for presentations, infographics, websites, and educational materials, symbolizing data, comparison, and analytics in a visually appealing way. 3D illustration. Data analysis decrease illustrations 3D Colorful Bar Chart for Business and Data Analysis. A vibrant 3D bar chart icon isolated on a clean white background. This minimalist data visualization features five colorful bars in a soft, pastel palette of yellow, pink, and purple, arranged in descending order. The clean, modern render is perfect for illustrating concepts like business statistics, financial reports, market analysis, and performance metrics. An ideal graphic element for presentations, infographics, websites, and educational materials, symbolizing data, comparison, and analytics in a visually appealing way. 3D illustration.
Free with trial Data disintegrating line graph illustration trend dec, decrease fall, analysis visualization data disintegrating line graph. Data analysis decrease illustrations Data disintegrating line graph
Free with trial A simple and modern black silhouette icon of a business graph, isolated on a white background. This flat vector illustration combines a bar chart with an overlaid line graph, showing a fluctuating trend with a general decline. The graphic symbolizes concepts such as data analysis, financial reporting, market statistics, economic downturn, and business performance metrics. It's an ideal visual element for presentations, infographics, websites, and applications related to finance, economics, and analytics, representing concepts of decrease, loss, or market volatility. Data analysis decrease vectors Business Data Analytics Chart Icon. A simple and modern black silhouette icon of a business graph, isolated on a white background. This flat vector illustration combines a bar chart with an overlaid line graph, showing a fluctuating trend with a general decline. The graphic symbolizes concepts such as data analysis, financial reporting, market statistics, economic downturn, and business performance metrics. It's an ideal visual element for presentations, infographics, websites, and applications related to finance, economics, and analytics, representing concepts of decrease, loss, or market volatility.
Free with trial Abstract financial chart with red bars and lines representing market decline, emphasizing data analysis and economics. Generative AI. Data analysis decrease illustrations Abstract financial chart with red bars and lines representing market decline, emphasizing data analysis and economics
Free with trial Abstract financial chart with red bars and lines representing market decline, emphasizing data analysis and economics. Generative AI. Data analysis decrease illustrations Abstract financial chart with red bars and lines representing market decline, emphasizing data analysis and economics
Free with trial Abstract financial chart with red bars and lines representing market decline, emphasizing data analysis and economics. Generative AI. Data analysis decrease illustrations Abstract financial chart with red bars and lines representing market decline, emphasizing data analysis and economics
Free with trial A hand-drawn illustration depicting a presentation on data trends. A stick figure presenter, holding a microphone, points to a chart on a screen labeled "DATA TRENDS. " The chart displays a line graph and bar graphs, suggesting growth and analysis. This image is suitable for illustrating business concepts, data analysis, presentations, and financial reports. It conveys a sense of information, communication, and progress. Data analysis decrease vectors Data Presentation: Business Trends and Analysis. A hand-drawn illustration depicting a presentation on data trends. A stick figure presenter, holding a microphone, points to a chart on a screen labeled "DATA TRENDS." The chart displays a line graph and bar graphs, suggesting growth and analysis. This image is suitable for illustrating business concepts, data analysis, presentations, and financial reports. It conveys a sense of information, communication, and progress.
Free with trial A collection of financial chart icons, showcasing data analysis and business growth concepts. The image features multiple variations of a line graph and bar chart combination, presented in both grayscale and beige color schemes. These icons are ideal for illustrating financial reports, business presentations, market trends, and data visualization projects. The clean, modern design makes them suitable for a wide range of applications. Data analysis decrease vectors Financial Chart Icons: Business and Data Analysis. A collection of financial chart icons, showcasing data analysis and business growth concepts. The image features multiple variations of a line graph and bar chart combination, presented in both grayscale and beige color schemes. These icons are ideal for illustrating financial reports, business presentations, market trends, and data visualization projects. The clean, modern design makes them suitable for a wide range of applications.
Free with trial Colorful bar and pie charts illustrate data analysis white background. Data analysis decrease illustrations Colorful bar and pie charts illustrate data analysis
Free with trial Global finance data analysis on keyboard with charts, stunning background Generative AI. Data analysis decrease illustrations Global finance data analysis on keyboard with charts
Free with trial Laptop displaying a graph, visualizing data analysis and market trends for business decisions ,Generative ai. Data analysis decrease illustrations Laptop with graph, data analysis for market trends and business decisions. Laptop displaying a graph, visualizing data analysis and market trends for business decisions ,Generative ai
Free with trial Line chart is representing a decreasing trend in statistical data analysis. Data analysis decrease vectors Statistical data analysis with line chart showing decreasing trend. Line chart is representing a decreasing trend in statistical data analysis
Free with trial Calculator alongside arrows indicating increase and decrease, and a line graph with fluctuations. Ideal for finance, budgeting, economics, analysis, statistics, decision-making, simple flat metaphor. Data analysis decrease illustrations Calculator with Arrows and Graph Representing Financial Analysis and Data Trends. Calculator alongside arrows indicating increase and decrease, and a line graph with fluctuations. Ideal for finance, budgeting, economics, analysis, statistics, decision-making, simple flat metaphor
Free with trial Dynamic visualization of financial market data showcasing trends and statistics. Ideal for essays, reports, and presentations on economic analysis and investment strategies. Data analysis decrease illustrations Financial Market Analysis with Data Chart Display and Trends. Dynamic visualization of financial market data showcasing trends and statistics. Ideal for essays, reports, and presentations on economic analysis and investment strategies
Free with trial A simple outline icon illustration of a bar chart diagram, used to display data analysis and performance metrics. Ideal for presentations, infographics, and dashboards. Data analysis decrease vectors Outline Simple Bar Chart Diagram Icon Graphic for Data Analysis. A simple outline icon illustration of a bar chart diagram, used to display data analysis and performance metrics. Ideal for presentations, infographics, and dashboards.
Free with trial Man Views Red Green Financial Data On Screen At Desk For Analysis , monochrome style. Data analysis decrease illustrations Man Views Red Green Financial Data On Screen At Desk For Analysis
Free with trial Bar graph and line chart showing performance decline, icons of person and movement, and a sad face symbol. Ideal for data trends, business analysis, failure, mood, feedback, decision-making. Data analysis decrease illustrations Declining Trends in Data Analysis with Emotional Impact Represented by Sad Face Icon. Bar graph and line chart showing performance decline, icons of person and movement, and a sad face symbol. Ideal for data trends, business analysis, failure, mood, feedback, decision-making
Free with trial Dynamic financial graphs and data analysis display on digital screen. That the image is generated using AI. Data analysis decrease illustrations Dynamic financial graphs and data analysis display on digital screen
Free with trial This 3D rendering shows vibrant bar and pie charts illustrating business growth, data analysis, and statistical visualization. Perfect for presentations, reports, or marketing materials. Data analysis decrease illustrations Colorful 3D Bar and Pie Charts Representing Business Growth and Data Analysis. This 3D rendering shows vibrant bar and pie charts illustrating business growth, data analysis, and statistical visualization. Perfect for presentations, reports, or marketing materials.
Free with trial Teal bar chart illustration for data visualization and statistical analysis. Data analysis decrease vectors Teal bar chart illustration for data visualization and statistical analysis
Free with trial Computer Monitor with a Graph Showing Decreasing Bar Chart for Data Analysis. Data analysis decrease vectors Computer Monitor with a Graph Showing Decreasing Bar Chart for Data Analysis
Free with trial Data analysis graphs with up and down arrow line icons set. Increase and reduction of economy or trend charts, price boost, stock market research thin black and red outline symbols vector illustration. Data analysis decrease vectors Data analysis graphs with up and down arrow, economy or trend charts line icons set. Data analysis graphs with up and down arrow line icons set. Increase and reduction of economy or trend charts, price boost, stock market research thin black and red outline symbols vector illustration
Free with trial Calculator with purple screen, upward-trending performance graph, and downward arrow. Ideal for finance, accounting, budgeting, data analysis, cost reduction, investment strategy simple flat. Data analysis decrease vectors Financial calculation with a calculator, performance graph, and downward arrow for data analysis. Calculator with purple screen, upward-trending performance graph, and downward arrow. Ideal for finance, accounting, budgeting, data analysis, cost reduction, investment strategy simple flat
Free with trial Increase and reduction of economy or trend charts, price boost, stock market research thin black outline symbols vector illustration. Data analysis graphs with up and down arrow line icons set. Data analysis decrease vectors Data analysis graphs with up and down arrow, economy or trend charts line icons set. Increase and reduction of economy or trend charts, price boost, stock market research thin black outline symbols vector illustration. Data analysis graphs with up and down arrow line icons set.
Free with trial Business graph data analysis on wooden desk with pencils, bananas and notebooks. Data analysis decrease illustrations Business graph data analysis on wooden desk with pencils, bananas and notebooks
Free with trial A vector icon illustrating a downward trending line graph, symbolizing a decline, decrease, or negative performance. Ideal for financial reports, data analysis dashboards, or warning indicators. This clear and concise graphic is scalable, perfect for conveying trend information in various digital interfaces, vector design Generative AI. Data analysis decrease vectors Declining Trend Graph Icon - Downturn Analysis Symbol, vector design Generative AI. A vector icon illustrating a downward trending line graph, symbolizing a decline, decrease, or negative performance. Ideal for financial reports, data analysis dashboards, or warning indicators. This clear and concise graphic is scalable, perfect for conveying trend information in various digital interfaces, vector design Generative AI
Free with trial A Red bar graph representing data growth on wooden surface, showcasing trends and analysis, Generative AI. Data analysis decrease illustrations Red bar graph representing data growth on wooden surface, showcasing trends and analysis
Free with trial Purple graph with bar chart visually representing data analysis and growth ,Generative ai. Data analysis decrease illustrations Purple graph with bar chart, visual representation of data analysis, growth, and business trends. Purple graph with bar chart visually representing data analysis and growth ,Generative ai
Free with trial Colorful bar chart on a blue background showing data analysis and statistical growth. Generative AI. Data analysis decrease illustrations Colorful bar chart on a blue background showing data analysis and statistical growth
Free with trial Set pop art Coal mine trolley, Data analysis, and Financial growth decrease icon. Vector. Data analysis decrease illustrations Set pop art Coal mine trolley, Data analysis, and Financial growth decrease icon. Vector
Free with trial Abstract colorful bar charts display statistical data and financial trend analysis. Data analysis decrease vectors Colorful abstract bar charts representing data analysis and statistical visualization. Abstract colorful bar charts display statistical data and financial trend analysis.
Free with trial Bar chart graph. Colorful falling arrow. Financial data analysis. Vector business symbol. EPS 10. Data analysis decrease vectors Bar chart graph. Colorful falling arrow. Financial data analysis. Vector business symbol.
Free with trial Close-up view of a computer monitor displaying a vibrant bar chart, indicating data analysis and progress tracking ,Generative ai. Data analysis decrease illustrations Computer monitor displaying a colorful bar chart for data analysis and progress tracking. Close-up view of a computer monitor displaying a vibrant bar chart, indicating data analysis and progress tracking ,Generative ai