Free with trial Vibrant 3D red bar chart illustrating declining growth trends for business analytics, finance reports, and data visualization projects. Data analysis decrease vectors 3D red bar chart decreasing growth business data analysis concept. Vibrant 3D red bar chart illustrating declining growth trends for business analytics, finance reports, and data visualization projects
Free with trial Global financial market chart with downward arrows candlestick data and world map background representing stock decline economic crisis trading volatility and investment risk analysis. Data analysis decrease illustrations AI generated global financial market chart with downward arrows candlestick data and world map background representing stock. global financial market chart with downward arrows candlestick data and world map background representing stock decline economic crisis trading volatility and investment risk analysis
Free with trial Bright and colorful bar graph created with blocks illustrates data visualization in a contemporary business context. Ideal for finance and marketing materials. Data analysis decrease illustrations Colorful bar graph made of building blocks representing data visualization and analysis in modern business graphics on a clean. Bright and colorful bar graph created with blocks illustrates data visualization in a contemporary business context. Ideal for finance and marketing materials
Free with trial Colorful bar chart visualizing business data, financial growth, and market analysis with a retro aesthetic. Data analysis decrease illustrations Colorful geometric bar chart displaying data visualization progress. Colorful bar chart visualizing business data, financial growth, and market analysis with a retro aesthetic
Free with trial Abstract red chart illustrating data trends and fluctuations in finance. This graphic represents market analysis, ideal for professional reports and presentations. Data analysis decrease vectors Red Chart Illustration Showing Data Trends and Variations in Finance. Abstract red chart illustrating data trends and fluctuations in finance. This graphic represents market analysis, ideal for professional reports and presentations
Free with trial An open textbook displays a vertical bar graph composed of six brightly colored orange, yellow, and red bars arranged from highest to lowest, symbolizing data analysis, statistical growth, and performance metrics, set against a plain beige background with scattered white dots that add a dynamic and energetic feel, creating a vibrant visual metaphor for progress, research, and educational. Data analysis decrease illustrations Open book with colorful bar graph on top showing data analysis, statistics, and growth metrics in vibrant orange, yellow, and red. An open textbook displays a vertical bar graph composed of six brightly colored orange, yellow, and red bars arranged from highest to lowest, symbolizing data analysis, statistical growth, and performance metrics, set against a plain beige background with scattered white dots that add a dynamic and energetic feel, creating a vibrant visual metaphor for progress, research, and educational
Free with trial A businessman in a suit uses a magnifying glass to show cost reduction with graphs and financial data visuals. Data analysis decrease illustrations Businessman demonstrating cost reduction with data and graphs for financial analysis purpose image. A businessman in a suit uses a magnifying glass to show cost reduction with graphs and financial data visuals.
Free with trial A set of twelve diverse and versatile vector icons depicting various types of charts commonly used in business and data analysis. These include line graphs showing upward and fluctuating trends, bar charts illustrating data comparisons, and pie charts representing proportions. Ideal for presentations, reports, websites, and infographics related to finance, marketing, and statistics. Data analysis decrease vectors Collection of Line and Bar Charts & Pie Charts - Business Data Visualization Icons. A set of twelve diverse and versatile vector icons depicting various types of charts commonly used in business and data analysis. These include line graphs showing upward and fluctuating trends, bar charts illustrating data comparisons, and pie charts representing proportions. Ideal for presentations, reports, websites, and infographics related to finance, marketing, and statistics.
Free with trial The image shows a magnifying glass closely inspecting a section of a document that contains financial charts and bar graphs. The charts likely represent data trends, possibly related to market analysis or financial performance. The background includes additional graphs and handwritten notes, suggesting a detailed examination of financial information or research. Data analysis decrease illustrations Magnifying glass examining financial data and bar charts on documents. The image shows a magnifying glass closely inspecting a section of a document that contains financial charts and bar graphs. The charts likely represent data trends, possibly related to market analysis or financial performance. The background includes additional graphs and handwritten notes, suggesting a detailed examination of financial information or research
Free with trial The image shows two arrows, one green pointing upward labeled increase and another red pointing downward labeled decrease, commonly used to indicate trends or changes in data. Data analysis decrease illustrations Visual representation of increase and decrease indicators using arrows. The image shows two arrows, one green pointing upward labeled increase and another red pointing downward labeled decrease, commonly used to indicate trends or changes in data
Free with trial Percentage decrease image over black and white pixelated background. Analytics, statistics, finance, data, digital, abstract. Data analysis decrease illustrations Percentage decrease image over black and white pixelated background
Free with trial A vibrant infographic illustrating business growth, financial analysis, and data visualization with charts, graphs, and icons. Data analysis decrease vectors Infographic of Business Growth and Financial Analysis with Charts and Icons. A vibrant infographic illustrating business growth, financial analysis, and data visualization with charts, graphs, and icons
Free with trial The image depicts a series of vertical bars in teal color, showing a gradual decrease in height from left to right. A large red downward-pointing arrow overlays the bars, emphasizing the trend of decline in the data represented. This visual is commonly used to illustrate decreasing performance, sales, or other metrics over time. Data analysis decrease illustrations Declining bar chart with a downward arrow indicating a decrease in values. The image depicts a series of vertical bars in teal color, showing a gradual decrease in height from left to right. A large red downward-pointing arrow overlays the bars, emphasizing the trend of decline in the data represented. This visual is commonly used to illustrate decreasing performance, sales, or other metrics over time
Free with trial An overhead shot captures hands engaged in meticulous financial planning on a rustic wooden desk. Stacks of US quarters, a calculator, and a notebook filled with handwritten charts and graphs illustrate concepts of budgeting, savings, and investment. The scene suggests careful analysis of financial data, strategizing for future growth, or managing personal and business finances. Eyeglasses, a pen, and a coffee cup complete this focused work environment, ideal for themes of economy, wealth management, and financial success. Data analysis decrease illustrations Financial Planning and Savings: Hands Analyzing Data with Coins and Calculator. An overhead shot captures hands engaged in meticulous financial planning on a rustic wooden desk. Stacks of US quarters, a calculator, and a notebook filled with handwritten charts and graphs illustrate concepts of budgeting, savings, and investment. The scene suggests careful analysis of financial data, strategizing for future growth, or managing personal and business finances. Eyeglasses, a pen, and a coffee cup complete this focused work environment, ideal for themes of economy, wealth management, and financial success.
Free with trial Abstract line graph with four distinct data points connected by red line, indicating trend analysis and progress. Simple design. Data analysis decrease vectors Line graph with colored points showing data points and trend on white background. Abstract line graph with four distinct data points connected by red line, indicating trend analysis and progress. Simple design
Free with trial This abstract digital artwork features a blue and gray bar graph with data points highlighting growth trends on a dark background, ideal for business and analytics themes Generative AI. Data analysis decrease illustrations Blue and Gray Bar Graph with Data Points Representing Growth Trends and Statistical Analysis in Digital Format on Dark Background. This abstract digital artwork features a blue and gray bar graph with data points highlighting growth trends on a dark background, ideal for business and analytics themes Generative AI
Free with trial A businessman in a suit analyzes financial data on a tablet, with a glowing graph and a percentage decrease suggesting market analysis , image generative using ai tools. Data analysis decrease illustrations Businessman analyzing financial growth on tablet with percentage decrease. A businessman in a suit analyzes financial data on a tablet, with a glowing graph and a percentage decrease suggesting market analysis , image generative using ai tools
Free with trial Nine flat design icons depict various data charts and graphs in muted blue and teal tones. Data analysis decrease vectors Collection of nine flat design data charts and graphs analysis statistics. Nine flat design icons depict various data charts and graphs in muted blue and teal tones.
Free with trial A modern 3D rendering of a vertical bar graph titled COST ANALYSIS displays multiple stacked bars of varying heights representing different percentages, with the tallest green bar at the bottom and shorter blue bars ascending upward against a dark blue background featuring a subtle grid pattern, creating a professional data visualization for financial reports, business presentations, or analytical. Data analysis decrease illustrations 3D rendered bar graph chart showing cost analysis with percentage data visualization in green and blue colors on dark background. A modern 3D rendering of a vertical bar graph titled COST ANALYSIS displays multiple stacked bars of varying heights representing different percentages, with the tallest green bar at the bottom and shorter blue bars ascending upward against a dark blue background featuring a subtle grid pattern, creating a professional data visualization for financial reports, business presentations, or analytical
Free with trial The image shows a bar graph with a red line trending downward, indicating a significant decline in data points over time. The bars start tall on the left and gradually decrease in height towards the right, with the red line following the same downward trajectory, ending with a large red arrow pointing downwards. Data analysis decrease illustrations A downward trending graph illustrating a significant decline in data points. The image shows a bar graph with a red line trending downward, indicating a significant decline in data points over time. The bars start tall on the left and gradually decrease in height towards the right, with the red line following the same downward trajectory, ending with a large red arrow pointing downwards
Free with trial The image shows a framed bar chart with red and green bars. The bars represent data trends over time, with the green bars showing an increase and the red bars showing a decrease. The chart is displayed on a white background with a wooden frame. Data analysis decrease illustrations A framed bar chart with red and green bars representing data trends over time. The image shows a framed bar chart with red and green bars. The bars represent data trends over time, with the green bars showing an increase and the red bars showing a decrease. The chart is displayed on a white background with a wooden frame
Free with trial Red Bar Chart on Grunge Background Data Visualization Concept, data analysis, chart , This photo was created using generative AI. design. Data analysis decrease illustrations Red Bar Chart on Grunge Background Data Visualization Concept, data analysis, chart design. Red Bar Chart on Grunge Background Data Visualization Concept, data analysis, chart , This photo was created using generative AI. design
Free with trial The image shows a series of vertical bars in descending order of height, colored from dark blue to light purple. A bold red diagonal arrow overlays the bars, pointing downward, symbolizing a decline or reduction in values over time. This visual is often used to represent a decrease in metrics such as sales, performance, or other quantifiable data trends. Data analysis decrease illustrations Declining bar chart with downward trend arrow indicating a decrease in values. The image shows a series of vertical bars in descending order of height, colored from dark blue to light purple. A bold red diagonal arrow overlays the bars, pointing downward, symbolizing a decline or reduction in values over time. This visual is often used to represent a decrease in metrics such as sales, performance, or other quantifiable data trends
Free with trial The image shows an easel holding a white poster with a blue bar and line chart. The chart depicts a series of vertical bars that gradually decrease in height, accompanied by a line graph that rises initially and then declines. The easel is positioned on a plain, light-colored background, emphasizing the visual data presentation on the poster. Data analysis decrease illustrations Easel displaying a bar and line chart illustrating financial or data trends. The image shows an easel holding a white poster with a blue bar and line chart. The chart depicts a series of vertical bars that gradually decrease in height, accompanied by a line graph that rises initially and then declines. The easel is positioned on a plain, light-colored background, emphasizing the visual data presentation on the poster
Free with trial Detailed collection of linear icons representing various business trends, financial growth metrics, and candlestick market data. Data analysis decrease vectors Financial business graph and chart line icons for data analysis and kpi tracking. detailed collection of linear icons representing various business trends, financial growth metrics, and candlestick market data
Free with trial The image shows a bar graph with a red line trending downward, indicating a significant decline in data points over time. The bars start tall on the left and gradually decrease in height towards the right, with the red line sharply descending, emphasizing the negative trend. Data analysis decrease illustrations A downward trend graph illustrating a significant decline in data points over time. The image shows a bar graph with a red line trending downward, indicating a significant decline in data points over time. The bars start tall on the left and gradually decrease in height towards the right, with the red line sharply descending, emphasizing the negative trend
Free with trial The image depicts a bar chart with a superimposed red line showing a clear downward trend. Each bar represents a progressively smaller value, indicating a consistent decrease in data over time. The chart uses a gradient from taller to shorter bars, suggesting a significant drop in the measured quantity, which is reinforced by the downward-sloping line connecting the tops of the bars. Data analysis decrease illustrations Declining bar chart graph illustrating a downward trend in data values over time. The image depicts a bar chart with a superimposed red line showing a clear downward trend. Each bar represents a progressively smaller value, indicating a consistent decrease in data over time. The chart uses a gradient from taller to shorter bars, suggesting a significant drop in the measured quantity, which is reinforced by the downward-sloping line connecting the tops of the bars
Free with trial An up-close, brightly colored display of stock market data in red, with falling indicators. This image showcases concepts like economic downturn, financial loss, volatility, and investment risk. It could be used to illustrate articles on finance, investment, economics, market analysis, and trading s. Data analysis decrease illustrations Red Stock Market Ticker Display: Economic Downturn and Financial Investment Analysis Overview Display. An up-close, brightly colored display of stock market data in red, with falling indicators. This image showcases concepts like economic downturn, financial loss, volatility, and investment risk. It could be used to illustrate articles on finance, investment, economics, market analysis, and trading s
Free with trial The image features declining business graphs illustrated with pie charts and falling arrow indicators, representing financial analysis and reports on downward trends, decreases in performance metrics, and economic risks. It effectively visualizes key data related to investment and marketing losses. This representation has been created using AI. Data analysis decrease vectors Declining Business Graphs Falling Arrow Chart and Pie Chart for Financial Analysis and Reports. The image features declining business graphs illustrated with pie charts and falling arrow indicators, representing financial analysis and reports on downward trends, decreases in performance metrics, and economic risks. It effectively visualizes key data related to investment and marketing losses. This representation has been created using AI.
Free with trial Minimalist bar chart created with natural wooden blocks, symbolizing data, financial trends, market fluctuations, and business analysis on a white surface. Data analysis decrease illustrations Wooden blocks bar chart illustrating business data progression on a white background. Minimalist bar chart created with natural wooden blocks, symbolizing data, financial trends, market fluctuations, and business analysis on a white surface.
Free with trial A 3D bar chart and a partial pie chart illustrating data and growth, with percentage labels, on a white background. Data analysis decrease illustrations 3D Bar Chart and Pie Chart Showing Growth and Data Analysis on White Background graph statistics. A 3D bar chart and a partial pie chart illustrating data and growth, with percentage labels, on a white background
Free with trial This is an detailed collection of financial icons depicting various stock market trends, growth curves, and data analysis patterns. Data analysis decrease vectors Financial data and stock market trend line icons set showing growth and volatility curves. This is an detailed collection of financial icons depicting various stock market trends, growth curves, and data analysis patterns
Free with trial The image shows a series of red bars of varying heights, each with an arrow pointing downwards, illustrating a decline in values. The bars represent data points that decrease over time, with the arrows emphasizing the downward trend. Data analysis decrease illustrations A visual representation of fluctuating data trends with arrows indicating changes. The image shows a series of red bars of varying heights, each with an arrow pointing downwards, illustrating a decline in values. The bars represent data points that decrease over time, with the arrows emphasizing the downward trend
Free with trial Isolated showing simple line graph showing a downward trend on white background keywords: graph, chart, line, trend, data, decline, decrease. Data analysis decrease illustrations Simple line graph showing a downward trend on white background Keywords: graph, chart, line, trend, data, decline
Free with trial A set of nine minimalist vector icons depicting various types of charts and graphs including bar charts, progress bars, and trend lines for data visualization and analytics. Data analysis decrease vectors Collection of simple black glyph icons representing business charts graphs and data analysis. A set of nine minimalist vector icons depicting various types of charts and graphs including bar charts, progress bars, and trend lines for data visualization and analytics
Free with trial Flat design illustration showing colorful bar graph combined with a line chart, both displaying data trends against a simple black background. Data analysis decrease vectors Colorful Bar Graph and Line Chart on Black Background Illustrating Data Analysis and Trends. Flat design illustration showing colorful bar graph combined with a line chart, both displaying data trends against a simple black background.
Free with trial Green screen chart analysis, data visualization, metrics tracking, business growth ,Generative ai. Data analysis decrease illustrations Green screen chart analysis, datadriven insights for business growth and performance tracking. Green screen chart analysis, data visualization, metrics tracking, business growth ,Generative ai
Free with trial A collection of colorful isometric bar charts and line graphs are displayed on a white background, representing data visualization and analysis. Data analysis decrease illustrations Isometric colorful bar charts and line graphs displayed on a white background for data visualization. a collection of colorful isometric bar charts and line graphs are displayed on a white background, representing data visualization and analysis
Free with trial A high-tech visualization of financial data, showing a glowing blue bar chart and line graphs representing stock market trends, business analytics, and economic growth. Data analysis decrease illustrations Futuristic digital stock market chart with glowing blue graphs and data analysis on a dark background. A high-tech visualization of financial data, showing a. A high-tech visualization of financial data, showing a glowing blue bar chart and line graphs representing stock market trends, business analytics, and economic growth
Free with trial Close-up view of computer screen with colorful graphs, charts, representing financial, economic data visualization. Stock market analysis, business statistics investment data displayed. Data analysis decrease illustrations Close-up view of computer screen with colorful graphs, charts, representing financial, economic data visualization. Stock market
Free with trial This image shows a gradient heatmap with varying colors representing different intensities of data or values. The top section contains a solid blue band indicating high intensity or values, while the lower section displays a smooth gradient transitioning from pink and orange at the top to dark tones at the bottom. The gradient suggests a gradual decrease in intensity or value from the top to the. Data analysis decrease illustrations Gradient heatmap representing data intensity across a rectangular area. isolated on transparent background, isolated on white. This image shows a gradient heatmap with varying colors representing different intensities of data or values. The top section contains a solid blue band indicating high intensity or values, while the lower section displays a smooth gradient transitioning from pink and orange at the top to dark tones at the bottom. The gradient suggests a gradual decrease in intensity or value from the top to the
Free with trial Business analytics icon depicting price fluctuations in economic market data, financial growth concept. Data analysis decrease vectors Financial candlestick chart illustrating market trend for investment, stock trading data analysis. Isolated digital graphic. Business analytics icon depicting price fluctuations in economic market data, financial growth concept.
Free with trial Black and white line icons depicting currency devaluation, falling stocks, and market data analysis. Data analysis decrease vectors Financial downturn and market analysis icons. Black and white line icons depicting currency devaluation, falling stocks, and market data analysis
Free with trial A document with bar and line graphs is being examined with a magnifying glass. This suggests a detailed analysis of data, trends, and insights. It is isolated on white background. Data analysis decrease vectors Vector art of analyzing data with a magnifying glass on a report it shows bar graphs and a line graph indicating trends and. A document with bar and line graphs is being examined with a magnifying glass. This suggests a detailed analysis of data, trends, and insights. It is isolated on white background
Free with trial This compelling macro photography showcases a stark decline in investment fund values. The blue cubes, transitioning to red arrows pointing downward, vividly illustrate the negative trends in the stock market. This visual representation of investment data highlights the critical need for in-depth financial analysis and proactive investment strategies. The chart, created using advanced AI. Data analysis decrease illustrations Macro Financial Chart Depicts Declining Investment Funds A Visual Analysis of Market Trends and Potential Risks. This compelling macro photography showcases a stark decline in investment fund values. The blue cubes, transitioning to red arrows pointing downward, vividly illustrate the negative trends in the stock market. This visual representation of investment data highlights the critical need for in-depth financial analysis and proactive investment strategies. The chart, created using advanced AI
Free with trial This icon represents seven percent, symbolizing a discount, interest rate, or statistical value in various contexts such as finance, sales, and data analysis. Data analysis decrease vectors Vector art of seven percent icon, representing a discount, interest rate, or statistical value in finance, sales, and data. This icon represents seven percent, symbolizing a discount, interest rate, or statistical value in various contexts such as finance, sales, and data analysis
Free with trial Colorful pie chart is showing positive statistics and business growth, target and financial analysis and marketing report, data with copy space. Data analysis decrease illustrations Colorful pie chart is showing positive statistics and business growth, target and financial analysis and marketing
Free with trial This vibrant abstract graph illustrates the dynamic trends in financial markets, highlighting fluctuations in trading data and investment opportunities. Data analysis decrease illustrations Abstract financial trading graph with vibrant color scheme showcasing fluctuating market trends and data analysis visuals. This vibrant abstract graph illustrates the dynamic trends in financial markets, highlighting fluctuations in trading data and investment opportunities
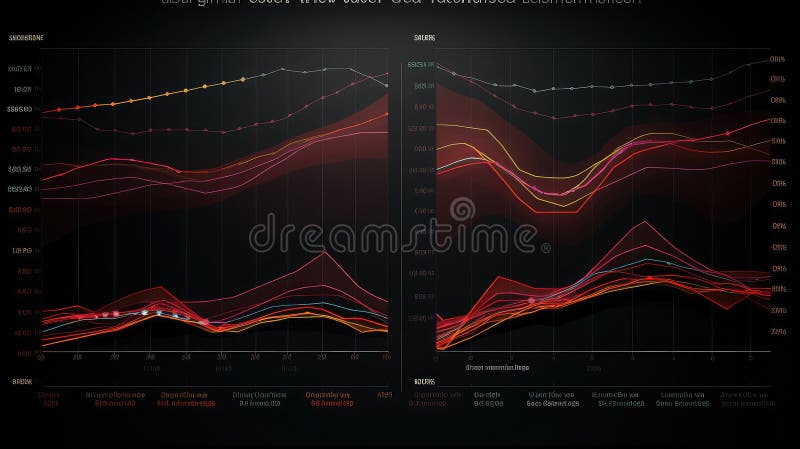
Free with trial A detailed data visualization illustrating market trends over time. The infographic combines a line chart, which shows fluctuating values and percentages, with a bar chart representing data for specific time intervals. The line chart highlights key data points, such as peaks annotated with values like '1. 24%' and '500K'. The x-axis represents a timeline from January to March, while the y-axis. Data analysis decrease illustrations A modern market trend analysis visualization combining a bar and line chart for financial data isolated on white background. A detailed data visualization illustrating market trends over time. The infographic combines a line chart, which shows fluctuating values and percentages, with a bar chart representing data for specific time intervals. The line chart highlights key data points, such as peaks annotated with values like '1.24%' and '500K'. The x-axis represents a timeline from January to March, while the y-axis
Free with trial Abstract blue 3D bar chart with glowing line graph shows market growth. Digital data visualization indicates positive trend. Financial analysis graphic, with bokeh. Data analysis decrease illustrations Abstract blue 3D bar chart with glowing line graph shows market growth. Digital data visualization indicates positive trend.
Free with trial Colorful business graph illustrating a decline in data, featuring a bold red arrow pointing downward. Ideal for enhancing presentations and finance reports with clear visual analysis. Data analysis decrease vectors Colorful business graph illustrating a decline in data, featuring a bold red arrow pointing downward. Ideal for
Free with trial This illustration features two colorful bar graphs on a white background, showcasing data comparison with distinct color palettes for engaging visual analysis and presentations. Data analysis decrease illustrations Colorful Bar Graphs on White Background Representing Data Comparison and Growth with Different Color Schemes for Visual Analysis. This illustration features two colorful bar graphs on a white background, showcasing data comparison with distinct color palettes for engaging visual analysis and presentations
Free with trial This monochromatic bar graph illustrates data trends over time, showcasing variations in performance and metrics, ideal for presentations and business reports. Data analysis decrease illustrations Black and White Bar Graph with Trend Line Showing Data Variations Over Time for Analysis and Reporting Purposes in Business. This monochromatic bar graph illustrates data trends over time, showcasing variations in performance and metrics, ideal for presentations and business reports
Free with trial This illustration features two colorful bar graphs on a white background, showcasing data comparison with distinct color palettes for engaging visual analysis and presentations. Data analysis decrease illustrations Colorful Bar Graphs on White Background Representing Data Comparison and Growth with Different Color Schemes for Visual Analysis. This illustration features two colorful bar graphs on a white background, showcasing data comparison with distinct color palettes for engaging visual analysis and presentations
Free with trial This image features a conceptual bar graph, illustrating contrasting trends of growth and decline in business performance, ideal for data analysis presentations. Data analysis decrease illustrations Growth and Decline: Conceptual Bar Graph Illustrating Positive and Negative Trends in Business Performance Data Visualization. This image features a conceptual bar graph, illustrating contrasting trends of growth and decline in business performance, ideal for data analysis presentations
Free with trial Abstract 3D bar graph representation showcasing various data trends with vibrant colors and shadows. Ideal for presentations, reports, and analytics purposes. Data analysis decrease illustrations 3D Visualization of Colorful Bar Graph Illustrating Data Trends with Shadows and Depth in a Minimalistic Style for Data Analysis. Abstract 3D bar graph representation showcasing various data trends with vibrant colors and shadows. Ideal for presentations, reports, and analytics purposes
Free with trial Businessman analyzes financial data on digital tablet. Graphs, charts display performance, cost reduction. Modern business strategy project management concepts in focus. Data analysis. Data analysis decrease illustrations Businessman analyzes financial data on digital tablet. Graphs, charts display performance, cost reduction. Modern business
Free with trial Magnifying glass focuses on downward trend in financial spreadsheet during recession. Spreadsheet data shows, significant decline. Economic downturn evident. Detailed financial analysis. Data analysis decrease illustrations Magnifying glass focuses on downward trend in financial spreadsheet during recession. Spreadsheet data shows significant decline. Magnifying glass focuses on downward trend in financial spreadsheet during recession. Spreadsheet data shows, significant decline. Economic downturn evident. Detailed financial analysis.
Free with trial A simple line chart illustrates a decreasing trend with distinct dot markers representing data points. The design emphasizes the shift in values over time and aids in visualizing performance. Data analysis decrease vectors Chart Displaying a Downward Trend in Data Analysis. A simple line chart illustrates a decreasing trend with distinct dot markers representing data points. The design emphasizes the shift in values over time and aids in visualizing performance.
Free with trial Open laptop displaying colorful bar graphs and data analysis on screen, representing growth and business analytics ,Generative AI. Data analysis decrease illustrations Open laptop displaying colorful bar graphs and data analysis on screen, representing growth and business analytics
Free with trial Decline food sales data illustration fruits vegetables, items year, trend analysis decline food sales data. Data analysis decrease illustrations Decline food sales data
Free with trial Analysis dissolving revenue chart illustration data trends, visualization metrics, performance financials analysis dissolving revenue chart. Data analysis decrease illustrations Analysis dissolving revenue chart
Free with trial Data merging loss graph illustration analysis metrics, performance validation, accuracy convergence data merging loss graph. Data analysis decrease illustrations Data merging loss graph
Free with trial A minimalist black and white icon representing a financial growth chart. It features a series of vertical bars of varying heights, symbolizing data points or periods, overlaid with a line graph connecting circular nodes. This graphic effectively conveys concepts of financial analysis, business growth, performance tracking, and data visualization. Ideal for presentations, reports, websites, and applications related to finance, economics, and business intelligence. Data analysis decrease vectors Growth Analysis Finance Chart Icon. A minimalist black and white icon representing a financial growth chart. It features a series of vertical bars of varying heights, symbolizing data points or periods, overlaid with a line graph connecting circular nodes. This graphic effectively conveys concepts of financial analysis, business growth, performance tracking, and data visualization. Ideal for presentations, reports, websites, and applications related to finance, economics, and business intelligence.
Free with trial Data merging sales graph illustration analysis trends, revenue performance, forecast comparison data merging sales graph. Data analysis decrease illustrations Data merging sales graph
Free with trial This image shows a financial report with bar graphs and numerical data, generated by AI, suggesting business performance or investment analysis. The document rests on a wooden desk, with coins blurred in the background, hinting at financial matters. Data analysis decrease illustrations Financial Report Analysis. This image shows a financial report with bar graphs and numerical data, generated by AI, suggesting business performance or investment analysis. The document rests on a wooden desk, with coins blurred in the background, hinting at financial matters.
Free with trial Comparison comparing data illustration analysis graph, traffic website, overlay divergence comparison comparing data. Data analysis decrease illustrations Comparison comparing data
Free with trial A business professional displays a digital graph of business growth trends. The graph showcases upward and downward fluctuations, representing the dynamic and complex nature of market analysis. The image is a visual representation of business growth and analysis using technology. The professional is likely studying data to make informed decisions for optimal performance and future growth. Data analysis decrease illustrations Business Growth Trend Analysis with Digital Graph. A business professional displays a digital graph of business growth trends. The graph showcases upward and downward fluctuations, representing the dynamic and complex nature of market analysis. The image is a visual representation of business growth and analysis using technology. The professional is likely studying data to make informed decisions for optimal performance and future growth
Free with trial Illustration features two stylized documents with checkmarks, symbolizing tasks or data lists. Adjacent to the papers are a green upward arrow and a red downward arrow, each marked with a percentage sign, indicating increase and decrease in values. The background is light blue, enhancing the contrast. The graphic suggests concepts of data analysis, financial trends, or statistical reports. Data analysis decrease vectors Duplicate or update thin line document. Illustration features two stylized documents with checkmarks, symbolizing tasks or data lists. Adjacent to the papers are a green upward arrow and a red downward arrow, each marked with a percentage sign, indicating increase and decrease in values. The background is light blue, enhancing the contrast. The graphic suggests concepts of data analysis, financial trends, or statistical reports.
Free with trial A visual representation of data, showcasing trends and comparisons through a green bar chart. This graphic illustrates statistical information and growth patterns effectively. Data analysis decrease illustrations Bar chart data analysis on. A visual representation of data, showcasing trends and comparisons through a green bar chart. This graphic illustrates statistical information and growth patterns effectively
Free with trial A simple line graph illustration showing fluctuations and an upward trend. The graph is drawn on a grid with a black line and red data points, indicating a period of increase, followed by a decrease, and then a final increase. This image can be used to represent business trends, financial analysis, stock market data, or any data that shows changes over time. Data analysis decrease vectors Line Graph with Fluctuations. A simple line graph illustration showing fluctuations and an upward trend. The graph is drawn on a grid with a black line and red data points, indicating a period of increase, followed by a decrease, and then a final increase. This image can be used to represent business trends, financial analysis, stock market data, or any data that shows changes over time.
Free with trial Real-Time Market Data Analysis with Candlestick Chart vector concept icon or symbol. Data analysis decrease vectors Real-Time Market Data Analysis with Candlestick Chart vector icon or symbol
Free with trial Statistics word and green decrease graph. Business concept. Economic data. Population survey. Negative report. 3d render. Data analysis decrease illustrations Statistics word and green decrease graph
Free with trial Real-Time Market Data Analysis with Candlestick Chart vector concept seamless pattern. Data analysis decrease vectors Real-Time Market Data Analysis with Candlestick Chart vector seamless pattern
Free with trial Market Data Analysis with Candlestick Chart vector concept colored icon or design element. Data analysis decrease vectors Market Data Analysis with Candlestick Chart vector colored icon or design element
Free with trial A dynamic minus sign icon focused on data analysis. Data analysis decrease vectors Dynamic Minus Sign Icon for Analysis. A dynamic minus sign icon focused on data analysis.
Free with trial Decrease glowing style sales graph split illustration profit revenue, analysis forecast, growth decline decrease glowing style sales graph split. Data analysis decrease illustrations Decrease glowing style sales graph split