Free with trial Analytical Reports Icon with Outline Style and Editable Stroke. Stack of Reports with Graphs and Charts. Data analysis decrease vectors Analytical Reports Icon with Outline Style and Editable Stroke
Free with trial An image of a graphical pie chart, it could be useful for business concepts. Data analysis decrease illustrations Pie Chart 161. An image of a graphical pie chart, it could be useful for business concepts.
Free with trial Bar graph with magnifying glass. Data analysis decrease vectors Decreasing Bar Graph. Bar graph with magnifying glass
Free with trial Bar chart or bar graph decreasing vector icon with drop down arrow. Statistical data of stock, financial in business to loss, negative, decline or crisis. Graphic for report, presentation. 48x48 px. n. Data analysis decrease vectors Bar chart or bar graph decreasing vector icon with drop down arrow. 48x48 pixel perfect and editable stroke. Bar chart or bar graph decreasing vector icon with drop down arrow. Statistical data of stock, financial in business to loss, negative, decline or crisis. Graphic for report, presentation. 48x48 px.n
Free with trial This 3D rendering showcases a downward trending red arrow overlaid on a staircase, visually representing a declining market. The bar graph at the bottom further emphasizes the decrease. This image was generated by AI, ideal for illustrating financial news or presentations. Data analysis decrease illustrations Falling Market Trend. This 3D rendering showcases a downward trending red arrow overlaid on a staircase, visually representing a declining market. The bar graph at the bottom further emphasizes the decrease. This image was generated by AI, ideal for illustrating financial news or presentations.
Free with trial Canada Stock Exchange market crisis red market price down chart fall / Stock analysis or forex charts graph Business and finance money crisis background red negative drop in sales economic fall. Data analysis decrease illustrations Canada Stock Exchange market crisis red market price down chart fall Business and finance money crisis background red negative. Canada Stock Exchange market crisis red market price down chart fall / Stock analysis or forex charts graph Business and finance money crisis background red negative drop in sales economic fall
Free with trial Red business graph with red arrow down, represents decrease in the year 2020, three-dimensional rendering, 3D illustration. Data analysis decrease illustrations Business graph down 2020. Red business graph with red arrow down, represents decrease in the year 2020, three-dimensional rendering, 3D illustration
Free with trial Red business graph with red arrow down, represents decrease in the year 2019, three-dimensional rendering, 3D illustration. Data analysis decrease illustrations Business graph down 2019. Red business graph with red arrow down, represents decrease in the year 2019, three-dimensional rendering, 3D illustration
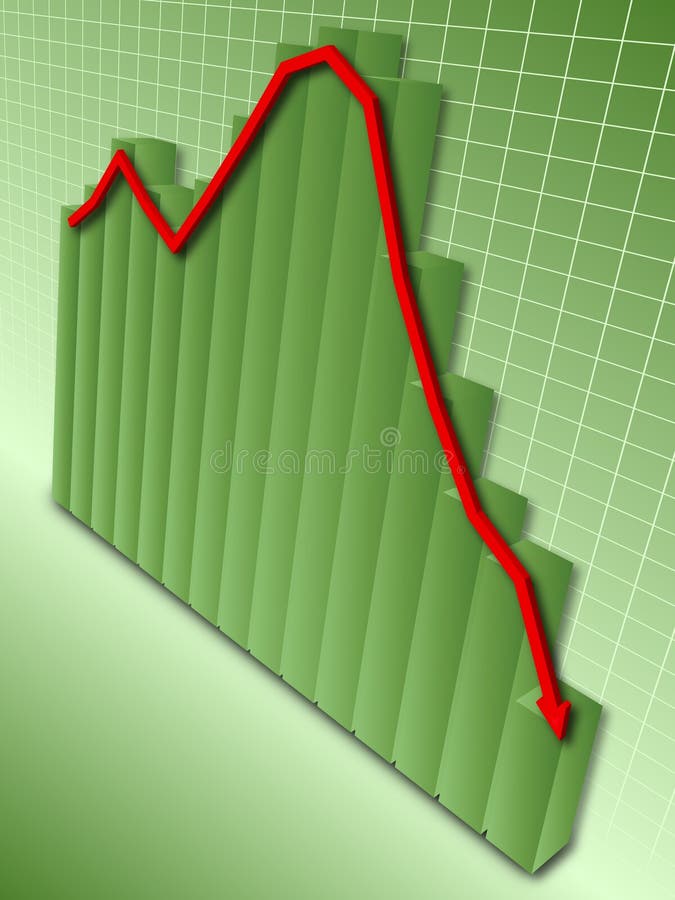
Free with trial Green bar graph with red arrow depicting downward trend of data symbolizing financial loss. Data analysis decrease vectors Financial Loss
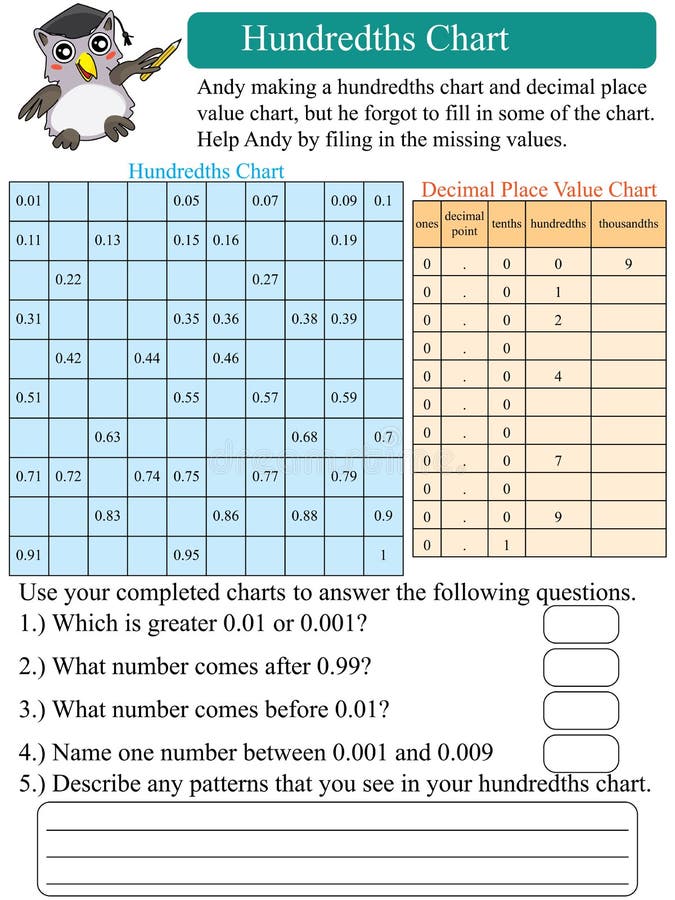
Free with trial Illustration design mathematics hundredths chart question. Data analysis decrease vectors Mathematics hundredths chart
Free with trial A conceptual image of a clipboard with a pie chart on it with a floating pen and some paper. Data analysis decrease illustrations Clipboard With Piechart 71. A conceptual image of a clipboard with a pie chart on it with a floating pen and some paper.
Free with trial Note paper with graph up and down. Data analysis decrease illustrations Graph up and down
Free with trial An Image representing global inequality. Data analysis decrease illustrations The Rich Poor Divide. An Image representing global inequality.
Free with trial An image of a graphical pie chart, it could be useful for business concepts. Data analysis decrease illustrations Pie Chart 127. An image of a graphical pie chart, it could be useful for business concepts.
Free with trial Stock market charts and graphs, Vector illustration template design. Data analysis decrease vectors Vector stock market charts and graphs. Stock market charts and graphs, Vector illustration template design
Free with trial Declining chart and sad shareholder. Data analysis decrease illustrations Shares fell. Declining chart and sad shareholder
Free with trial Abstract stats graph chart yellow background design. Data analysis decrease illustrations Graph background. Abstract stats graph chart yellow background design
Free with trial Business financial crisis concept diagram with big weight. Data analysis decrease illustrations Business financial crisis concept diagram
Free with trial Cost down business chart graph illustration design over white. Data analysis decrease illustrations Cost down business chart graph
Free with trial Modern business technology background frame illustration. Data analysis decrease illustrations Modern business technology frame illustration. Modern business technology background frame illustration
Free with trial Down trend Stock market or forex trading graph in graphic concept suitable for financial investment or Economic trends business idea and all art work design. Abstract finance background. Data analysis decrease illustrations Stock market or forex trading graph in graphic concept suitable
Free with trial Declining chart and businessman in panic. Data analysis decrease illustrations Business crash. Declining chart and businessman in panic.
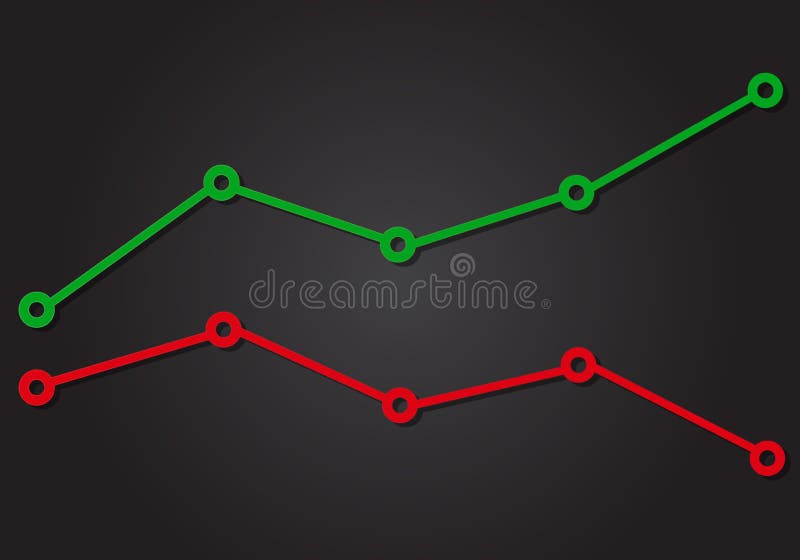
Free with trial Line chart with points. Positive and negative index. Business concept. Data analysis decrease vectors Line chart with points. Positive and negative index. Business concept
Free with trial Color Business Graph and Chart Set. Vector. Data analysis decrease vectors Color Business Graph and Chart Set
Free with trial Declining business report bar chart. Data analysis decrease illustrations Declining business report bar chart
Free with trial Declining business report bar chart. Data analysis decrease illustrations Declining business report bar chart
Free with trial An image of a clipboard with a pie chart on it with a floating pen and some paper. Data analysis decrease illustrations Clipboard With Piechart 5. An image of a clipboard with a pie chart on it with a floating pen and some paper.
Free with trial Financial crisis symbol depression business. Color vector illustration EPS10. Data analysis decrease vectors Financial crisis symbol depression business
Free with trial An image of a graphical pie chart, it could be useful for business concepts. Data analysis decrease illustrations Pie Chart 132. An image of a graphical pie chart, it could be useful for business concepts.
Free with trial Financial Stock Market Crisis During Coronavirus. Data analysis decrease illustrations Coronavirus And Financial Stock Market Crisis. Financial Stock Market Crisis During Coronavirus
Free with trial An image of a glass graphical pie chart, it could be useful for business concepts. Data analysis decrease illustrations Glass Pie Chart 1. An image of a glass graphical pie chart, it could be useful for business concepts.
Free with trial Graphs with arrows going up and down illustration on white background. Business chart drawing. Data analysis decrease illustrations Graphs with arrows going up and down freehand drawing. Graphs with arrows going up and down illustration on white background. Business chart drawing
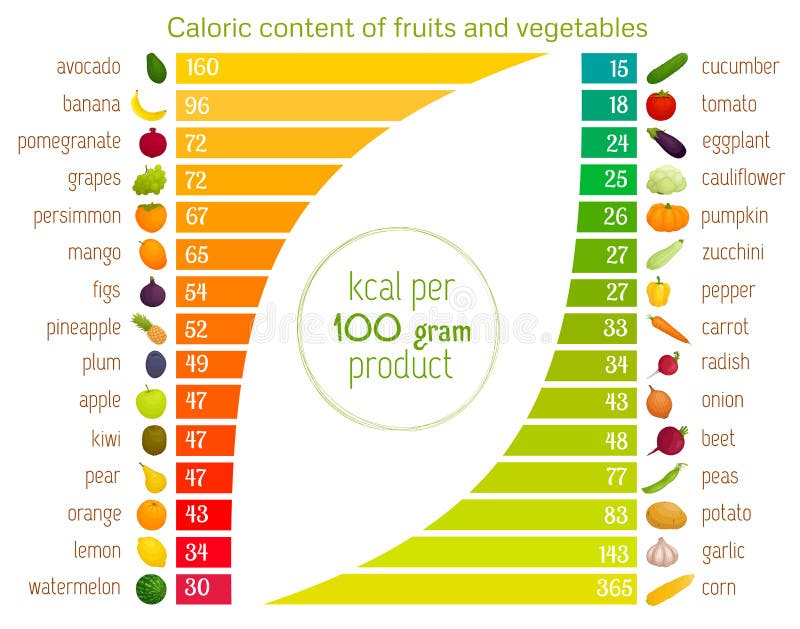
Free with trial Caloric content of vegetables and fruits in ascending order. Informative visual collage about healthy nutrition. Vector infographics and a table with values. Data analysis decrease vectors Infographics on the calorie content of food. Vector. Caloric content of vegetables and fruits in ascending order. Informative visual collage about healthy nutrition. Vector infographics and a table with values.
Free with trial An image of a graphical pie chart, it could be useful for business concepts. Data analysis decrease illustrations Pie Chart 122. An image of a graphical pie chart, it could be useful for business concepts.
Free with trial Business graph showing decreasing profit for dollar. Data analysis decrease illustrations Business graph
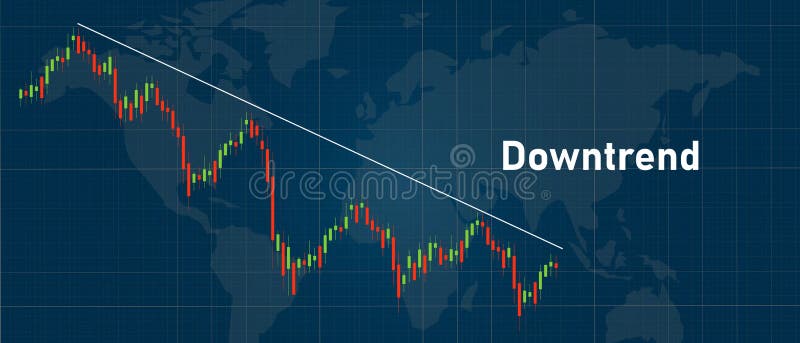
Free with trial Candlestick downtrend stock price graph vector, financial analysing tool dark background. Data analysis decrease vectors Candlestick downtrend stock price graph vector, financial analysing tool
Free with trial Illustration of people avatar business plan concept. Data analysis decrease illustrations Illustration of people avatar business plan concept
Free with trial Dollars failure 3d, problem of currency. Data analysis decrease illustrations Dollars failure 3d
Free with trial Isometric global finance crisis concept. Global economy crash. Unemployment, jobless and employee job reduction metaphor. Data analysis decrease vectors Isometric global finance crisis concept. Global economy crash. Unemployment, jobless and employee job reduction metaphor
Free with trial Falling graph cost down chart illustration design over a white background. Data analysis decrease illustrations Falling graph cost down chart illustration
Free with trial The hands are holding a tablets with stock quote charts on the screens. The fall and increase in the shares price graphs. The trader`s computers, sell, buy buttons. Business flat concept illustration. Data analysis decrease vectors The tablet computers with stock quote charts on the screens. The hands are holding a tablets with stock quote charts on the screens. The fall and increase in the shares price graphs. The trader`s computers, sell, buy buttons. Business flat concept illustration.
Free with trial Infographic template with 3 arrows pointing down. Can be used for diagram, graph, chart, report, web design. Vector illustration. Data analysis decrease vectors Infographic template with 3 arrows pointing down. Can be used for diagram, graph, chart, report, web design.
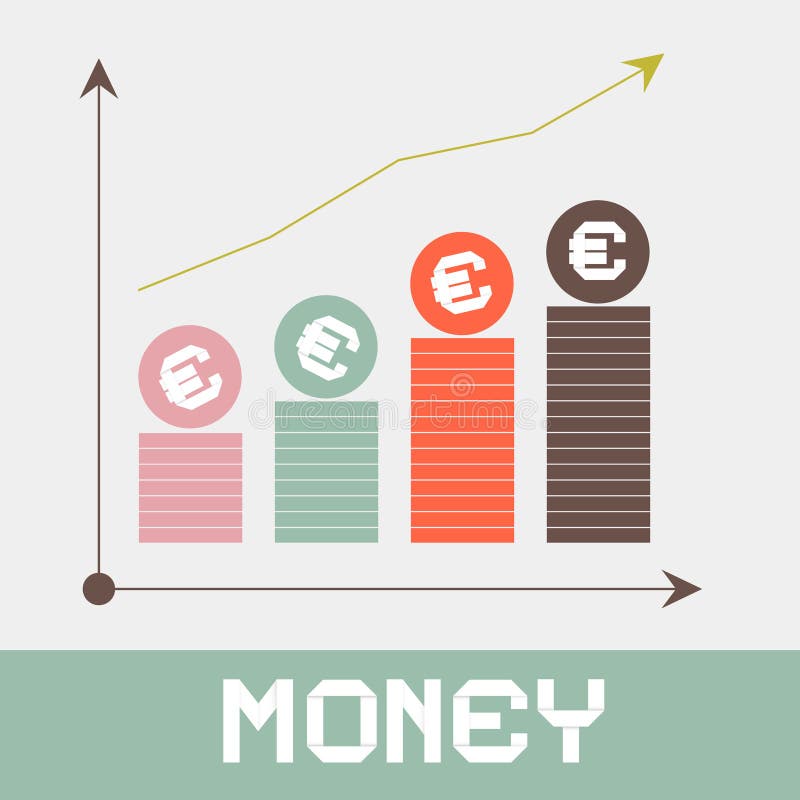
Free with trial Increase Money Graph Paper Retro Vector Illustration. Data analysis decrease vectors Increase Money Graph Paper
Free with trial Stock market quotes graph chart. Data analysis decrease illustrations Finance stock exchange background. Stock market quotes graph chart.
Free with trial Economic bubble crisis and money loss icon, downturn and bankruptcy symbol. Isolated vector linear sign of dollars and percent balloons, symbolizing unsustainable growth leading to eventual burst. Data analysis decrease vectors Economic bubble crisis and money loss line icon. Economic bubble crisis and money loss icon, downturn and bankruptcy symbol. Isolated vector linear sign of dollars and percent balloons, symbolizing unsustainable growth leading to eventual burst
Free with trial Downtrend bearish stock market candle stick chart going down loss vector. Data analysis decrease vectors Downtrend bearish stock market candle stick chart going down loss
Free with trial AI powered business optimization concept, Cost reduction and Quality control, Artificial Intelligence driven automation optimizes workflows, Improves quality, Reduces expenses in business operations. Data analysis decrease vectors AI powered business optimization concept
Free with trial A 3D red downward-trending arrow graph with the text "INTEREST RATES" above it, set against a textured beige background. Image. Data analysis decrease illustrations Interest Rates Downward Trend. A 3D red downward-trending arrow graph with the text 'INTEREST RATES' above it, set against a textured beige background. AI. A 3D red downward-trending arrow graph with the text "INTEREST RATES" above it, set against a textured beige background. Image
Free with trial Stock market quotes graph chart. Data analysis decrease illustrations Finance stock exchange background. Stock market quotes graph chart.
Free with trial Infographic with graph of production growth of sunflowers and agricultural icons. Data analysis decrease vectors Sunflower infographic. Infographic with graph of production growth of sunflowers and agricultural icons
Free with trial Dollar textured bars and falling arrow. 3D illustration. Data analysis decrease illustrations Dollar textured bars and falling arrow. 3D illustration
Free with trial 3D graph of the crisis with an arrow on a white background isolated. Data analysis decrease illustrations Graph of the crisis with an arrow
Free with trial Concept of global financial crisis. Blurry planet hologram with double exposure of falling digital graphs. 3d rendering toned image. Data analysis decrease illustrations Global financial crisis concept, stock market. Concept of global financial crisis. Blurry planet hologram with double exposure of falling digital graphs. 3d rendering toned image
Free with trial Continuous one single line drawing Business chart loss schedule icon vector illustration concept. Data analysis decrease vectors One line drawing Business chart loss concept. Continuous one single line drawing Business chart loss schedule icon vector illustration concept
Free with trial The Nikkei 225 Stock Average Index. Financial Business Economic concept. Data analysis decrease illustrations The Nikkei 225 Stock Average Index. Financial Business Economic concept.
Free with trial Financial and stock investment market concept. The bear market which price of securities are falling down. Data analysis decrease vectors Financial and stock investment market concept.
Free with trial Economics recession, crashed stock market and trading loss vector graphs with indicators turned down, decline charts, red arrows. Blurred trading screen for finance crisis and business bankruptcy. Data analysis decrease vectors Economics recession, crashed stock market graph. Economics recession, crashed stock market and trading loss vector graphs with indicators turned down, decline charts, red arrows. Blurred trading screen for finance crisis and business bankruptcy
Free with trial Diagram and graph icons with long shadow, stock vector. Data analysis decrease vectors Diagram and graph icons with long shadow
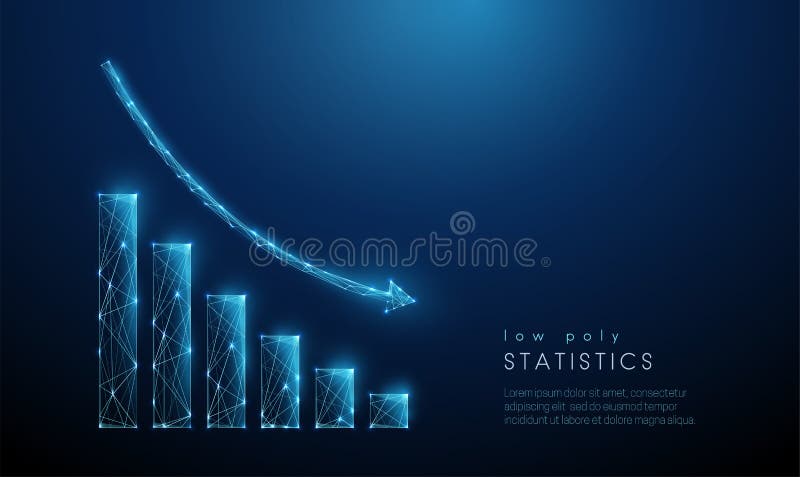
Free with trial Abstract blue gowing down chart. Low poly style design. Abstract geometric background. Wireframe light connection structure. Modern 3d graphic concept. Isolated vector illustration. Data analysis decrease vectors Low poly abstract blue gowing down chart. Abstract blue gowing down chart. Low poly style design. Abstract geometric background. Wireframe light connection structure. Modern 3d graphic concept. Isolated vector illustration.
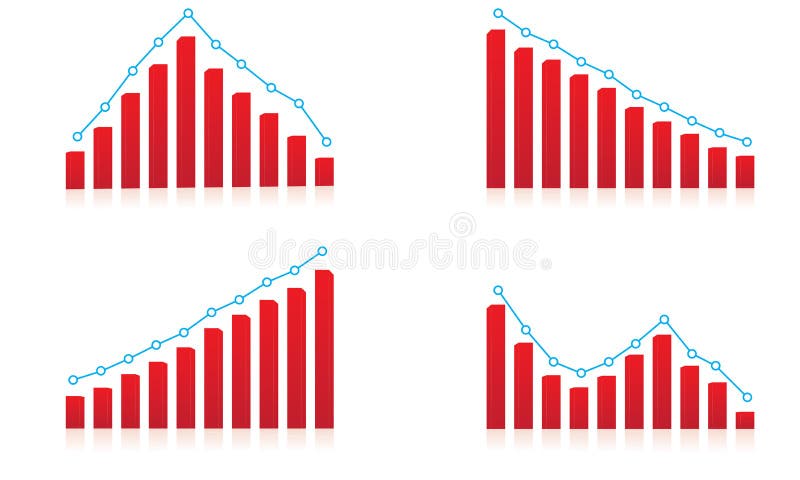
Free with trial Result Up and down financial chart Template illustration eps file. Data analysis decrease vectors Result Up and down financial chart Template
Free with trial Red Graph moving down on chart as recession or financial crisis 3d render, illustration. Data analysis decrease illustrations Red Graph moving down on chart as recession or financial crisis
Free with trial Businessman holding digital charts bars and red arrow in his hand. Data analysis decrease illustrations Businessman holding digital charts bars and red arrow
Free with trial 3D graph of the crisis with an arrow on a white background isolated. Data analysis decrease illustrations Graph of the crisis with an arrow
Free with trial Business stock exhange design, vector illustration eps 10. Data analysis decrease vectors Business stock exchange. Business stock exhange design, vector illustration eps 10.
Free with trial Colorful crisis financial bar diagram with red arrow down 3d. Data analysis decrease illustrations Colorful crisis financial bar diagram with red arrow down
Free with trial Business of the analyst with shooters and infographics. Data analysis decrease vectors Business analytics. Business of the analyst with shooters and infographics
Free with trial Education, Online statistics and Medical phone icons simple set. Report statistics, Computer and International globe signs. Human idea, Computer data. Science set. Infographic template. Vector. Data analysis decrease vectors Education, Online statistics and Medical phone icons set. Vector. Education, Online statistics and Medical phone icons simple set. Report statistics, Computer and International globe signs. Human idea, Computer data. Science set. Infographic template. Vector
Free with trial Diagram and graph icons with reflect on white background, stock vector. Data analysis decrease vectors Diagram and graph icons with reflect on white back
Free with trial Red Graph moving down on chart as recession or financial crisis 3d render, illustration. Data analysis decrease illustrations Red Graph moving down on chart as recession or financial crisis
Free with trial Statistics down icon isolated on elegant blue round button illustration. Data analysis decrease vectors Statistics down icon elegant blue round button illustration. Statistics down icon isolated on elegant blue round button illustration
Free with trial Business stock exchange design over white background, vector illustration. Data analysis decrease vectors Business stock exchange
Free with trial Business stock exchange design over white background, vector illustration. Data analysis decrease vectors Business stock exchange
Free with trial Business stock exchange design over white background, vector illustration. Data analysis decrease vectors Business stock exchange
Free with trial Negative trend. Declining graph, red arrow Vector illustration. Data analysis decrease vectors Negative trend icon. Negative trend. Declining graph, red arrow Vector illustration
Free with trial Business and financial digital graph. Stock market and trading Coronavirus or covid impact background. 3D illustration. Data analysis decrease illustrations Business and financial digital graph. Stock market and trading Coronavirus or covid impact background. 3D illustration
Free with trial Business stock exhange design, vector illustration eps 10. Data analysis decrease vectors Business stock exchange. Business stock exhange design, vector illustration eps 10.
Free with trial Money loss. Cash with down arrow stocks graph, concept of financial crisis, market fall, bankruptcy. Vector stock illustration. Data analysis decrease vectors Money loss. Cash with down arrow stocks graph, concept of financial crisis, market fall, bankruptcy. Vector stock
Free with trial Arrow graph icon, up and down. simple color vector symbol in flat style EPS10. Data analysis decrease vectors Arrow graph icon, up and down. simple color vector symbol in flat style
Free with trial Line graph, Refresh website and Analytics icons simple set. Question mark, Graph laptop and Pie chart signs. Market diagram, Update internet. Science set. Line line graph icon. Editable stroke. Vector. Data analysis decrease vectors Line graph, Refresh website and Analytics icons set. Question mark, Graph laptop and Pie chart signs. Vector. Line graph, Refresh website and Analytics icons simple set. Question mark, Graph laptop and Pie chart signs. Market diagram, Update internet. Science set. Line line graph icon. Editable stroke. Vector
Free with trial Thick textbook on economics in hardcover with bookmark inside and colorful statistical chart isolated vector illustration on white background. Data analysis decrease vectors Textbook on Economics and Bright Statistical Chart. Thick textbook on economics in hardcover with bookmark inside and colorful statistical chart isolated vector illustration on white background.