Free with trial Multiple line charts showing data trends over months on a grid background. Concept of data analysis and financial growth. 3D Rendering. Data analysis decrease illustrations Multiple line charts showing data trends over months on grid background. 3D Rendering. Multiple line charts showing data trends over months on a grid background. Concept of data analysis and financial growth. 3D Rendering
Free with trial A business professional conducts a thorough analysis of financial data using a magnifying glass, illustrating market trends with graphs and charts on a digital interface. Scalp. Data analysis decrease illustrations Business Professional Analyzing Financial Data with a Magnifying Glass, Graphs, and Visual Representation of Market. A business professional conducts a thorough. A business professional conducts a thorough analysis of financial data using a magnifying glass, illustrating market trends with graphs and charts on a digital interface. Scalp
Free with trial Set line Browser window Server Data Cloud upload Search engine Graph chart infographic and Financial growth decrease icon. Vector. Data analysis decrease vectors Set line Browser window, Server, Data, Cloud upload, Search engine, Graph chart infographic and Financial growth. Set line Browser window Server Data Cloud upload Search engine Graph chart infographic and Financial growth decrease icon. Vector.
Free with trial A modern, colorful bar chart illustrates a downward trend in financial performance or statistical data. Data analysis decrease illustrations Financial Data Analysis Graph Illustration. A modern, colorful bar chart illustrates a downward trend in financial performance or statistical data
Free with trial 3D rendering of a dynamic presentation stand showcasing financial data. Colorful, geometric shapes and infographics present market statistics, including percentages, dollar amounts, and bar graphs. Stacks of coins and various data elements are displayed on a dark blue platform with orange accents. Suitable for illustrating financial reports, market analysis, investment strategies, or business presentations. Data analysis decrease illustrations Modern Financial Data Visualization Display. 3D rendering of a dynamic presentation stand showcasing financial data. Colorful, geometric shapes and infographics present market statistics, including percentages, dollar amounts, and bar graphs. Stacks of coins and various data elements are displayed on a dark blue platform with orange accents. Suitable for illustrating financial reports, market analysis, investment strategies, or business presentations.
Free with trial This image shows a person's hand holding a smartphone displaying a stock market chart. In the background, a larger monitor mirrors similar stock data. The scene conveys trading, investment, and financial analysis through technology. The focus is on digital finance, with the smartphone symbolizing accessibility and immediacy in market engagement. The red and green lines in the graphs represent market fluctuations, essential for traders monitoring stock performance. Data analysis decrease illustrations Stock Trading on Smartphone: Analyzing Market Data. This image shows a person's hand holding a smartphone displaying a stock market chart. In the background, a larger monitor mirrors similar stock data. The scene conveys trading, investment, and financial analysis through technology. The focus is on digital finance, with the smartphone symbolizing accessibility and immediacy in market engagement. The red and green lines in the graphs represent market fluctuations, essential for traders monitoring stock performance.
Free with trial Visualization collapsing data analytics chart illustration trend analysis, dashboard metrics, anomaly decline visualization collapsing data analytics chart. Data analysis decrease illustrations Visualization collapsing data analytics chart
Free with trial A modern 3D rendered abstract illustration featuring a prominent light blue downward-pointing arrow as its base. On top, a geometric structure is composed of a rectangular block, two stylized bar chart-like elements, and a central dark grey multifaceted polyhedron. Set against a clean white background, this graphic symbolizes concepts like data analysis, business trends, financial decline, foundational structures, or urban development. Its minimalist and digital aesthetic makes it suitable for technology, finance, and corporate presentations, infographics, and web design. Data analysis decrease vectors Abstract 3D Data Structure with Downward Arrow. A modern 3D rendered abstract illustration featuring a prominent light blue downward-pointing arrow as its base. On top, a geometric structure is composed of a rectangular block, two stylized bar chart-like elements, and a central dark grey multifaceted polyhedron. Set against a clean white background, this graphic symbolizes concepts like data analysis, business trends, financial decline, foundational structures, or urban development. Its minimalist and digital aesthetic makes it suitable for technology, finance, and corporate presentations, infographics, and web design.
Free with trial A vibrant and modern illustration showcasing various data visualization elements. The image features a collection of charts, graphs, and diagrams, including line graphs, bar graphs, pie charts, and circular diagrams, all rendered in a colorful and abstract style. The design incorporates gradients and geometric shapes, suggesting growth, analysis, and business concepts. Ideal for presentations, reports, websites, and marketing materials related to finance, economics, and data analysis. Data analysis decrease illustrations Abstract Data Visualization and Business Charts. A vibrant and modern illustration showcasing various data visualization elements. The image features a collection of charts, graphs, and diagrams, including line graphs, bar graphs, pie charts, and circular diagrams, all rendered in a colorful and abstract style. The design incorporates gradients and geometric shapes, suggesting growth, analysis, and business concepts. Ideal for presentations, reports, websites, and marketing materials related to finance, economics, and data analysis.
Free with trial An outline vector icon of a bar graph showing a downward progression, indicating a decrease or negative trend. Represents statistics, data decline, losses, or reduction over categories or time. Useful for financial reporting and business analysis showing reduction, vector design Generative AI. Data analysis decrease vectors Decreasing Trend Bar Graph Statistics Vector Outline, vector design Generative AI. An outline vector icon of a bar graph showing a downward progression, indicating a decrease or negative trend. Represents statistics, data decline, losses, or reduction over categories or time. Useful for financial reporting and business analysis showing reduction, vector design Generative AI
Free with trial A clean, flat design illustration featuring a collection of icons related to social media engagement and data analysis. The set includes a pie chart, bar graphs showing upward trends, a line graph with a heart icon and an upward arrow, another line graph with data points, a speech bubble with the word 'LIKE' and abstract shapes, and a thumbs-up icon with a notification count. These graphics are ideal for representing concepts like growth, popularity, analytics, and user feedback in digital marketing, business reports, and web design. Data analysis decrease illustrations Social Media Metrics and Data Visualization Icons. A clean, flat design illustration featuring a collection of icons related to social media engagement and data analysis. The set includes a pie chart, bar graphs showing upward trends, a line graph with a heart icon and an upward arrow, another line graph with data points, a speech bubble with the word 'LIKE' and abstract shapes, and a thumbs-up icon with a notification count. These graphics are ideal for representing concepts like growth, popularity, analytics, and user feedback in digital marketing, business reports, and web design.
Free with trial A bold text vector illustration of the word MINUS, symbolizing subtraction, negative values, or a decrease. This icon is perfect for mathematical operations, financial reports, and data analysis. High-resolution and clear for precise communication in various contexts, vector design Generative AI. Data analysis decrease vectors Minus Text Symbol, Subtraction and Negative Value, vector design Generative AI. A bold text vector illustration of the word MINUS, symbolizing subtraction, negative values, or a decrease. This icon is perfect for mathematical operations, financial reports, and data analysis. High-resolution and clear for precise communication in various contexts, vector design Generative AI
Free with trial A clean and simple vector illustration of a bar chart isolated on a white background. This minimalist graphic features three vertical bars in varying shades of blue, representing data, statistics, or progress. Ideal for business reports, financial presentations, infographics, websites, and educational materials. The flat design symbolizes concepts like growth, analysis, market research, and performance comparison, offering a modern and clear way to visualize information. Ample copy space is available. Data analysis decrease illustrations Simple Blue Bar Chart Vector Icon for Business Data. A clean and simple vector illustration of a bar chart isolated on a white background. This minimalist graphic features three vertical bars in varying shades of blue, representing data, statistics, or progress. Ideal for business reports, financial presentations, infographics, websites, and educational materials. The flat design symbolizes concepts like growth, analysis, market research, and performance comparison, offering a modern and clear way to visualize information. Ample copy space is available.
Free with trial A simple outline vector icon showing two minus signs connected, symbolizing reduction, subtraction, negative value, or minimizing something. Useful in mathematical contexts, data analysis, or interface design to indicate removal or decrease. Represents a concept of lessening or reducing quantity, vector design Generative AI. Data analysis decrease vectors Connected Minus Signs Negative or Subtraction Vector Icon, vector design Generative AI. A simple outline vector icon showing two minus signs connected, symbolizing reduction, subtraction, negative value, or minimizing something. Useful in mathematical contexts, data analysis, or interface design to indicate removal or decrease. Represents a concept of lessening or reducing quantity, vector design Generative AI
Free with trial A clear vector illustration of a steep downward slope with an arrow, symbolizing decline, decrease, negative trend, or downward movement. Ideal for financial reports, data analysis, risk management, or directional signs, conveying a specific trajectory or warning, vector design Generative AI. Data analysis decrease vectors Steep Downward Slope Arrow, Decline and Direction Icon, vector design Generative AI. A clear vector illustration of a steep downward slope with an arrow, symbolizing decline, decrease, negative trend, or downward movement. Ideal for financial reports, data analysis, risk management, or directional signs, conveying a specific trajectory or warning, vector design Generative AI
Free with trial Male avatar in a circle next to a declining bar chart. Ideal for progress, profile data, analytics, user stats, report analysis, business performance, visualization. Simple flat metaphor. Data analysis decrease illustrations Profile Avatar with Bar Chart Representing Performance and Analytics Data. Male avatar in a circle next to a declining bar chart. Ideal for progress, profile data, analytics, user stats, report analysis, business performance, visualization. Simple flat metaphor
Free with trial A magnifying glass focuses on a digital graph featuring red and orange declining bars and lines, indicating stock market trends. The surrounding environment is filled with digital screens displaying similar financial data, creating an intense, analytical atmosphere. The image highlights the detailed examination of market fluctuations, with vibrant colors contrasting against a computerized background to emphasize the importance of precision in financial analysis. Data analysis decrease illustrations Stock Market Analysis: Magnifying Glass On Declining Graph. A magnifying glass focuses on a digital graph featuring red and orange declining bars and lines, indicating stock market trends. The surrounding environment is filled with digital screens displaying similar financial data, creating an intense, analytical atmosphere. The image highlights the detailed examination of market fluctuations, with vibrant colors contrasting against a computerized background to emphasize the importance of precision in financial analysis.
Free with trial Snowflake connected to decreasing bar chart indicating winter themes, seasonal decline, or data trends. Ideal for weather, climate change, business analytics, forecasting, cold storage, performance. Data analysis decrease illustrations Snowflake and Bar Chart Representing Seasonal Trends and Data Analysis Concepts. Snowflake connected to decreasing bar chart indicating winter themes, seasonal decline, or data trends. Ideal for weather, climate change, business analytics, forecasting, cold storage, performance
Free with trial Bar graph with weather icons and rising line chart on grid backdrop. Ideal for analytics, statistics, weather data, trend analysis, business forecasting, seasonal planning. A simple flat metaphor. Data analysis decrease illustrations Seasonal Data Trends Displayed on Bar Graph with Line Chart and Weather Icons. Bar graph with weather icons and rising line chart on grid backdrop. Ideal for analytics, statistics, weather data, trend analysis, business forecasting, seasonal planning. A simple flat metaphor
Free with trial A simple yet impactful vector illustration of an orange line graph showing a downward trend, representing a decrease or negative performance. This graphic is perfect for financial dashboards, stock market analysis, business presentations, or statistical reports. It clearly conveys declining metrics and critical data points, vector design Generative AI. Data analysis decrease vectors Orange Decreasing Line Graph Vector. Financial Market Drop Graphic, vector design Generative AI. A simple yet impactful vector illustration of an orange line graph showing a downward trend, representing a decrease or negative performance. This graphic is perfect for financial dashboards, stock market analysis, business presentations, or statistical reports. It clearly conveys declining metrics and critical data points, vector design Generative AI
Free with trial An abstract and futuristic digital visualization of financial data, featuring glowing blue bar charts and candlestick patterns reflecting on a sleek, dark surface. The dynamic composition, set against a deep blue background with subtle grid lines, evokes concepts of technology, business growth, and market analysis. Ideal for illustrating topics related to stock market trends, investment strategies, economic reports, big data analytics, and the future of finance in a modern, high-tech context. Data analysis decrease illustrations Futuristic Digital Finance Chart with Glowing Blue Data Bars. An abstract and futuristic digital visualization of financial data, featuring glowing blue bar charts and candlestick patterns reflecting on a sleek, dark surface. The dynamic composition, set against a deep blue background with subtle grid lines, evokes concepts of technology, business growth, and market analysis. Ideal for illustrating topics related to stock market trends, investment strategies, economic reports, big data analytics, and the future of finance in a modern, high-tech context.
Free with trial This image shows colorful financial charts and graphs, generated by AI, illustrating various data points and percentages. The overlaid arrows suggest a downward trend, potentially indicating a negative market shift or economic decline. The visual representation aids in quick understanding of compl. Data analysis decrease illustrations Financial Data Analysis. This image shows colorful financial charts and graphs, generated by AI, illustrating various data points and percentages. The overlaid arrows suggest a downward trend, potentially indicating a negative market shift or economic decline. The visual representation aids in quick understanding of compl
Free with trial This image depicts a close-up of a hand using a pen to review detailed financial data, generated by AI. The image emphasizes precision and attention to detail in financial analysis. The cool blue tones enhance the professional and analytical nature of the task. Data analysis decrease illustrations Analyzing Financial Data. This image depicts a close-up of a hand using a pen to review detailed financial data, generated by AI. The image emphasizes precision and attention to detail in financial analysis. The cool blue tones enhance the professional and analytical nature of the task.
Free with trial A set of twelve minimalist data visualization icons, featuring charts, graphs, and other data-related symbols. Perfect for presentations, reports, and dashboards, showcasing data analysis and growth trends. The clean design ensures readability and professional appeal. Data analysis decrease illustrations Data Visualization Icons
Free with trial This image features a striking red neon-style line graph on a black background, symbolizing decline, decrease, or downward trend in data visualization. Ideal for business, finance, and analytics concepts, it visually represents performance drops or negative growth in a modern, eye-catching manner. Data analysis decrease illustrations Red Neon Declining Graph Line Icon for Business Data Visualization. This image features a striking red neon-style line graph on a black background, symbolizing decline, decrease, or downward trend in data visualization. Ideal for business, finance, and analytics concepts, it visually represents performance drops or negative growth in a modern, eye-catching manner.
Free with trial Graph chart showing growth and analysis with bright background ,Generative ai. Data analysis decrease illustrations Bright background graph chart, growth analysis and data visualization. Graph chart showing growth and analysis with bright background ,Generative ai
Free with trial Calculator and downward arrow symbolizing concepts of calculation, cost reduction, analysis, or optimization. Ideal for finance, budgeting, accounting, mathematics, data evaluation profit analysis. Data analysis decrease vectors Calculator with Downward Arrow Representing Calculation, Reduction, or Analysis Concept. Calculator and downward arrow symbolizing concepts of calculation, cost reduction, analysis, or optimization. Ideal for finance, budgeting, accounting, mathematics, data evaluation profit analysis
Free with trial A close-up shot of a finger interacting with a colorful digital stock market graph. This image depicts modern finance technology and data analysis, capturing market trends. Data analysis decrease illustrations Finger Touching Digital Stock Market Graph with Colorful Data Display. A close-up shot of a finger interacting with a colorful digital stock market graph. This image depicts modern finance technology and data analysis, capturing market trends
Free with trial This image showcases a futuristic holographic display, generated by AI, depicting a declining graph. The sleek, modern design highlights technological advancements in data presentation and analysis. The displayed data is likely financial or scientific, emphasizing the potential of AI in various fi. Data analysis decrease illustrations AI-Generated Data Visualization. This image showcases a futuristic holographic display, generated by AI, depicting a declining graph. The sleek, modern design highlights technological advancements in data presentation and analysis. The displayed data is likely financial or scientific, emphasizing the potential of AI in various fi
Free with trial A computer screen displays a red data visualization, generated by AI, resembling a declining graph. The image is set against a minimalist, clean background, suggesting a modern office or workspace. The overall aesthetic conveys a sense of technological advancement and data analysis. Data analysis decrease illustrations AI-Generated Data Visualization. A computer screen displays a red data visualization, generated by AI, resembling a declining graph. The image is set against a minimalist, clean background, suggesting a modern office or workspace. The overall aesthetic conveys a sense of technological advancement and data analysis.
Free with trial A close-up view of a financial bar and line graph with a pen resting on it, indicating analysis and financial data. Data analysis decrease illustrations Close-up of a financial graph with bars and line chart and a pen business data. A close-up view of a financial bar and line graph with a pen resting on it, indicating analysis and financial data
Free with trial The image depicts an abstract and colorful representation of financial data and market trends. It uses vivid colors and shapes. Data analysis decrease illustrations An abstract visual representation of fluctuating financial data analysis. The image depicts an abstract and colorful representation of financial data and market trends. It uses vivid colors and shapes
Free with trial Incorporating advanced technology to visually illustrate stock market patterns and conduct data analysis. Data analysis decrease illustrations Take advantage of cuttingedge technology trends for advanced analysis of the market. Incorporating advanced technology to visually illustrate stock market patterns and conduct data analysis
Free with trial Up and down arrows with digital dashboard and analytics graph. Ideal for workflow, analysis, progress monitoring, performance, business strategy, reporting, simple flat metaphor. Data analysis decrease vectors Data Analysis with Interactive Dashboard, Graphs, and Performance Trends in Business Workflow. Up and down arrows with digital dashboard and analytics graph. Ideal for workflow, analysis, progress monitoring, performance, business strategy, reporting, simple flat metaphor
Free with trial Open book beside sad face, declining graph, and padlock icon with passwords. Ideal for data security, education, technology risks, privacy, business analysis learning concern metaphor. Simple flat. Data analysis decrease vectors Open Book, Declining Graph, Sad Face, and Cybersecurity Elements Highlight Data Privacy Issues. Open book beside sad face, declining graph, and padlock icon with passwords. Ideal for data security, education, technology risks, privacy, business analysis learning concern metaphor. Simple flat
Free with trial This 3D rendering showcases a vibrant bar graph and pie chart, ideal for visualizing business growth, financial reports, and data analysis. The colorful design makes it visually engaging and easy to understand. Data analysis decrease illustrations Colorful 3D Bar and Pie Chart Illustrating Business Growth and Financial Data. This 3D rendering showcases a vibrant bar graph and pie chart, ideal for visualizing business growth, financial reports, and data analysis. The colorful design makes it visually engaging and easy to understand.
Free with trial Modern rendered line graph with yellow marker points rising and falling vertically, forming a white trend line that fluctuates across the screen. The graph represents business data such as growth, decrease, profit, and market performance. Set against a blurred office background, the image has a clean, digital aesthetic ideal for financial presentations, company reports, startup pitches, and data analysis. This visual is suitable for showcasing trading performance, corporate strategy, and economic trends. Data analysis decrease illustrations Business Trend Line Graph Showing Growth and Market Fluctuations. Modern rendered line graph with yellow marker points rising and falling vertically, forming a white trend line that fluctuates across the screen. The graph represents business data such as growth, decrease, profit, and market performance. Set against a blurred office background, the image has a clean, digital aesthetic ideal for financial presentations, company reports, startup pitches, and data analysis. This visual is suitable for showcasing trading performance, corporate strategy, and economic trends.
Free with trial Vector icons showing business growth and decline trends with arrows and magnifying glass for detailed analysis, representing financial and market data in a clear style. Professional and informative. Generative AI. Data analysis decrease vectors Business growth and decline infographic icons with arrows and magnifying glass for analysis. Vector icons showing business growth and decline trends with arrows and magnifying glass for detailed analysis, representing financial and market data in a clear style. Professional and informative. Generative AI
Free with trial Stock market chart displaying investment trends with red and blue candlesticks on a dark background. The chart features a timeline labeled by months at the top and numbers at the bottom, illustrating dynamic financial data. Candlesticks show market fluctuations, with red indicating a decrease and blue an increase in value. A faint blue line overlays the candles, representing the moving average. The scene is likely within a financial or trading setting, emphasizing the analysis of market activity. Data analysis decrease illustrations Dynamic stock market chart with vibrant red and blue candles showing investment trends and financial data. Stock market chart displaying investment trends with red and blue candlesticks on a dark background. The chart features a timeline labeled by months at the top and numbers at the bottom, illustrating dynamic financial data. Candlesticks show market fluctuations, with red indicating a decrease and blue an increase in value. A faint blue line overlays the candles, representing the moving average. The scene is likely within a financial or trading setting, emphasizing the analysis of market activity.
Free with trial An abstract digital rendering of a financial market chart with a prominent red line indicating fluctuations in a stock market or trading scenario, set against a background of data streams and numerical information. It can be used for visualizing economic trends or for representing financial analytics. Data analysis decrease illustrations Abstract financial chart depicting market trends and data analysis interface. An abstract digital rendering of a financial market chart with a prominent red line indicating fluctuations in a stock market or trading scenario, set against a background of data streams and numerical information. It can be used for visualizing economic trends or for representing financial analytics
Free with trial CO2 inside cloud shape with blue downward arrows indicating reduction, next to bar chart and small cloud. Ideal for sustainability, environment, data, carbon reduction, climate change, eco-friendly. Data analysis decrease vectors Reducing Carbon Emissions with Data Analysis Highlighted by Cloud Imagery and Downward Arrows. CO2 inside cloud shape with blue downward arrows indicating reduction, next to bar chart and small cloud. Ideal for sustainability, environment, data, carbon reduction, climate change, eco-friendly
Free with trial A striking red downward arrow breaks through charts and data, symbolizing a sharp decrease in market values or performance metrics during a financial analysis session. Data analysis decrease illustrations Red downward arrow indicates a sudden decline in market performance and trends. A striking red downward arrow breaks through charts and data, symbolizing a sharp decrease in market values or performance metrics during a financial analysis session.
Free with trial Person displays wooden block featuring a chart, emphasizing data visualization ,Generative ai. Data analysis decrease illustrations Wooden block chart display, data visualization for business analysis and strategic planning. Person displays wooden block featuring a chart, emphasizing data visualization ,Generative ai
Free with trial Chart with a downward trend line and data points, a sad face emotion, and a pointing hand. Ideal for performance analysis, failure, problem-solving, disappointment, caution, decision-making simple. Data analysis decrease vectors Hand pointing at declining data chart with a sad face icon highlighting negative performance trend. Chart with a downward trend line and data points, a sad face emotion, and a pointing hand. Ideal for performance analysis, failure, problem-solving, disappointment, caution, decision-making simple
Free with trial A comprehensive set of black and white icons for graphs and charts, illustrating various data visualization types and business-related concepts for digital and print media. Data analysis decrease vectors Diverse collection of graph and chart icons representing data analysis and business growth. A comprehensive set of black and white icons for graphs and charts, illustrating various data visualization types and business-related concepts for digital and print media
Free with trial Stock market chart featuring a red downtrend line against a black background, fluctuations in financial data. perfect for illustrating concepts in finance, investment analysis, and economic downturns. Generative AI. Data analysis decrease illustrations Dynamic Stock Market Analysis with Red Downtrend Line on Black Background Generative AI. Stock market chart featuring a red downtrend line against a black background, fluctuations in financial data. perfect for illustrating concepts in finance, investment analysis, and economic downturns. Generative AI
Free with trial A 3D illustration depicts financial data analysis. On the left, a purple rectangular panel shows a red downward-trending arrow and a small pie chart with red, yellow, and blue segments. Below it, another purple panel displays a candlestick chart with red and blue bars. To the right, an orange magnifying glass with a turquoise lens hovers, suggesting investigation. The entire composition is set. Data analysis decrease illustrations 3D Render of Financial Data Visualization with Downward Trend Graph and Magnifying Glass. A 3D illustration depicts financial data analysis. On the left, a purple rectangular panel shows a red downward-trending arrow and a small pie chart with red, yellow, and blue segments. Below it, another purple panel displays a candlestick chart with red and blue bars. To the right, an orange magnifying glass with a turquoise lens hovers, suggesting investigation. The entire composition is set
Free with trial AI-powered trend prediction graph showing CSRpoepiojican metrics over time. Data visualization of future trends. Data analysis decrease illustrations AI Trend Prediction Graph Visualization: Data Analysis of CSRpoepiojican Metrics Over Time. AI-powered trend prediction graph showing CSRpoepiojican metrics over time. Data visualization of future trends
Free with trial A financial chart displaying market analysis and business growth with increasing and decreasing trends. Data analysis decrease illustrations Financial chart showing growth and market analysis data isolated on transparent background. A financial chart displaying market analysis and business growth with increasing and decreasing trends.
Free with trial 3D Colorful Charts Magnifier Analysis, Data Visualization, Market Research ,chart,magnifying glass , This photo was created using generative AI. Data analysis decrease illustrations 3D Colorful Charts Magnifier Analysis, Data Visualization, Market Research ,chart,magnifying glass
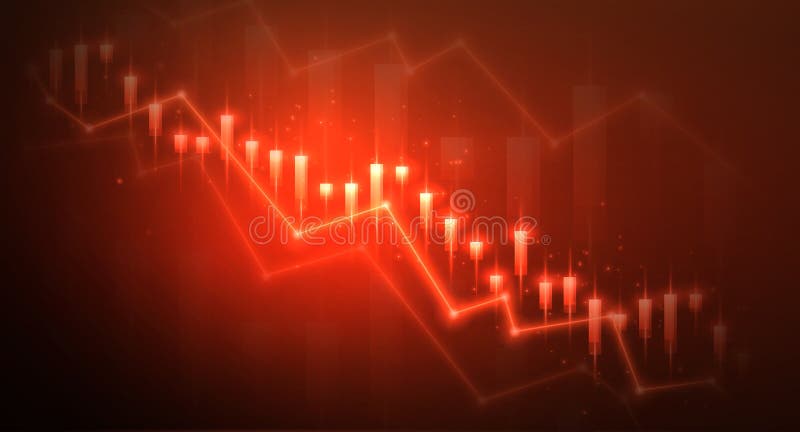
Free with trial Illuminated red financial chart depicting vibrant stock market trends, showcasing upward and downward movements. ideal for financial reports, analysis, and investment presentations in the stock market domain. Generative AI. Data analysis decrease illustrations Dynamic Red Financial Data Chart with Glowing Lights for Stock Market Analysis Generative AI. Illuminated red financial chart depicting vibrant stock market trends, showcasing upward and downward movements. ideal for financial reports, analysis, and investment presentations in the stock market domain. Generative AI
Free with trial Business chart icon set with graph, statistic, line and bar diagram for finance or analysis. Pie graphics with horizontal and donut layout for data growth. Vector report for trend or economy by pictogram scheme. Data analysis decrease vectors Business chart icon set with graph, statistic, line and bar diagram for finance or analysis. Pie graphics with
Free with trial A 3D bar chart illustrating a declining trend, perfect for business, finance, and data visualization presentations. Data analysis decrease illustrations Colorful 3D bar graph showing a downward trend in business growth and financial data analysis. A 3D bar chart illustrating a declining trend, perfect for business, finance, and data visualization presentations
Free with trial A digital globe displays import tariffs data points with percentage decreases in red and blue against a blurred cityscape at night. The globe is rendered in a futuristic style with glowing lines. Data analysis decrease illustrations Global Import Tariffs Digital Globe Night Cityscape Data Points Percentage Decrease Red Blue image. A digital globe displays import tariffs data points with percentage decreases in red and blue against a blurred cityscape at night. The globe is rendered in a futuristic style with glowing lines
Free with trial Magnifying glass over bar graph, symbolizes research, analysis, insights, growth, and strategy. Can be used for display or montage your products. Empty Space for display your products, copy space ,banner, advertising. Generative AI. Data analysis decrease illustrations Data Analysis and Market Research Magnifying glass over bar graph symbolizes research analysis insights growth and strategy. Magnifying glass over bar graph, symbolizes research, analysis, insights, growth, and strategy. Can be used for display or montage your products. Empty Space for display your products, copy space ,banner, advertising. Generative AI
Free with trial Monochrome chart representing big data analysis with peaks and valleys, stock market theme for investment strategy and economic forecast using modern digital infographic. Data analysis decrease illustrations Abstract 3d graph with data blocks on white grid background, business analytics concept for financial report and corporate. Monochrome chart representing big data analysis with peaks and valleys, stock market theme for investment strategy and economic forecast using modern digital infographic
Free with trial Vibrant neon stock market graph showing financial data trends and analysis. Perfect for business, finance, and investment themes. Generative AI Illustration. Data analysis decrease illustrations Vibrant Neon Stock Market Graph Showing Financial Data Trends and Analysis. Generative AI Illustration. Vibrant neon stock market graph showing financial data trends and analysis. Perfect for business, finance, and investment themes. Generative AI Illustration
Free with trial The image depicts a business professional in a suit interacting with a transparent digital chart displaying a declining trend in business performance. The visualization includes green bar charts and a line graph, complemented by a prominent downward arrow and percentage symbol indicating a decrease. This modern digital interface symbolizes data-driven decision-making, financial analysis, and real-time monitoring of business metrics for strategic planning. Data analysis decrease illustrations Business Performance Decline Visualization with Interactive Data Analytics and Percentage Drop Indicator. The image depicts a business professional in a suit interacting with a transparent digital chart displaying a declining trend in business performance. The visualization includes green bar charts and a line graph, complemented by a prominent downward arrow and percentage symbol indicating a decrease. This modern digital interface symbolizes data-driven decision-making, financial analysis, and real-time monitoring of business metrics for strategic planning.
Free with trial Bar Chart Growth And Decline Line And Solid Icon Set. Financial Performance, Economic Trends, Business Analysis Symbol Collection. Data Visualization And Market Trends. Isolated Vector Illustration. Data analysis decrease vectors Bar Chart Growth And Decline Line And Solid Icon Set. Financial Performance, Economic Trends, Business Analysis Symbol
Free with trial Vibrant bar chart visualization with dark background displaying data trends ,Generative ai. Data analysis decrease illustrations Colorful bar chart on dark background, data visualization for business performance analysis and trend insights. Vibrant bar chart visualization with dark background displaying data trends ,Generative ai
Free with trial A futuristic robotic hand reaches towards interactive financial charts, showcasing cutting-edge technology in data analysis and stock market trends with vivid color accents. Scalp. Data analysis decrease illustrations Advanced robotic hand interacting with dynamic financial charts and graphs, artificial intelligence analysis, stock. A futuristic robotic hand reaches towards interactive financial charts, showcasing cutting-edge technology in data analysis and stock market trends with vivid color accents. Scalp
Free with trial This infographic illustrates a crucial aspect of data analysis: recognizing and interpreting downward trends. The chart clearly displays a decreasing arrow, highlighting a negative slope and a reduction in value over time. Understanding these downward trends is critical in various fields, from finance and business to investment and market analysis. The visual representation aids in quickly. Data analysis decrease illustrations Analyzing Downward Trends in Data A Comprehensive Guide to Understanding Decreasing Charts and Graphs in Business. This infographic illustrates a crucial aspect of data analysis: recognizing and interpreting downward trends. The chart clearly displays a decreasing arrow, highlighting a negative slope and a reduction in value over time. Understanding these downward trends is critical in various fields, from finance and business to investment and market analysis. The visual representation aids in quickly
Free with trial Abstract image of stock market data visualization with glowing financial graph and chart on a digital screen for investment and analysis (AI gen. ). Data analysis decrease illustrations Abstract image of stock market data visualization with glowing financial graph and chart on a digital screen for investment and
Free with trial Real estate market analysis. Graphical representation of property value trends, growth patterns. Small house model with increasing bar chart in front of financial data diagram. Data analysis decrease illustrations Real estate market analysis. Graphical representation of property value trends, growth patterns. Small house model with
Free with trial A vibrant infographic visualizes global consumption trends using circular graphs and colorful gradients This modern data visualization effectively presents worldwide consumption patterns, highlighting key insights for business analysis, market research, and economic reporting Ideal for presentations and publications, its design ensures easy data comprehension AI Generative. Data analysis decrease illustrations Abstract Infographic Global Consumption Trends Visualization with Circular Graphs and Colorful Gradients Modern Data Visualization. A vibrant infographic visualizes global consumption trends using circular graphs and colorful gradients This modern data visualization effectively presents worldwide consumption patterns, highlighting key insights for business analysis, market research, and economic reporting Ideal for presentations and publications, its design ensures easy data comprehension AI Generative
Free with trial A digital hand displays an illuminated financial growth graph with various statistics against a dark city backdrop, emphasizing technology in data analysis and investment trends. Scalp. Data analysis decrease illustrations Digital hand presenting glowing financial growth graph with statistics and global connectivity showcasing data analytics. A digital hand displays an illuminated financial growth graph with various statistics against a dark city backdrop, emphasizing technology in data analysis and investment trends. Scalp
Free with trial Digital tablet displaying real-time gold price chart with line graphs, market indicators. Investment analysis, financial market data, trading concept. Tablet is on gold bars financial. Data analysis decrease illustrations Digital tablet displaying real-time gold price chart with line graphs, market indicators. Investment analysis, financial market
Free with trial Person interacts with digital globe displaying eco data. Person examines sustainable development strategy on tablet. Financial reports charts overlay globe. Data analysis for eco. Data analysis decrease illustrations Person interacts with digital globe displaying eco data. Person examines sustainable development strategy on tablet. Financial
Free with trial Close-up shot of stock market chart with upward and downward trends. Red and blue lines over keyboard show dynamic financial data on screen. Economic analysis forecasting. Data analysis decrease illustrations Close-up shot of stock market chart with upward and downward trends. Red and blue lines over keyboard show dynamic financial data
Free with trial This bar graph visually represents a declining trend, effectively conveying data reduction and downward progression for analytical purposes and interpretation. Data analysis decrease vectors Vector art of declining bar graph showing a downward trend in data representation and visualization for statistical analysis. This bar graph visually represents a declining trend, effectively conveying data reduction and downward progression for analytical purposes and interpretation
Free with trial Business strategy with digital tech tools. Hands working on tablet analyzing data, graphs for cost management. Planning effective project management data analysis. Improving business. Data analysis decrease illustrations Business strategy with digital tech tools. Hands working on tablet analyzing data, graphs for cost management. Planning effective
Free with trial Digital screen displaying stock market trends analysis with red data points representing a decline, visualized through charts and candlestick diagrams. Data analysis decrease illustrations Financial data visualization of stock market trends showing declining statistics and analytical software for trading platform. Digital screen displaying stock market trends analysis with red data points representing a decline, visualized through charts and candlestick diagrams
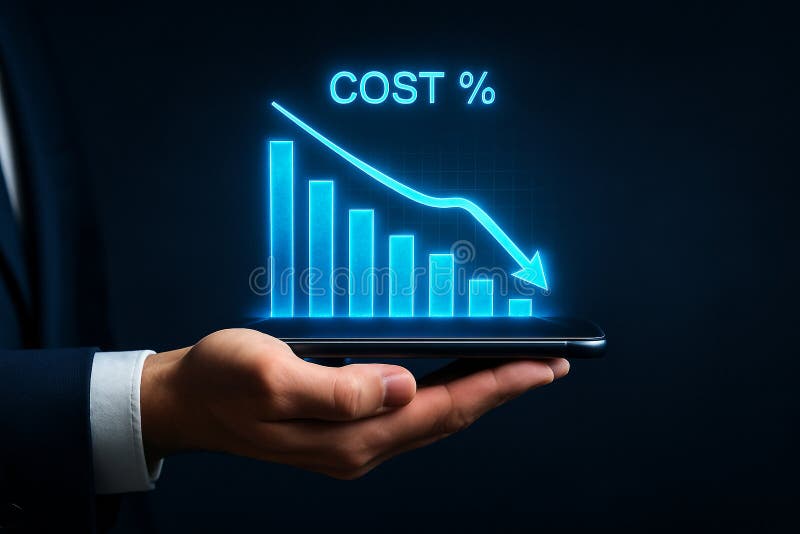
Free with trial Cost reduction chart displayed on a mobile phone held by a person in a suit shows a downward trend representing financial analysis business strategy and investment planning for economic forecasting d. Data analysis decrease illustrations Cost reduction chart financial analysis business strategy investment planning market trend economic forecast data. Cost reduction chart displayed on a mobile phone held by a person in a suit shows a downward trend representing financial analysis business strategy and investment planning for economic forecasting d
Free with trial Cost reduction chart displayed on a mobile device held by a hand shows a declining trend representing financial analysis business strategy and investment planning indicating potential market downturn. Data analysis decrease illustrations Cost reduction chart financial analysis business strategy investment planning market trend economic forecast data. Cost reduction chart displayed on a mobile device held by a hand shows a declining trend representing financial analysis business strategy and investment planning indicating potential market downturn
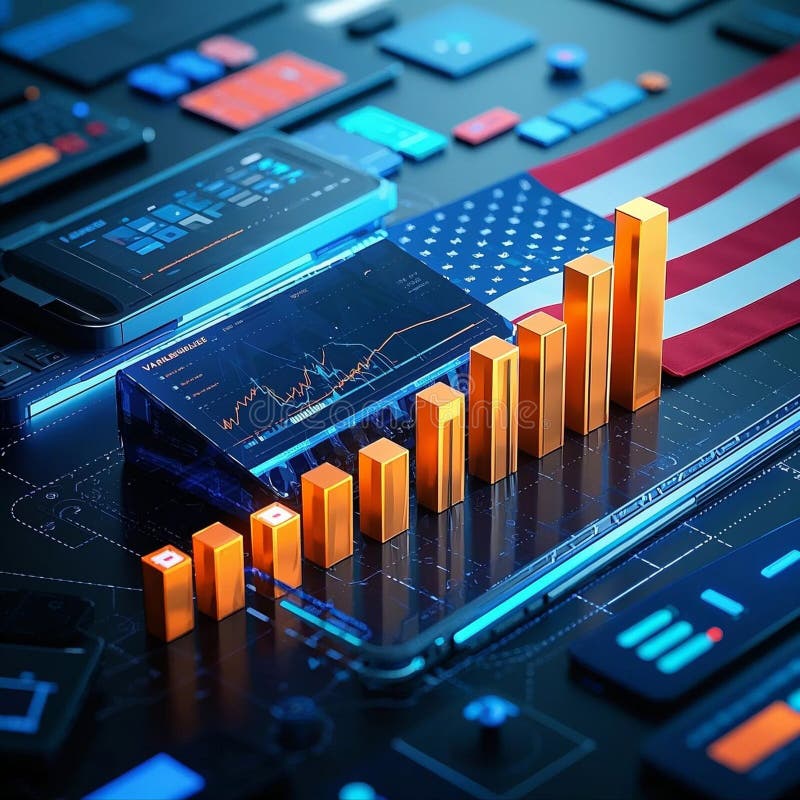
Free with trial Data charts shown on mobile devices displayed with a bar graph represent growth and financial analysis on a tech interface Perfect for illustrating investment or business trends. Data analysis decrease illustrations Analyzing Stock Market Data with Mobile Tech and Bar Graph. Data charts shown on mobile devices displayed with a bar graph represent growth and financial analysis on a tech interface Perfect for illustrating investment or business trends
Free with trial A financial markets chart features the German flag overlaid with economic data, illustrating trading trends. Ideal for reports, business analysis, and financial news, the image depicts potential market decline, investment, or. Data analysis decrease illustrations Financial markets chart showing german flag depicting economic data and trading trends. A financial markets chart features the German flag overlaid with economic data, illustrating trading trends. Ideal for reports, business analysis, and financial news, the image depicts potential market decline, investment, or
Free with trial Graph with financial data, line charts, and growth arrows on a grid background, indicating future trends for 2024 and 2025. 3D Rendering. Data analysis decrease illustrations Financial Data Analysis with Growth Arrows and Global Map. 3D Rendering. Graph with financial data, line charts, and growth arrows on a grid background, indicating future trends for 2024 and 2025. 3D Rendering
Free with trial Stock and economic crisis graph background. Trade exchange, financial decrease, bed business strategy, digital asset, loss investment fund, online broker, stock collapse and crisis concept. Data analysis decrease vectors Stock and economic crisis graph background. Trade exchange, financial decrease
Free with trial Stock and economic crisis graph background. Trade exchange, financial decrease, bed business strategy, digital asset, loss investment fund, online broker, stock collapse and crisis concept. Data analysis decrease illustrations Stock and economic crisis graph background. Trade exchange, financial decrease
Free with trial 3D stock chart. Invest trade market. Forex candlestick graph of economy data exchange. Digital business technology. Investment infographic render arrow buttons. Profit rate motion. Vector background. Data analysis decrease vectors 3D stock chart. Invest trade market. Forex candlestick graph of economy data exchange. Business technology. Investment infographic. 3D stock chart. Invest trade market. Forex candlestick graph of economy data exchange. Digital business technology. Investment infographic render arrow buttons. Profit rate motion. Vector background