Free with trial Declining bar chart with bold red fake label above a minimal cloud. Ideal for misinformation, fraud, analysis, skepticism, distrust, validation, critical thinking. Simple flat metaphor. Data analysis decrease vectors Data Misrepresentation Concept with Declining Graph and Fake Label in Simple Style. Declining bar chart with bold red fake label above a minimal cloud. Ideal for misinformation, fraud, analysis, skepticism, distrust, validation, critical thinking. Simple flat metaphor
Free with trial Hand drawn bar chart sketch with ascending and descending data patterns. Data analysis decrease vectors Hand drawn bar chart sketch with ascending and descending data patterns, AI Generative. Hand drawn bar chart sketch with ascending and descending data patterns.
Free with trial A striking red arrow plunges downwards, symbolizing a significant drop in data trends. This representation highlights a negative change in performance or market activity. Data analysis decrease illustrations A red downward arrow indicating a sharp decline in numbers during market analysis. A striking red arrow plunges downwards, symbolizing a significant drop in data trends. This representation highlights a negative change in performance or market activity.
Free with trial Creative security padlock on red forex chart background. Financial recess and data protection concept. 3D Rendering. Data analysis decrease illustrations Creative security padlock on forex chart background. Financial recess and data protection concept. 3D Rendering
Free with trial This image features a vibrant 3D representation of a bar chart, composed of translucent, glowing blocks in shades of pink, yellow, and cyan. The bars are arranged in varying heights, suggesting growth or data representation. The background is a dark green digital grid with subtle light effects and floating particles, creating a futuristic and technological atmosphere. This visual is ideal for concepts related to finance, data analysis, technology, growth, and digital trends. Data analysis decrease illustrations Abstract 3D Bar Chart with Neon Glow on Green Digital Background. This image features a vibrant 3D representation of a bar chart, composed of translucent, glowing blocks in shades of pink, yellow, and cyan. The bars are arranged in varying heights, suggesting growth or data representation. The background is a dark green digital grid with subtle light effects and floating particles, creating a futuristic and technological atmosphere. This visual is ideal for concepts related to finance, data analysis, technology, growth, and digital trends.
Free with trial This cheerful 3D rendered illustration depicts a friendly cartoon businessman confidently presenting positive business growth charts and data, showcasing key performance indicators and financial success. The image is ideal for business, finance, and marketing concepts. Data analysis decrease illustrations Charming 3D Cartoon Businessman Presenting Growth Charts and Data. This cheerful 3D rendered illustration depicts a friendly cartoon businessman confidently presenting positive business growth charts and data, showcasing key performance indicators and financial success. The image is ideal for business, finance, and marketing concepts.
Free with trial Red Arrow Points Downward Showing Decrease, Decline, or Loss Concept. Data analysis decrease illustrations Red Arrow Points Downward Showing Decrease, Decline, or Loss Concept
Free with trial Steep downward trending line graph red arrow decrease devaluation Can be customized to fit various themes and styles. Data analysis decrease illustrations Steep downward trending line graph, red arrow , decrease, devaluation. Steep downward trending line graph red arrow decrease devaluation Can be customized to fit various themes and styles
Free with trial Bar graph depicts a downward trend in data, using various colors to illustrate the decline effectively. Data analysis decrease illustrations Graph illustrating data trends showing a steady decline over time. Bar graph depicts a downward trend in data, using various colors to illustrate the decline effectively.
Free with trial Hourglass with sand flowing, a lightning bolt, and bar chart aligned as decreasing bars. Ideal for time management, efficiency, productivity, energy flow, deadlines, data analysis simple flat. Data analysis decrease vectors Hourglass with Lightning Bolt and Graph Bars Representing Time, Energy, and Productivity. Hourglass with sand flowing, a lightning bolt, and bar chart aligned as decreasing bars. Ideal for time management, efficiency, productivity, energy flow, deadlines, data analysis simple flat
Free with trial This image showcases a collection of twenty distinct vector icons, each illustrating various representations of increase and decrease graphs. Data analysis decrease vectors Collection of Twenty Vector Icons Depicting Increase and Decrease Graphs. This image showcases a collection of twenty distinct vector icons, each illustrating various representations of increase and decrease graphs.
Free with trial This graphic depicts data insights through a visually appealing bar chart connected by flowing lines, symbolizing the interconnectedness of data points and the flow of information. The varying heights of the bars represent different data values, showcasing growth or trends. The design is clean and. Data analysis decrease illustrations Data Insights Visualization. This graphic depicts data insights through a visually appealing bar chart connected by flowing lines, symbolizing the interconnectedness of data points and the flow of information. The varying heights of the bars represent different data values, showcasing growth or trends. The design is clean and
Free with trial A collection of minimalist outline icons representing finance and business data charts, symbols, and indicators for graphic design and web development. Data analysis decrease vectors Minimalist Outline Finance and Business Data Chart Symbol Icon Set. A collection of minimalist outline icons representing finance and business data charts, symbols, and indicators for graphic design and web development.
Free with trial Large pie chart alongside heart and drooping plant with dashed line. Ideal for data analysis, loss, emotional impact, decline, sustainability, environmental issues, simple flat metaphor. Data analysis decrease vectors Pie Chart with Heart Symbol and Wilting Plant Representing Decline and Emotional Impact. Large pie chart alongside heart and drooping plant with dashed line. Ideal for data analysis, loss, emotional impact, decline, sustainability, environmental issues, simple flat metaphor
Free with trial A hand holding a pen traces a red downward trending stock market chart, symbolizing a bear market or financial downturn. The background shows stock data. Data analysis decrease illustrations Bear Market Analysis: Hand with Pen Tracing a Declining Stock Chart. A hand holding a pen traces a red downward trending stock market chart, symbolizing a bear market or financial downturn. The background shows stock data
Free with trial A set of six black outline icons depicting magnifying glasses, graphs, a computer monitor displaying a waveform, and network connections. Data analysis decrease vectors Magnifying glass and data analysis icons with graphs and monitor search. A set of six black outline icons depicting magnifying glasses, graphs, a computer monitor displaying a waveform, and network connections
Free with trial A glowing green bar chart with a data line and grid on a black background, representing financial performance. Data analysis decrease illustrations Glowing Green Bar Chart with Data Line on photo Black graph finance. A glowing green bar chart with a data line and grid on a black background, representing financial performance
Free with trial Bar chart with upward trend, sad face, and analytics dashboard highlights challenges in progress or data performance. Ideal for financial difficulty, business risk, loss assessment, data analysis. Data analysis decrease vectors Rising Bar Graph with Sad Face Symbolizing Negative Growth or Challenges in Analytics. Bar chart with upward trend, sad face, and analytics dashboard highlights challenges in progress or data performance. Ideal for financial difficulty, business risk, loss assessment, data analysis
Free with trial Declining bar graph illustration, business, financial, and economic data. Data analysis decrease vectors Declining bar graph illustration, business, financial, and economic data
Free with trial A businessman in a suit analyzes financial data with a laptop. The concept represents improving quality while reducing costs to optimize business performance and increase profitability. Data analysis decrease illustrations Businessman analyzing data with cost and quality improvement concept. A businessman in a suit analyzes financial data with a laptop. The concept represents improving quality while reducing costs to optimize business performance and increase profitability
Free with trial Three-dimensional pie charts and cylinder graphs in orange and blue, perfect for business presentations illustrating data analysis and market trends. Data analysis decrease illustrations 3D Colorful Pie Charts and Cylinder Graphs for Business Presentation. Three-dimensional pie charts and cylinder graphs in orange and blue, perfect for business presentations illustrating data analysis and market trends.
Free with trial A chart showing a decrease with an arrow pointing down, isolated on a white background, representing a decline in data or performance. Data analysis decrease illustrations Decreasing chart with arrow isolated on white background. A chart showing a decrease with an arrow pointing down, isolated on a white background, representing a decline in data or performance
Free with trial A digital illustration showing a blue, dotted Earth globe overlaid with red and blue stock market trend lines, representing global market fluctuations and financial data analysis. Data analysis decrease illustrations Global Market Fluctuations: Red and Blue Stock Trends Over Earth Globe. A digital illustration showing a blue, dotted Earth globe overlaid with red and blue stock market trend lines, representing global market fluctuations and financial data analysis
Free with trial Decline bar chart with downward trend arrow outline icon. Decrease, loss, and financial drop symbol vector. Data analysis decrease vectors Decline bar chart with downward trend arrow outline icon. Decrease, loss, and financial drop symbol
Free with trial Illustrating market decline and data analysis with modern visual elements. Data analysis decrease vectors Red arrow downtrend graph and bar chart in digital and tech theme. Illustrating market decline and data analysis with modern visual elements.
Free with trial Illustrating market decline and data analysis with modern visual elements. Data analysis decrease vectors Red arrow downtrend graph and bar chart in digital and tech theme. Illustrating market decline and data analysis with modern visual elements.
Free with trial Growth and decline chart. Market trend analysis. Vector illustration. EPS 10. Stock image. Data analysis decrease vectors Growth and decline chart. Market trend analysis. Vector illustration. EPS 10.
Free with trial Increase decrease editable stroke line icons isolated on white background. Data analysis decrease vectors Increase decrease editable stroke line icons isolated on white background
Free with trial A 3D bar chart with red and green bars representing financial data trends, isolated on white background. Data analysis decrease illustrations 3d bar chart showing financial data trends isolated on white background. A 3D bar chart with red and green bars representing financial data trends, isolated on white background
Free with trial An abstract visualization blending climate change data with a winter landscape. The image conveys the convergence of data-driven insights and natural environment representation, showcasing patterns and trends of global warming. Generative AI. Data analysis decrease illustrations Abstract Representation of Climate Data Convergence in Winter Landscape. An abstract visualization blending climate change data with a winter landscape. The image conveys the convergence of data-driven insights and natural environment representation, showcasing patterns and trends of global warming. Generative AI
Free with trial Detailed 3D rendering of colorful bar charts, pie charts, line graphs, and calculator showcasing financial data analysis and business growth. Data analysis decrease illustrations Colorful 3D Business Charts, Graphs, and Calculator for Financial Success. Detailed 3D rendering of colorful bar charts, pie charts, line graphs, and calculator showcasing financial data analysis and business growth.
Free with trial A hand holding a pen traces a downward-sloping red line over a stock market data screen, symbolizing financial loss or a market crash. The image conveys a sense of concern and economic instability. The composition uses a shallow depth of field, focusing on the hand and the red line. Data analysis decrease illustrations Financial Downturn: Hand Tracing Red Stock Market Decline on Data Screen. A hand holding a pen traces a downward-sloping red line over a stock market data screen, symbolizing financial loss or a market crash. The image conveys a sense of concern and economic instability. The composition uses a shallow depth of field, focusing on the hand and the red line
Free with trial A visual representation of data showing a decline over a period. The blue bars are arranged in descending order of height, each marked with numerical indicators, suggesting a decrease in value or quantity. Data analysis decrease illustrations Blue bar chart showing decreasing trend over time with numerical labels. A visual representation of data showing a decline over a period. The blue bars are arranged in descending order of height, each marked with numerical indicators, suggesting a decrease in value or quantity
Free with trial A collection of modern, minimalist icons related to business, finance, and data analysis. The icons feature upward and downward trends, graphs, arrows, checkmarks, targets, and warning signs. The color scheme is primarily black and green, creating a clean and professional look. Ideal for presentations, websites, infographics, and marketing materials. Data analysis decrease vectors Set of Business and Finance Icons. A collection of modern, minimalist icons related to business, finance, and data analysis. The icons feature upward and downward trends, graphs, arrows, checkmarks, targets, and warning signs. The color scheme is primarily black and green, creating a clean and professional look. Ideal for presentations, websites, infographics, and marketing materials.
Free with trial Business decline bar chart icon with long shadow. Decrease, loss, and financial collapse sign symbol vector. Data analysis decrease vectors Business decline bar chart icon with long shadow. Decrease, loss, and financial collapse sign symbol
Free with trial This image shows a stock market graph with a downward trend, generated by AI. The red line vividly depicts a significant market decline, potentially indicating economic instability or investor uncertainty. Analyzing this data requires further context and analysis. Data analysis decrease illustrations AI-Generated Stock Market Decline. This image shows a stock market graph with a downward trend, generated by AI. The red line vividly depicts a significant market decline, potentially indicating economic instability or investor uncertainty. Analyzing this data requires further context and analysis.
Free with trial A detailed blue candlestick chart depicting stock market price fluctuations and trends over time Ideal for illustrating financial concepts market analysis and investment strategies The graphic is clean modern and visually engaging. Data analysis decrease illustrations Blue Financial Chart Candlestick Graph Showing Stock Market Trend Analysis. A detailed blue candlestick chart depicting stock market price fluctuations and trends over time Ideal for illustrating financial concepts market analysis and investment strategies The graphic is clean modern and visually engaging
Free with trial A graphic representation of financial data, prominently featuring a downward trending graph in shades of red. The visuals convey a sense of market decline and financial risk, suitable for illustrating economic downturn or cautionary business forecasts. Data analysis decrease illustrations Abstract Financial Data Representation with a Dominant Red Color Palette. A graphic representation of financial data, prominently featuring a downward trending graph in shades of red. The visuals convey a sense of market decline and financial risk, suitable for illustrating economic downturn or cautionary business forecasts
Free with trial Downward arrow with SALE, bar chart displaying data trends, and dynamic stick figure. Ideal for business, marketing, analysis, economics, sales, growth statistics simple flat metaphor. Data analysis decrease illustrations Arrow pointing downward labeled SALE with bar chart and dynamic figure symbolizing action. Downward arrow with SALE, bar chart displaying data trends, and dynamic stick figure. Ideal for business, marketing, analysis, economics, sales, growth statistics simple flat metaphor
Free with trial Abstract vector illustration of colorful bar graphs for business analysis and trends. Data analysis decrease vectors Multiple colorful bar charts abstractly representing data and statistics. Abstract vector illustration of colorful bar graphs for business analysis and trends.
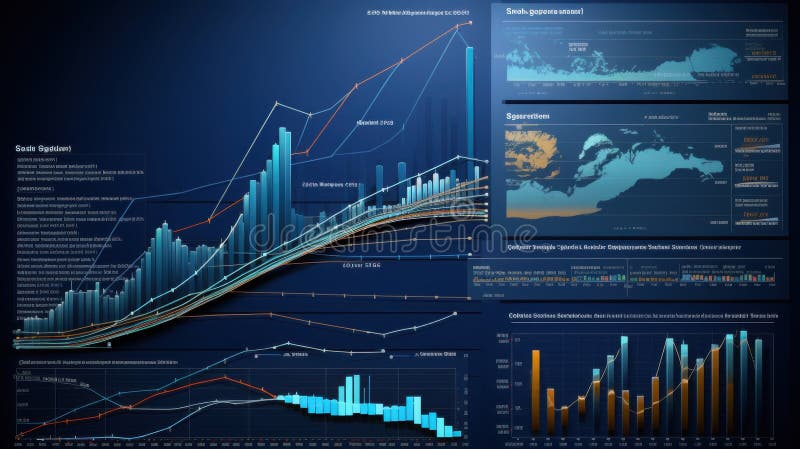
Free with trial Comprehensive data visualization with global charts and interactive graphs. Data analysis decrease illustrations Comprehensive data visualization with global charts and interactive graphs
Free with trial This image showcases colorful 3D rendered charts and graphs displayed on a digital tablet, perfect for business presentations or reports illustrating growth and data analysis. The vibrant colors and clean design make it visually appealing and easy to understand. Data analysis decrease illustrations Colorful 3D Charts and Graphs on Digital Tablet for Business Presentation. This image showcases colorful 3D rendered charts and graphs displayed on a digital tablet, perfect for business presentations or reports illustrating growth and data analysis. The vibrant colors and clean design make it visually appealing and easy to understand.
Free with trial A human hand is shown presenting a vivid, glowing yellow percentage symbol, radiating light and prominence. In the background, a digital bar chart visually represents growth and data analysis, set against a dark, abstract backdrop with subtle bokeh lights. This image powerfully conveys concepts related to finance, interest rates, discounts, business growth, profit, and investment. It's perfect for illustrating financial reports, economic articles, banking promotions, or investment strategy presentations. Data analysis decrease illustrations Financial Growth and Interest Rates Concept with Glowing Percentage Symbol. A human hand is shown presenting a vivid, glowing yellow percentage symbol, radiating light and prominence. In the background, a digital bar chart visually represents growth and data analysis, set against a dark, abstract backdrop with subtle bokeh lights. This image powerfully conveys concepts related to finance, interest rates, discounts, business growth, profit, and investment. It's perfect for illustrating financial reports, economic articles, banking promotions, or investment strategy presentations.
Free with trial View falling Trends in Market And Economic Downturn, Chart Analysis, Indicators , layered depth. Data analysis decrease illustrations View falling Trends in Market And Economic Downturn, Chart Analysis, Indicators
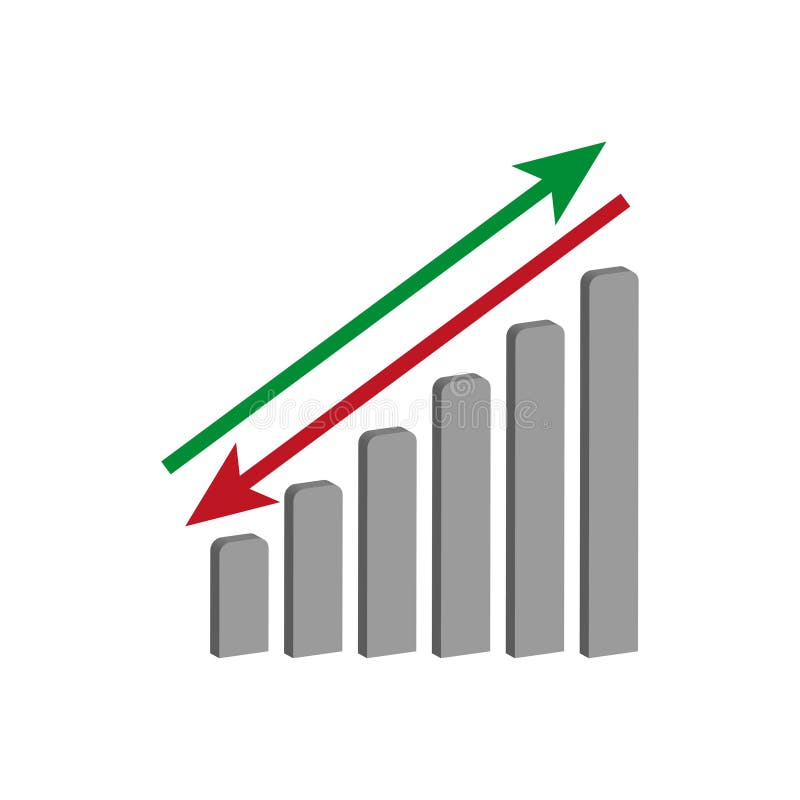
Free with trial A 3D illustration featuring a bar chart with four ascending blue bars of varying heights, representing data growth. To the right of the chart are two white arrows, one pointing upwards and the other downwards, symbolizing increase and decrease respectively. The entire graphic is presented on a clean white background. Data analysis decrease illustrations 3D Bar Chart with Up and Down Arrows on White Background graph statistics. A 3D illustration featuring a bar chart with four ascending blue bars of varying heights, representing data growth. To the right of the chart are two white arrows, one pointing upwards and the other downwards, symbolizing increase and decrease respectively. The entire graphic is presented on a clean white background
Free with trial Abstract 3D bar graph with red and teal bars on a white background. Illustrates data visualization and financial concepts. Data analysis decrease illustrations Abstract 3D Bar Graph Red and Teal Data Visualization on White. Abstract 3D bar graph with red and teal bars on a white background. Illustrates data visualization and financial concepts
Free with trial A stylized line graph icon with a purple gradient is displayed against a solid black background. The graph features four circular data points connected by angled lines, forming an upward trend. Data analysis decrease illustrations Stylized line graph icon with purple gradient on black background chart data. A stylized line graph icon with a purple gradient is displayed against a solid black background. The graph features four circular data points connected by angled lines, forming an upward trend
Free with trial Area chart illustrating trends in Sareorplojicam and S�snpavai across years. Shows variations over time. Data analysis decrease illustrations . Area chart illustrating trends in Sareorplojicam and S�snpavai across years. Shows variations over time
Free with trial A close-up of a hand reaching towards a glowing data graph, symbolizing the intersection of technology and finance, with vibrant colors representing growth and potential. Data analysis decrease illustrations Hand Touching Sparkling Data Graph with Vibrant Colors and Digital Elements. A close-up of a hand reaching towards a glowing data graph, symbolizing the intersection of technology and finance, with vibrant colors representing growth and potential
Free with trial Falling bar chart with a downward trending line and arrow indicating decrease. Data analysis decrease vectors Falling bar chart with a downward trending line and arrow indicating decrease
Free with trial Hand drawn bar chart illustration showing data statistics and business growth. Data analysis decrease vectors Hand drawn bar chart illustration showing data statistics and business growth
Free with trial Modern digital illustration showing a glowing neon 'Margin Call' alert over financial charts and data analytics interface, symbolizing trading loss and market downturn. Data analysis decrease illustrations Margin Call Concept with Stock Market Chart and Financial Data Visualization. Modern digital illustration showing a glowing neon 'Margin Call' alert over financial charts and data analytics interface, symbolizing trading loss and market downturn.
Free with trial Trend chart icons. Rising and falling bars. Arrow and bar graph. Economic data symbols. EPS 10. Data analysis decrease vectors Trend chart icons. Rising and falling bars. Arrow and bar graph. Economic data symbols.
Free with trial Pastel-colored bar chart and pie chart representing data and statistics, perfectly suitable for business presentations and reports. The 3D graphic is set against a plain white background, enhancing its visual appeal. Data analysis decrease illustrations Colorful 3D Bar and Pie Charts on White Cube Base: Business Data Visualization. Pastel-colored bar chart and pie chart representing data and statistics, perfectly suitable for business presentations and reports. The 3D graphic is set against a plain white background, enhancing its visual appeal.
Free with trial Modern abstract blue bars illustrating business statistics, trends, and analytics. Data analysis decrease vectors Digital data analysis bars in blue hues, conceptualizing statistics and trends. Modern abstract blue bars illustrating business statistics, trends, and analytics.
Free with trial Decline bar chart with downward trend arrow icon vector. Decrease, loss, and financial drop symbol on circle line. Data analysis decrease vectors Decline bar chart with downward trend arrow icon. Decrease, loss, and financial drop symbol on circle line
Free with trial Computer-generated world map, white continents, dark background, overlaid with red line and bar graphs showing downward trends, stylized global data visualization. Data analysis decrease illustrations Realistic White World Map Data Visualization Dark Background Red Graphs Trend. Computer-generated world map, white continents, dark background, overlaid with red line and bar graphs showing downward trends, stylized global data visualization
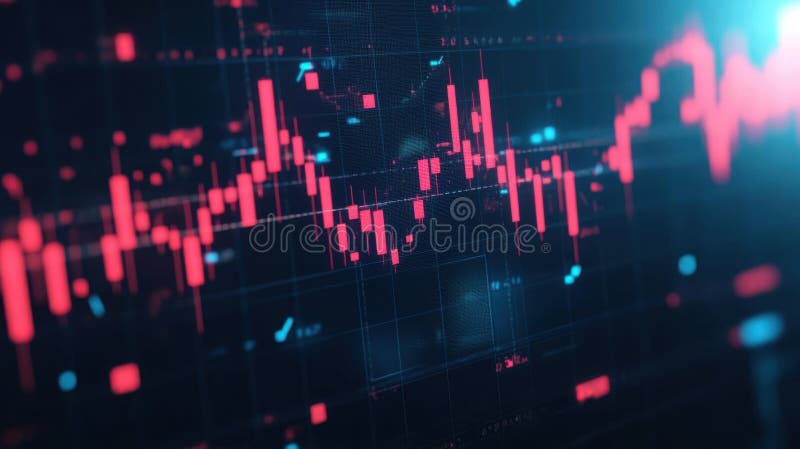
Free with trial Stock market chart with candlestick patterns in red and yellow, digital, on dark background, concept of financial analysis. 3D. Data analysis decrease illustrations Stock market chart with candlestick patterns in red and yellow, digital, on dark background, concept of financial analysis. 3D
Free with trial Declining bar chart with downward trend line, showing decrease and financial loss. Data analysis decrease vectors Declining bar chart with downward trend line, showing decrease and financial loss
Free with trial Statistic graph progress, financial profit growth, increase and decrease line icons set. Infographic charts with arrow, circles and bars thin black and red outline symbols vector illustration. Data analysis decrease vectors Statistic graph progress, financial profit growth, increase and decrease line icons set
Free with trial Futuristic cityscape rendered with a glowing red network of lines, representing interconnected data and technology, creating a dynamic and energetic scene. High quality photo. Data analysis decrease vectors Futuristic cityscape rendered with a glowing red network of lines, representing interconnected data and technology
Free with trial Candlestick chart on a dark blue background illustrating stock market trends. Light blue and white candlesticks represent price fluctuations, with wicks indicating high and low values. The chart shows an upward trend, suggesting potential financial growth or investment opportunities. Candlestick charts are commonly used in financial analysis to depict market movements, assisting in forecasting stock behaviors for strategic decision-making. Data analysis decrease illustrations Rising stock market analysis chart for smart investment decisions and financial growth in modern business. Candlestick chart on a dark blue background. Candlestick chart on a dark blue background illustrating stock market trends. Light blue and white candlesticks represent price fluctuations, with wicks indicating high and low values. The chart shows an upward trend, suggesting potential financial growth or investment opportunities. Candlestick charts are commonly used in financial analysis to depict market movements, assisting in forecasting stock behaviors for strategic decision-making.
Free with trial Wooden block with a downward arrow symbol, representing a decline or decrease, sits on a rustic wooden surface. Data analysis decrease illustrations Wooden block with an arrow symbol pointing down represents a decrease or decline. wooden block with a downward arrow symbol, representing a decline or decrease, sits on a rustic wooden surface.
Free with trial This 3D rendering showcases colorful bar graphs, pie charts, and a calculator, vividly illustrating concepts of business growth, financial success, and data analysis. The upward-trending arrow emphasizes positive progress. Data analysis decrease illustrations Colorful 3D Charts and Calculator Illustrating Business Growth and Financial Success. This 3D rendering showcases colorful bar graphs, pie charts, and a calculator, vividly illustrating concepts of business growth, financial success, and data analysis. The upward-trending arrow emphasizes positive progress.
Free with trial Colorful bar chart on a blue background illustrating data trends ,Generative ai. Data analysis decrease illustrations Vibrant bar chart on blue background, visualizing data trends and insights colorful. Colorful bar chart on a blue background illustrating data trends ,Generative ai
Free with trial Decline bar chart with downward trend arrow icon vector. Decrease, loss, and financial crisis symbol in black circle. Data analysis decrease vectors Decline bar chart with downward trend arrow icon. Decrease, loss, and financial crisis symbol in black circle
Free with trial Chess king symbolizing leadership beside a declining bar graph for strategy, business performance. Ideal for growth analysis, planning, decision-making, leadership vision, competition, management. Data analysis decrease illustrations Strategic planning concept with chess king and declining bar chart for business analysis insights. Chess king symbolizing leadership beside a declining bar graph for strategy, business performance. Ideal for growth analysis, planning, decision-making, leadership vision, competition, management
Free with trial A businessman in a suit analyzes financial data with a laptop. The concept represents improving quality while reducing costs to optimize business performance and increase profitability. Data analysis decrease illustrations Businessman analyzing data with cost and quality improvement concept. A businessman in a suit analyzes financial data with a laptop. The concept represents improving quality while reducing costs to optimize business performance and increase profitability
Free with trial Five oil barrels of varying sizes are arranged in a declining order. A bold orange arrow points downward, symbolizing a decrease in oil prices, illustrating market dynamics. Data analysis decrease illustrations Art collage, Oil barrel sizes decrease, reflecting energy market trends and price fluctuations. Five oil barrels of varying sizes are arranged in a declining order. A bold orange arrow points downward, symbolizing a decrease in oil prices, illustrating market dynamics
Free with trial High-detail image showing a dynamic orange graph line representing financial data trends and market fluctuations. Ideal for finance and business themes. Data analysis decrease illustrations Dynamic Orange Graph Line Representing Financial Data Trends and Market Fluctuations
Free with trial This 3D rendering showcases a vibrant bar chart illustrating business growth and financial performance. The colorful cylinders represent data points, rising to show increasing success. A line graph adds additional information about trends over time. Data analysis decrease illustrations Colorful 3D Bar Chart with Growth Graph Showing Business Success and Financial Data. This 3D rendering showcases a vibrant bar chart illustrating business growth and financial performance. The colorful cylinders represent data points, rising to show increasing success. A line graph adds additional information about trends over time.
Free with trial Blue arrow pointing downward on financial graph. Business chart showing descending trend. Digital stock market data visualization for decline analysis. Data analysis decrease illustrations Blue arrow pointing downward on financial graph. Business chart showing descending trend
Free with trial A blue line graph displays a sharp decrease in data points, isolated on a clean white background. Data analysis decrease illustrations Line graph showing a steep decline in values over time isolated on white background. A blue line graph displays a sharp decrease in data points, isolated on a clean white background
Free with trial Close-up of a modern computer screen displaying stock market data and financial charts. Data analysis decrease illustrations Analyzing live stock market data on a computer screen, offering insights into trends. Close-up of a modern computer screen displaying stock market data and financial charts.
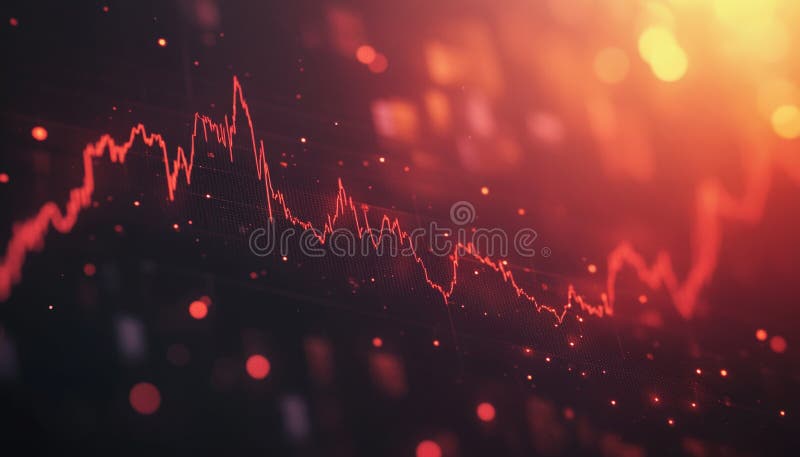
Free with trial Downward Trending Graph On Stock Market Display With Red Data Points And A Fiery Red Glow, Generated by AI. Data analysis decrease illustrations Downward Trending Graph On Stock Market Display With Red Data Points And A Fiery Red Glow
Free with trial A digital illustration depicting a financial chart with blue and red bars and lines. Neon glows accentuate the data points. The style is abstract and modern. Data analysis decrease illustrations Abstract Blue Red Financial Data Chart Graph Digital Illustration Neon Glow business. A digital illustration depicting a financial chart with blue and red bars and lines. Neon glows accentuate the data points. The style is abstract and modern
Free with trial Simple Blue Analytics Diagram Bar Chart Showing Variable Data Trends on White Background � Simple Abstract Business and Analytics Infographic Illustration. Data analysis decrease illustrations Simple Blue Analytics Diagram Bar Chart Showing Variable Data Trends on White Background
Free with trial Descending data analytics line graphic outline icon in white and black colors. descending data analytics line graphic flat vector icon from business collection for web, mobile apps and ui. Data analysis decrease vectors Descending data analytics line graphic outline icon in white and black colors. descending data analytics line graphic flat vector
Free with trial Digital financial ticker display is showing real‑time market data with arrows in flat design. Finance, technology, analytics, data, stock, investment, digital. Data analysis decrease illustrations Digital financial ticker display is showing real?time market data with arrows in flat design. Digital financial ticker display is showing real‑time market data with arrows in flat design. Finance, technology, analytics, data, stock, investment, digital