Free with trial Green bar graph illustrating continuous growth or progress. Bar chart decrease illustrations Green bar graph illustrating continuous growth or progress.
Free with trial A simple bar graph illustrating upward growth and financial success. Ideal for presentations, reports, and website use. Bar chart decrease vectors Upward Trending Bar Graph: Business Growth and Financial Success. A simple bar graph illustrating upward growth and financial success. Ideal for presentations, reports, and website use.
Free with trial Graph line icon. Continuous line with share plane. Column chart sign. Growth diagram symbol. 3d heart in speech bubble. Graph chart single line ribbon. Loop curve pattern. Vector. Bar chart decrease vectors Graph line icon. Column chart sign. Continuous line with plane. Vector. Graph line icon. Continuous line with share plane. Column chart sign. Growth diagram symbol. 3d heart in speech bubble. Graph chart single line ribbon. Loop curve pattern. Vector
Free with trial Three black vertical bars of decreasing height on a white background, symbolizing a decline. Bar chart decrease illustrations Black vertical bars representing a descending bar chart on white background graph. Three black vertical bars of decreasing height on a white background, symbolizing a decline
Free with trial A visual representation of data trends, highlighting both positive progress and areas of concern with distinct markers for clarity and decision-making. Bar chart decrease illustrations Bar chart showing growth with red crosses indicating issues. A visual representation of data trends, highlighting both positive progress and areas of concern with distinct markers for clarity and decision-making
Free with trial A dynamic 3D visualization showcasing financial data. The scene features a rising bar chart with an upward trend arrow, symbolizing growth and success. Adjacent to it, a colorful pie chart represents data segmentation and distribution. The background is a dark, textured surface with subtle grid lines and abstract chart elements, creating a sophisticated and modern aesthetic. This imagery is ideal for presentations, reports, and digital content related to finance, business, economics, and data analysis. Bar chart decrease illustrations 3D Financial Data Visualization: Growth Charts and Pie Graph. A dynamic 3D visualization showcasing financial data. The scene features a rising bar chart with an upward trend arrow, symbolizing growth and success. Adjacent to it, a colorful pie chart represents data segmentation and distribution. The background is a dark, textured surface with subtle grid lines and abstract chart elements, creating a sophisticated and modern aesthetic. This imagery is ideal for presentations, reports, and digital content related to finance, business, economics, and data analysis.
Free with trial Two bar graphs, one green showing upward growth and one red showing downward decline, against a white background. Bar chart decrease illustrations Rising and falling bar graphs illustrating financial trends. Two bar graphs, one green showing upward growth and one red showing downward decline, against a white background
Free with trial Black triangular warning sign displaying a downward trending bar graph on a white background. Bar chart decrease illustrations Warning sign with a downward trending bar graph on a white background danger caution. Black triangular warning sign displaying a downward trending bar graph on a white background
Free with trial A black bar graph showing a decline with the word disinflation below it on a white background. Bar chart decrease illustrations Declining bar graph with the word disinflation on a white background economy price. A black bar graph showing a decline with the word disinflation below it on a white background
Free with trial This image features a minimalist black and white bar graph icon, depicting data analysis. It includes vertical bars of varying heights along horizontal and vertical axes. Bar chart decrease vectors Simple Black and White Bar Graph Icon for Data Visualization. This image features a minimalist black and white bar graph icon, depicting data analysis. It includes vertical bars of varying heights along horizontal and vertical axes.
Free with trial Data Stats Board Display Icon Downward Down Trend Statistic Performance Market Decline Economy Downturn Bar Graph Progress Sign Symbol Presentation. Bar chart decrease vectors Data Stats Board Display Icon Downward Down Trend Statistic Performance Market Decline Economy Downturn Bar Graph Progress
Free with trial This image showcases a comprehensive collection of blue bar graphs and line graphs, presented in a grid format. Each graph depicts various data trends, including upward and downward movements, fluctuating patterns, and steady growth. The clean, modern design makes these icons ideal for representing financial data, market analysis, performance metrics, and business growth in presentations, reports, and websites. Bar chart decrease illustrations Collection of Blue Bar and Line Graphs for Business Analytics. This image showcases a comprehensive collection of blue bar graphs and line graphs, presented in a grid format. Each graph depicts various data trends, including upward and downward movements, fluctuating patterns, and steady growth. The clean, modern design makes these icons ideal for representing financial data, market analysis, performance metrics, and business growth in presentations, reports, and websites.
Free with trial Graph line icon. Neumorphic, Flat shadow, 3d buttons. Column chart sign. Growth diagram symbol. Line graph chart icon. Social media icons. Vector. Bar chart decrease vectors Graph line icon. Column chart sign. Neumorphic buttons. Vector. Graph line icon. Neumorphic, Flat shadow, 3d buttons. Column chart sign. Growth diagram symbol. Line graph chart icon. Social media icons. Vector
Free with trial Declining business graph chart showing downward trend in finances. Bar chart decrease vectors Declining business graph chart showing downward trend in finances
Free with trial Business bar graph icon vector with upward and downward arrow. Trend analysis symbol with long shadow. Bar chart decrease vectors Business bar graph icon with upward and downward arrow. Trend analysis symbol with long shadow
Free with trial A hand holds a glowing blue bar graph with a downward trending arrow and the word COST above. Bar chart decrease illustrations Man holding glowing cost reduction graph with downward arrow chart financial. A hand holds a glowing blue bar graph with a downward trending arrow and the word COST above
Free with trial This image features a bar graph with red bars indicating a downward trend. The graph is isolated on a white background, making the red bars and the downward arrow clearly visible. The image is suitable for representing declining metrics or statistics. Bar chart decrease illustrations Decreasing bar graph isolated on white background. This image features a bar graph with red bars indicating a downward trend. The graph is isolated on a white background, making the red bars and the downward arrow clearly visible. The image is suitable for representing declining metrics or statistics
Free with trial Colorful bar graph with downward trend, business concept illustration. Bar chart decrease vectors Colorful bar graph with downward trend, business concept illustration
Free with trial Graph line icon. Halftone dotted pattern. Gradient icon with grain shadow. Column chart sign. Ab test diagram symbol. Line graph chart icon. Various designs. Vector. Bar chart decrease vectors Graph line icon. Column chart sign. Halftone dotted pattern. Vector. Graph line icon. Halftone dotted pattern. Gradient icon with grain shadow. Column chart sign. Ab test diagram symbol. Line graph chart icon. Various designs. Vector
Free with trial A bar graph with descending blue, yellow, and red bars, accompanied by a downward-pointing arrow, symbolizes economic decline or negative trends on a clean white background. Bar chart decrease illustrations Colorful Bar Graph with Downward Arrow Illustrating Economic Decline. A bar graph with descending blue, yellow, and red bars, accompanied by a downward-pointing arrow, symbolizes economic decline or negative trends on a clean white background
Free with trial A digital financial chart shows upward market trends. The red line and green bars rise against a grid. A gold data network overlay adds depth to the business graphic. Bar chart decrease illustrations Growing Financial Chart Shows Market Growth With Data Grid Background. A digital financial chart shows upward market trends. The red line and green bars rise against a grid. A gold data network overlay adds depth to the business graphic.
Free with trial This infographic-style image visually represents business growth and financial performance through various charts and graphs. A line graph illustrates revenue trends with percentage markers, a donut chart displays market share distribution, and a bar chart shows quarterly profit figures. Icons representing data, growth, and reports are subtly integrated into the background, creating a professional and informative visual for business and finance-related content. Bar chart decrease illustrations Business Growth and Financial Performance Analytics. This infographic-style image visually represents business growth and financial performance through various charts and graphs. A line graph illustrates revenue trends with percentage markers, a donut chart displays market share distribution, and a bar chart shows quarterly profit figures. Icons representing data, growth, and reports are subtly integrated into the background, creating a professional and informative visual for business and finance-related content.
Free with trial Business bar graph with upward and downward arrow. Trend analysis icon vector. Bar chart decrease vectors Business bar graph with upward and downward arrow. Trend analysis icon
Free with trial Abstract stock market chart with red and green candlesticks illustrating financial data and trading trends. Perfect for representing economic analysis, investment strategies, or business reporting. Bar chart decrease illustrations Dynamic Stock Market Chart Displaying Fluctuating Trends and Analytics. Abstract stock market chart with red and green candlesticks illustrating financial data and trading trends. Perfect for representing economic analysis, investment strategies, or business reporting
Free with trial Business bar graph icon with upward and downward arrow. Trend analysis symbol vector in circular outline. Bar chart decrease vectors Business bar graph icon with upward and downward arrow. Trend analysis symbol in circular outline
Free with trial White Bar Graph Decreasing on Light Blue Background. Bar chart decrease illustrations White Bar Graph Decreasing on Light Blue Background
Free with trial Conceptual graph with decrease report. Dark diagram with recession and bankruptcy progress. Business and finance vector illustration. Bar chart decrease vectors Conceptual graph with decrease report. Dark diagram with recession and bankruptcy progress. Business and finance vector
Free with trial A vibrant collection of hand-drawn business charts and graphs, rendered in blue tones. The set includes various types of visualizations like bar charts, line graphs, and a pie chart, all with a sketchy, illustrative style. These visuals are ideal for presentations, reports, and infographics related to finance, data analysis, growth, and business performance. Bar chart decrease illustrations Hand-Drawn Business Charts and Graphs Collection. A vibrant collection of hand-drawn business charts and graphs, rendered in blue tones. The set includes various types of visualizations like bar charts, line graphs, and a pie chart, all with a sketchy, illustrative style. These visuals are ideal for presentations, reports, and infographics related to finance, data analysis, growth, and business performance.
Free with trial A stark red bar graph illustrates a sharp downward trend with a prominent arrow, visually representing financial decline, economic recession, or business failure. Bar chart decrease illustrations Red bar graph with downward arrow isolated on white background. A stark red bar graph illustrates a sharp downward trend with a prominent arrow, visually representing financial decline, economic recession, or business failure
Free with trial Diagram with recession and bankruptcy. Graph with decrease report. Business and finance vector illustration. Bar chart decrease vectors Diagram with recession and bankruptcy. Graph with decrease report. Business and finance vector
Free with trial This 3D rendering showcases stacks of Bitcoin-like coins alongside a rising bar graph, illustrating cryptocurrency market growth. The image is generated by AI and ideal for illustrating financial concepts related to digital currencies. Bar chart decrease illustrations Cryptocurrency Growth Chart. This 3D rendering showcases stacks of Bitcoin-like coins alongside a rising bar graph, illustrating cryptocurrency market growth. The image is generated by AI and ideal for illustrating financial concepts related to digital currencies.
Free with trial Colorful bar graph with stacked segments illustrating growth and data analysis. Bar chart decrease vectors Colorful bar graph with stacked segments illustrating growth and data analysis
Free with trial The image depicts a bar graph displayed on an easel, illustrating a downward trend over time. The bars start high on the left and progressively decrease in height towards the right, with a red arrow emphasizing the decline. The graph's y-axis appears to measure an unspecified metric, while the x-axis represents a timeline. Bar chart decrease illustrations Graph showing decline over time. The image depicts a bar graph displayed on an easel, illustrating a downward trend over time. The bars start high on the left and progressively decrease in height towards the right, with a red arrow emphasizing the decline. The graph's y-axis appears to measure an unspecified metric, while the x-axis represents a timeline
Free with trial Analytics graph line icon. Neumorphic, Flat shadow, 3d buttons. Column chart sign. Growth diagram symbol. Line analytics graph icon. Social media icons. Vector. Bar chart decrease vectors Analytics graph line icon. Column chart sign. Neumorphic buttons. Vector. Analytics graph line icon. Neumorphic, Flat shadow, 3d buttons. Column chart sign. Growth diagram symbol. Line analytics graph icon. Social media icons. Vector
Free with trial A colorful bar graph with a line graph overlayed on a blue background. it shows data trends and market analysis in a simple visual format. Bar chart decrease vectors Colorful bar graph with a line graph on a blue background. a colorful bar graph with a line graph overlayed on a blue background. it shows data trends and market analysis in a simple visual format
Free with trial This image shows two bar graphs. One shows an upward trend with an arrow pointing up. The other shows a downward trend with an arrow pointing down. Black and white. Bar chart decrease illustrations Black and white illustration showing upward and downward trending bar graphs with arrows pointing up down. This image shows two bar graphs. One shows an upward trend with an arrow pointing up. The other shows a downward trend with an arrow pointing down. Black and white.
Free with trial A visual representation of financial losses or declining market trends, ideal for economic reports and business analysis presentations. Bar chart decrease illustrations Bar chart showing a significant decline, emphasized by a red arrow pointing downwards and a magnifying glass. A visual representation of financial losses or declining market trends, ideal for economic reports and business analysis presentations
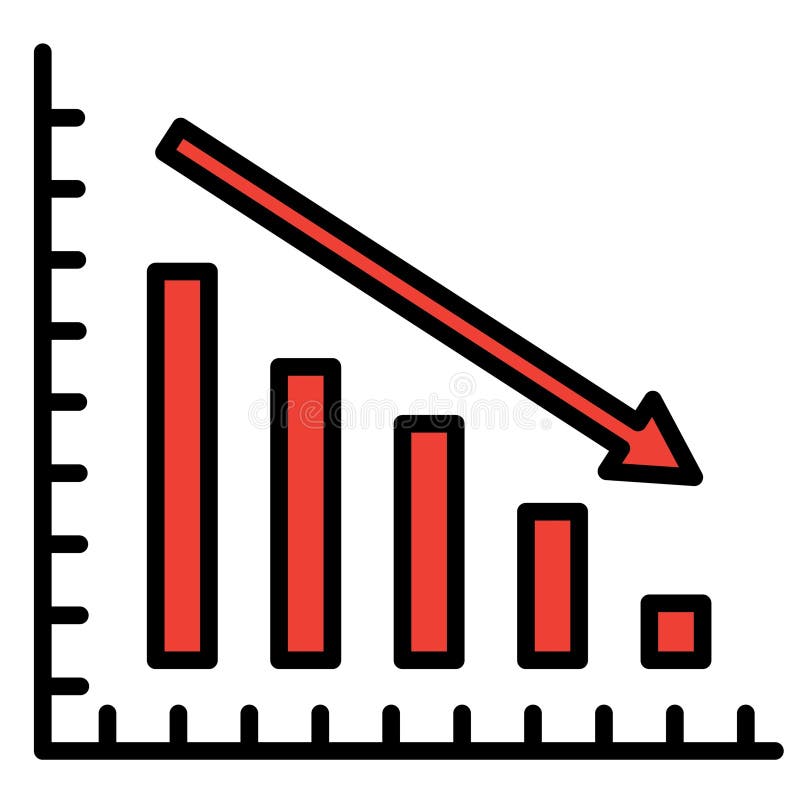
Free with trial This image shows a bar graph with a downward trend, indicated by a red arrow. It represents a decline in business, finance, or the economy, isolated on white. Bar chart decrease illustrations A bar graph showing a downward trend with a red arrow isolated on white background. This image shows a bar graph with a downward trend, indicated by a red arrow. It represents a decline in business, finance, or the economy, isolated on white
Free with trial ?a high-quality 3d illustration of a miniature wooden house placed on the tallest block of a declining bar graph . set on a wooden table with soft natural sunlight from a window, this image conceptualizes debt reduction, mortgage payments, decreasing real estate prices, or strategic financial planning for home ownership. Bar chart decrease illustrations Wooden house model on descending bar chart representing mortgage reduction or property market analysis. ?a high-quality 3d illustration of a miniature wooden house placed on the tallest block of a declining bar graph. set on a wooden table with soft natural sunlight from a window, this image conceptualizes debt reduction, mortgage payments, decreasing real estate prices, or strategic financial planning for home ownership.
Free with trial A conceptual vector illustration depicting business analysis and market research. A hand holds a magnifying glass, focusing on a colorful financial chart with bar and line graphs labeled 'Market Trends'. Surrounding icons represent key business metrics like growth, decline, market share, and innovation. This flat design graphic is ideal for presentations, reports, and web content related to data analytics, strategic planning, and financial performance evaluation, symbolizing the scrutiny of data to identify opportunities and understand market dynamics. Bar chart decrease illustrations Business Analysis and Market Trends Concept with Magnifying Glass. A conceptual vector illustration depicting business analysis and market research. A hand holds a magnifying glass, focusing on a colorful financial chart with bar and line graphs labeled 'Market Trends'. Surrounding icons represent key business metrics like growth, decline, market share, and innovation. This flat design graphic is ideal for presentations, reports, and web content related to data analytics, strategic planning, and financial performance evaluation, symbolizing the scrutiny of data to identify opportunities and understand market dynamics.
Free with trial Five colorful bars, resembling a chart, visually represent a downward trend. The bars are yellow, green, blue and purple. Bar chart decrease vectors Colorful bar chart illustration showing declining trend on transparent background. Five colorful bars, resembling a chart, visually represent a downward trend. The bars are yellow, green, blue and purple.
Free with trial Growth and decline chart icon. Green upward and red downward arrow symbol illustration. Bar chart decrease vectors Growth and decline chart icon. Green upward and red downward arrow symbol
Free with trial Conceptual graph with decrease report. Diagram with recession and bankruptcy progress. Business and finance vector illustration. Bar chart decrease vectors Conceptual graph with decrease report. Diagram with recession and bankruptcy progress. Business and finance vector
Free with trial Calendar graph line icon. Halftone dotted pattern. Gradient icon with grain shadow. Column chart sign. Growth diagram symbol. Line calendar graph icon. Various designs. Vector. Bar chart decrease vectors Calendar graph line icon. Column chart sign. Halftone dotted pattern. Vector. Calendar graph line icon. Halftone dotted pattern. Gradient icon with grain shadow. Column chart sign. Growth diagram symbol. Line calendar graph icon. Various designs. Vector
Free with trial Financial Growth Chart on a Suitcase Business Investment Economy Graphic Illustration. Bar chart decrease vectors Financial Growth Chart on a Suitcase Business Investment Economy Graphic Illustration
Free with trial Falling bar chart with a red warning sign signifies financial risk and economic decline, suggesting the need for caution in investing and business strategies. Bar chart decrease illustrations Declining Chart with Warning Sign Illustrating Market Downturn. Falling bar chart with a red warning sign signifies financial risk and economic decline, suggesting the need for caution in investing and business strategies
Free with trial Simple line art business icons set featuring a magnifying glass, minus symbol, pie chart, and rising bar graph for financial data analysis. Bar chart decrease vectors Simple line art business icons set featuring a magnifying glass, minus symbol, pie chart, and rising bar graph for
Free with trial Visual representation of financial trends with euro symbols, depicting both upward and downward movements in bar graph format, suitable for economic analysis. Bar chart decrease vectors Bar charts showing euro currency growth and decline isolated on transparent background. Visual representation of financial trends with euro symbols, depicting both upward and downward movements in bar graph format, suitable for economic analysis
Free with trial Understanding bar graph charts data analysis and visualization for business and financial performance metrics. Bar chart decrease vectors Understanding bar graph charts data analysis and visualization for business
Free with trial Graphs set with line charts, bar charts, and scatter plots illustrating upward and downward trends with arrows and data points. Bar chart decrease vectors Graphs set with line charts, bar charts, and scatter plots illustrating upward and
Free with trial Decreasing graph line icon. Halftone dotted pattern. Gradient icon with grain shadow. Column chart sign. Crisis diagram symbol. Line decreasing graph icon. Various designs. Vector. Bar chart decrease vectors Decreasing graph line icon. Crisis chart sign. Halftone dotted pattern. Vector. Decreasing graph line icon. Halftone dotted pattern. Gradient icon with grain shadow. Column chart sign. Crisis diagram symbol. Line decreasing graph icon. Various designs. Vector
Free with trial 3D illustration of a red bar chart with a downward arrow, isolated on a transparent background. Symbolizes financial loss, economic crisis, revenue drop, or business decline. Ideal for presentations, finance reports, investment warnings, stock market analysis, and economic downturn visuals. Bar chart decrease illustrations 3D Red Downward Arrow Graph Icon Showing Financial Decline on Transparent Background. 3D illustration of a red bar chart with a downward arrow, isolated on a transparent background. Symbolizes financial loss, economic crisis, revenue drop, or business decline. Ideal for presentations, finance reports, investment warnings, stock market analysis, and economic downturn visuals.
Free with trial Graph line icon. Neumorphic, Flat shadow, 3d buttons. Column chart sign. Growth diagram symbol. Line graph chart icon. Social media icons. Vector. Bar chart decrease vectors Graph line icon. Column chart sign. Neumorphic buttons. Vector. Graph line icon. Neumorphic, Flat shadow, 3d buttons. Column chart sign. Growth diagram symbol. Line graph chart icon. Social media icons. Vector
Free with trial Brightly colored wooden blocks arranged as a bar graph with one block falling represents decline Use for financial or business illustrations. Bar chart decrease illustrations Colorful Wooden Blocks Forming a Graph, One Falling, on Data Chart. Brightly colored wooden blocks arranged as a bar graph with one block falling represents decline Use for financial or business illustrations
Free with trial An eye-catching 3D bar graph illustration with yellow, blue, and red elements. It is designed to represent data or growth concepts. Bar chart decrease vectors Colorful 3D bar graph illustration showing descending values on transparent background. An eye-catching 3D bar graph illustration with yellow, blue, and red elements. It is designed to represent data or growth concepts.
Free with trial Illustration depicting a financial downturn, featuring stacks of gold coins, a blue bar graph showing a decline, and a red arrow pointing downwards, all set against a white background. Bar chart decrease illustrations Financial decline with gold coins and bar graph. Illustration depicting a financial downturn, featuring stacks of gold coins, a blue bar graph showing a decline, and a red arrow pointing downwards, all set against a white background
Free with trial A vibrant bar graph shows an upward trend with a green arrow, indicating growth. The bars are blue, yellow, green, and red, set against a clean white background. Bar chart decrease illustrations Colorful Bar Graph with Upward Trend Line and Green Arrow Indicator on White Background. A vibrant bar graph shows an upward trend with a green arrow, indicating growth. The bars are blue, yellow, green, and red, set against a clean white background
Free with trial Modern, minimalistic chart icon for business and finance. Bar chart decrease illustrations Modern, minimalistic chart icon for business and finance
Free with trial Business decline and economic recession concept with a falling bar graph and a downward red arrow. Bar chart decrease vectors Business decline and economic recession concept with a falling bar graph and a downward red arrow
Free with trial Broker trader analyzing economic crisis. Trade exchange, financial decrease, bed business strategy, digital asset, loss investment fund, online broker, stock collapse and crisis concept. Bar chart decrease illustrations Broker trader analyzing economic crisis. Trade exchange, financial decrease
Free with trial Red bar graph with decreasing values. Generative AI. Bar chart decrease illustrations Red bar graph with decreasing values
Free with trial Candlestick Chart vector Professional Financial Trading concept icon or symbol. Bar chart decrease vectors Candlestick Chart vector Professional Financial Trading icon or symbol
Free with trial Ai-Generated. a collection of twentyone minimalistic graph chart icons these icons illustrate different types of data trends suitable for representing business information, statistical analysis, and financial reports each icon features a unique line graph, bar chart, or diagram style. Bar chart decrease vectors Collection of minimalistic graph chart icons presenting different types of business data trends. Ai-Generated. a collection of twentyone minimalistic graph chart icons these icons illustrate different types of data trends suitable for representing business information, statistical analysis, and financial reports each icon features a unique line graph, bar chart, or diagram style
Free with trial Candlestick Chart Analysis vector Cryptocurrency Trading concept icon or symbol. Bar chart decrease vectors Candlestick Chart Analysis vector Cryptocurrency Trading icon or symbol
Free with trial An upward trending bar graph displayed on a laptop screen, illuminated against a backdrop of blurred city lights at night. Shows financial success and progress. Bar chart decrease illustrations Financial Growth Chart on Laptop Screen at Night. An upward trending bar graph displayed on a laptop screen, illuminated against a backdrop of blurred city lights at night. Shows financial success and progress.
Free with trial Pastel-colored bar graph with downward trending arrow illustrates financial decline or loss This image is suitable for business presentations or economic reports. Bar chart decrease illustrations Declining Bar Graph with Arrow Showing Downtrend, Financial Loss Concept. Pastel-colored bar graph with downward trending arrow illustrates financial decline or loss This image is suitable for business presentations or economic reports
Free with trial The image depicts a bar graph with a downward trend. The graph has blue bars representing data values that decrease from left to right. A large red arrow further emphasizes the downward trend, indicating a significant decline in the data over time. The graph is displayed on an easel with wooden legs. Bar chart decrease illustrations Graph showing decline in data. The image depicts a bar graph with a downward trend. The graph has blue bars representing data values that decrease from left to right. A large red arrow further emphasizes the downward trend, indicating a significant decline in the data over time. The graph is displayed on an easel with wooden legs
Free with trial The image shows a bar graph placed on top of an open financial report book. The bar graph displays data with blue bars of varying heights, and two lines are plotted across the bars, one red and one blue. The graph appears to be indicating trends or comparisons over time. The financial report book underneath has detailed tables and charts, suggesting a thorough analysis of financial data. Bar chart decrease illustrations Bar graph on financial report. The image shows a bar graph placed on top of an open financial report book. The bar graph displays data with blue bars of varying heights, and two lines are plotted across the bars, one red and one blue. The graph appears to be indicating trends or comparisons over time. The financial report book underneath has detailed tables and charts, suggesting a thorough analysis of financial data
Free with trial Bar graphs with various upward and downward trending arrows and a stylized dollar sign indicating financial growth and decline. Bar chart decrease vectors Bar graphs with various upward and downward trending arrows and a stylized dollar sign
Free with trial Graph bars shrink steadily from left side toward right.. Bold arrow points down, emphasizing drop.. Monochrome tones highlight sharp decline. Bar chart decrease vectors Downward trend bar chart with declining arrow illustration. Graph bars shrink steadily from left side toward right.. Bold arrow points down, emphasizing drop.. Monochrome tones highlight sharp decline
Free with trial Icon carbon emissions trading with CO2 cloud and downward arrow, financial chart bars and dollar sign, climate policy concept for carbon market, offset and pricing. Bar chart decrease vectors Icon carbon emissions trading with CO2 cloud and downward arrow, financial chart bars and
Free with trial A grid of black and white icons depicting financial charts with rising and falling trends, magnifying glasses with download arrows, and dollar signs. Bar chart decrease vectors Collection of black and white icons representing financial charts and data analysis graph bar chart. A grid of black and white icons depicting financial charts with rising and falling trends, magnifying glasses with download arrows, and dollar signs
Free with trial Colorful wooden blocks arranged in a bar graph formation on a weathered wooden surface , artistic vibe. Bar chart decrease illustrations Colorful wooden blocks arranged in a bar graph formation on a weathered wooden surface
Free with trial A visual representation of business growth and financial data with 3D charts. This image effectively conveys concepts of analytics, progress, and reporting in a modern and engaging way. Bar chart decrease illustrations 3d bar chart and pie chart representing financial data and growth on a blueprint isolated on white background. A visual representation of business growth and financial data with 3D charts. This image effectively conveys concepts of analytics, progress, and reporting in a modern and engaging way
Free with trial Broker trader analyzing economic crisis. Trade exchange, financial decrease, bed business strategy, digital asset, loss investment fund, online broker, stock collapse and crisis concept. Bar chart decrease illustrations Broker trader analyzing economic crisis. Trade exchange, financial decrease
Free with trial A visual representation of financial data showing a decline in performance, with red bars and arrows indicating a downward trend in the market. Bar chart decrease illustrations Bar chart with downward trend isolated on white background. A visual representation of financial data showing a decline in performance, with red bars and arrows indicating a downward trend in the market
Free with trial Hand-drawn illustration of a bar graph with bars and a prominent arrow showcasing a downward trend. Concepts of decline, loss, or negative growth in various business and educational settings. Bar chart decrease vectors Hand-Drawn Decreasing Bar Graph Illustration. hand-drawn illustration of a bar graph with bars and a prominent arrow showcasing a downward trend. Concepts of decline, loss, or negative growth in various business and educational settings
Free with trial This graphic features a stylized bar chart with a descending red arrow, symbolizing a downward trend. The image is presented in a split design, with the left side on a white background and the right side on a red background. This visual metaphor is ideal for representing financial losses, declining performance, economic downturns, or any situation indicating a negative trajectory. Its clean, minimalist style makes it versatile for various business, financial, and analytical contexts. Bar chart decrease illustrations Red Downward Trend Graph with Arrow. This graphic features a stylized bar chart with a descending red arrow, symbolizing a downward trend. The image is presented in a split design, with the left side on a white background and the right side on a red background. This visual metaphor is ideal for representing financial losses, declining performance, economic downturns, or any situation indicating a negative trajectory. Its clean, minimalist style makes it versatile for various business, financial, and analytical contexts.
Free with trial The image depicts a bar chart with yellow bars of decreasing height from left to right, indicating a downward trend. A red line with an arrowhead follows the tops of the bars, reinforcing the declining pattern. The arrowhead at the end of the line points downward to the right, symbolizing a reduction or decrease over time. Bar chart decrease illustrations Graph showing a downward trend with a red arrow and yellow bars. The image depicts a bar chart with yellow bars of decreasing height from left to right. The image depicts a bar chart with yellow bars of decreasing height from left to right, indicating a downward trend. A red line with an arrowhead follows the tops of the bars, reinforcing the declining pattern. The arrowhead at the end of the line points downward to the right, symbolizing a reduction or decrease over time